
|
|
Font Size:
|
||||
|
|
|
|
||||
STATISTICAL BRIEF #126:
Out-of-Pocket Health Care Expenses by Age and Insurance Coverage, 2003
Highlights
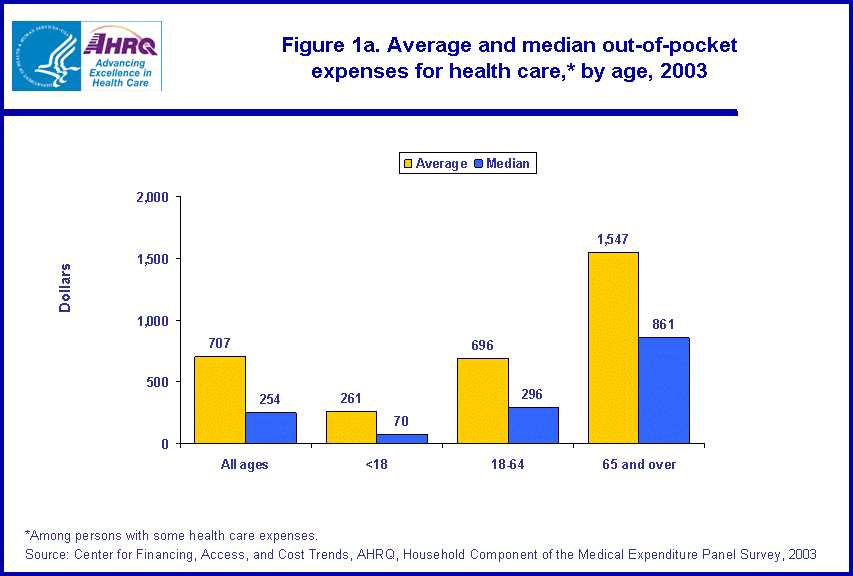
- In 2003, an average of $707 was paid out of pocket for health care among persons with some health care expenses. Overall, half of persons with some health care expenses had out-of-pocket payments of less than or equal to $254 (median), and half paid more than $254.
- Average out-of-pocket expenses increased with age, ranging from $261 among children under 18 to $1,547 among persons age 65 and over.
- Out-of-pocket expenses varied substantially by type of insurance coverage across all age groups, with persons under 65 covered by public insurance only and persons age 65 and over covered by Medicare and other public insurance having lower median levels of out-of-pocket expenses.
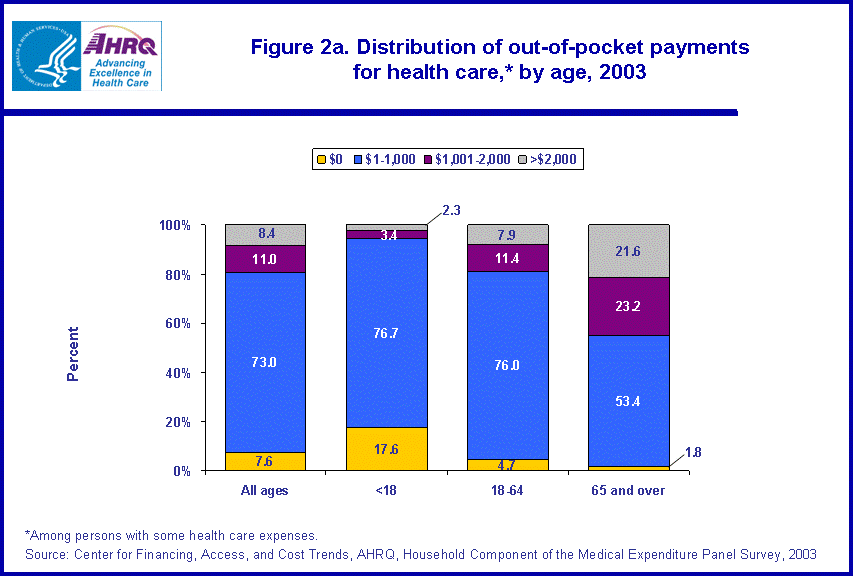
- Overall, 19.4 percent of persons had out-of-pocket expenses greater than $1,000, and 8.4 percent had expenses greater than $2,000. The percentage of persons with high levels of out-of-pocket expenses increased substantially with age.
Introduction
In 2003, about 85 percent of persons under 65 and 96 percent of the elderly had some expenditure for health care. In the aggregate, about one of every five dollars spent on health care (excluding health insurance premiums) was paid out of pocket by individuals and families. Annual levels of out-of-pocket expenses for individuals are affected by several factors, including whether the person is insured, the generosity of insurance for those with coverage, and frequency of health care use. Variations in out-of-pocket expenses across different segments of the population are important to understand because of their financial burden implications and potential impact on access to and use of health care.
This Statistical Brief uses data from the Household Component of the Medical Expenditure Panel Survey (MEPS-HC) for 2003 to examine levels of out-of-pocket payments for individuals in the U.S. civilian noninstitutionalized population with expenses for health care. Estimates are shown according to age and insurance coverage, since levels of out-of-pocket expenses differ substantially according to these characteristics. All differences between estimates discussed in the text are statistically significant at the .05 level or better.
Findings
Average/median out-of-pocket expenses
In 2003, an average of $707 was paid out of pocket for health care among persons with some health care expenses (figure 1a). This average ranged from $261 among children (those under age 18) to $1,547 among the elderly (those age 65 and over). Overall, half of persons with some health care expenses had out-of-pocket payments of less than or equal to $254 (median), and half paid more than $254. The average was substantially larger than the median out-of-pocket expense because a small proportion of persons had extremely large out-of-pocket expenses. Median out-of-pocket expenses were substantially lower than averages across all age groups.
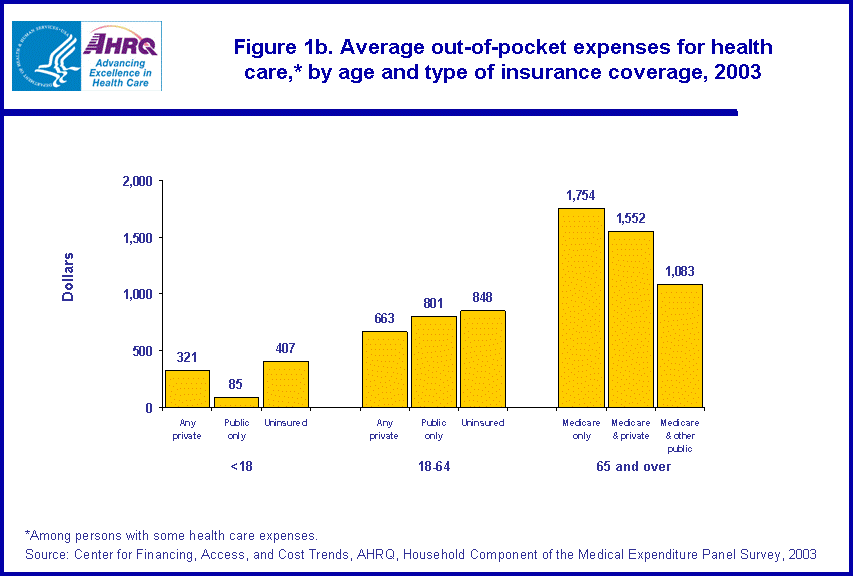
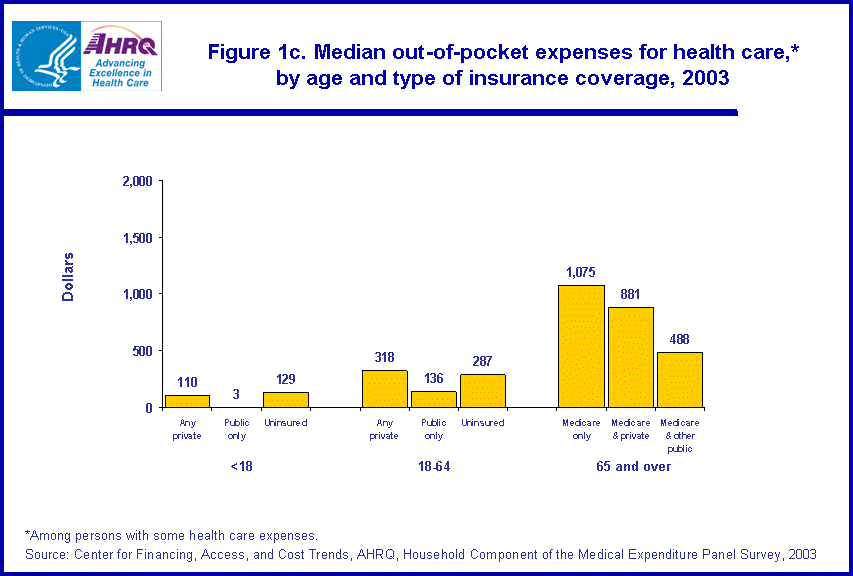
Average annual out-of-pocket expenses varied by type of insurance coverage across all age groups (figure 1b). For example, these expenses were notably smaller ($85) among children under 18 with public insurance (i.e., primarily Medicaid) than for children who had private coverage ($321) or were uninsured ($407). Similarly, among persons age 65 and over, average out-of-pocket expenses for those with Medicare and supplemental public coverage ($1,083) were substantially lower than for other elderly Medicare beneficiaries ($1,552-1,754). Among adults age 18-64, average out-of-pocket expenses were lower on average for those with private insurance ($663) than for their uninsured counterparts ($848). In contrast, uninsured adults age 18-64 and those with private insurance had higher median out-of-pocket expenses than their counterparts with public insurance only (figure 1c). Median and average annual out-of-pocket expenses had similar patterns by insurance coverage for children and the elderly.
Distribution of out-of-pocket expenses
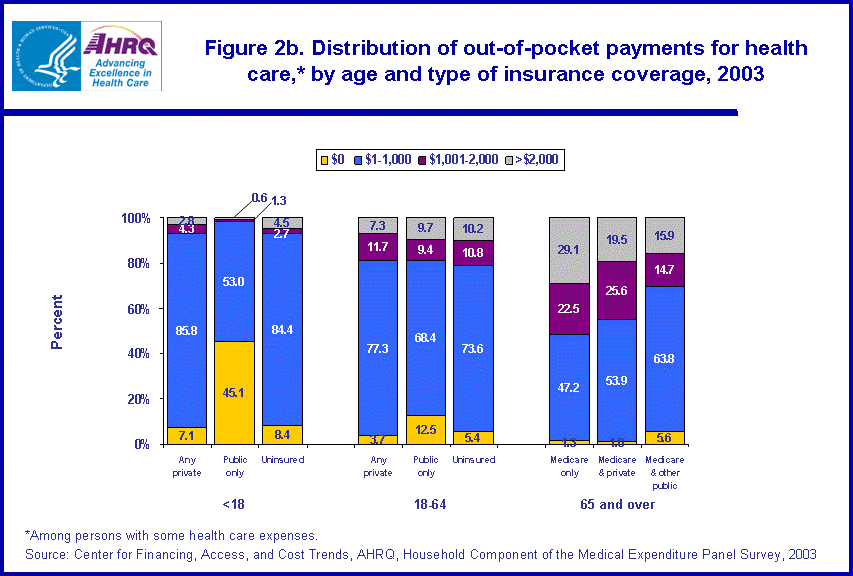
About one out of every 13 persons (7.6 percent) paid nothing out of pocket for their health care expenses in 2003 (figure 2a). However, this proportion decreased substantially with age, ranging from a high of 17.6 percent for children under 18 to a low of 1.8 percent for persons age 65 and over. Conversely, the percentage of persons with high levels of out-of-pocket expenses increased with age. Overall, 19.4 percent of persons had out-of-pocket expenses greater than $1,000, and 8.4 percent had expenses greater than $2,000, but the percentage with greater than $1,000 in out-of-pocket expenses ranged from 5.7 percent for children under age 18 to 44.8 percent for the elderly age 65 and over. Further, more than one in five (21.6 percent) persons age 65 and over had expenses greater than $2,000 versus only 7.9 percent for younger adults and 2.3 percent for children under 18.
Nearly half (45.1 percent) of children with public insurance coverage only had no out-of-pocket payments made for their health care versus only 7.1 percent of privately insured and 8.4 percent of uninsured children (figure 2b). While differences were less dramatic than for children, adults age 18-64 with public coverage only and persons age 65 and over with supplemental public coverage to Medicare were also more likely than their counterparts to have no out-of-pocket expenses.
The elderly with Medicare and other public coverage and children with public coverage only were less likely to have high levels of out-of-pocket expenses than their counterparts (figure 2b). About half of persons age 65 and over with only Medicare coverage and nearly half of those with Medicare and supplemental private coverage had out-of-pocket expenses over $1,000 versus only about one-third (30.6 percent) of those with Medicare and supplemental public insurance coverage. Among children under age 18, only 1.9 percent of those with public insurance coverage had more than $1,000 in out-of-pocket expenses versus about 7 percent of privately insured and uninsured children. Approximately one-fifth of adults age 18-64 had expenses greater than $1,000, regardless of type of insurance coverage.
Out-of-pocket expenses as percentage of total expenses
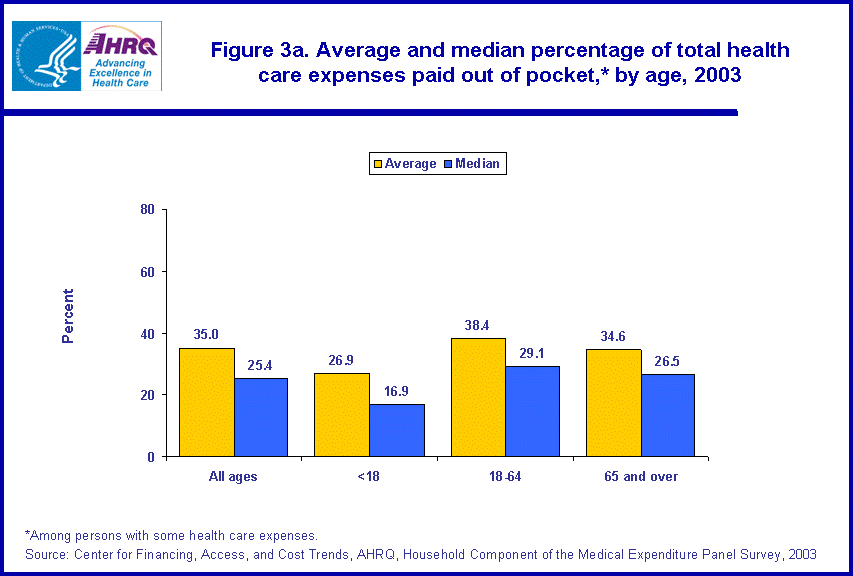
Among persons with health care expenses in 2003, an average of 35.0 percent was paid out of pocket, while the median was about 10 percentage points lower (figure 3a). Both average and median percentages paid out of pocket were lowest for children and highest for adults age 18-64.
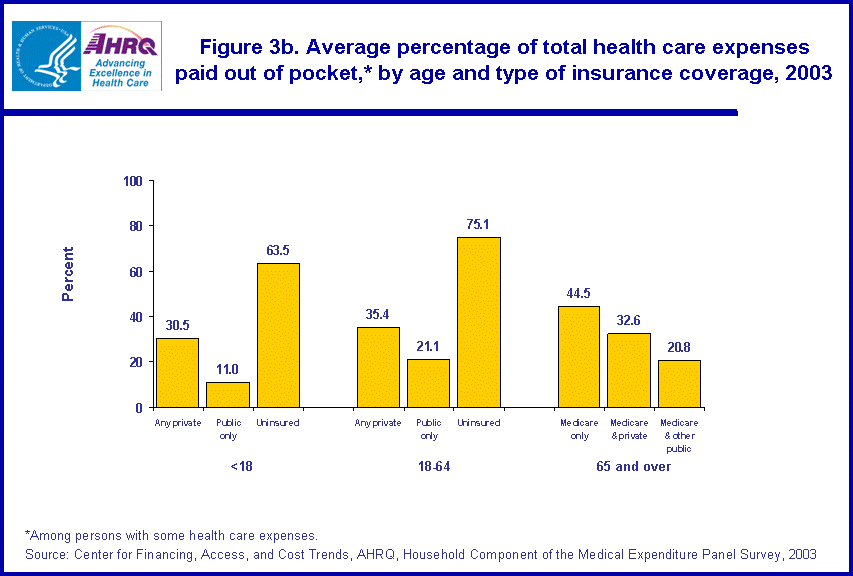
Among persons under age 65, the uninsured had by far the highest proportion of their health expenses paid out of pocket (figure 3b). On average, nearly two-thirds of health care expenses for uninsured children and about three-fourths of expenses for uninsured adults age 18-64 were paid out of pocket.* In contrast, persons under age 65 with public insurance only had the smallest shares paid out of pocket (average of 11.0 percent for children and 21.1 percent for adults age 18-64). Among persons age 65 and over, those with only Medicare coverage paid an average of nearly half (44.5 percent) of their expenses out of pocket. Medicare beneficiaries with supplemental private or public coverage paid a significantly smaller portion of their expenses out of pocket--about one-third (32.6 percent) for those with supplemental private coverage and one-fifth (20.8 percent) for those with supplemental public coverage.
Definitions
Out-of-pocket expenses
MEPS total expenses include payments from all sources (including third-party payers and other miscellaneous sources) to hospitals, physicians, other health care providers (including dental care), and pharmacies for services reported by respondents in the MEPS-HC. Out-of-pocket expenses comprise the portion of total payments made by individuals and families for services received during the year.
Health insurance status
Individuals under age 65 were classified in the following three insurance categories, based on household responses to health insurance status questions:
- Any private health insurance: Individuals who, at any time during the year, had insurance that provides coverage for hospital and physician care (other than Medicare, Medicaid, or other public hospital/physician coverage) were classified as having private insurance. Coverage by TRICARE (Armed Forces-related coverage) was also included as private health insurance. Insurance that provides coverage for a single service only, such as dental or vision coverage, was not included.
- Public coverage only: Individuals were considered to have public coverage only if they met both of the following criteria: 1) they were not covered by private insurance at any time during the year, 2) they were covered by any of the following public programs at any point during the year: Medicare, Medicaid, or other public hospital/physician coverage.
- Uninsured: The uninsured were defined as people not covered by private hospital/physician insurance, Medicare, TRICARE, Medicaid, or other public hospital/physician programs at any time during the entire year or period of eligibility for the survey.
- Medicare and private insurance: This category includes persons classified as Medicare beneficiaries and covered by Medicare and a supplementary private policy.
- Medicare and other public insurance: This category includes persons classified as Medicare beneficiaries who met both of the following criteria: 1) They were not covered by private insurance at any point during the year, 2) They were covered by one of the following public programs at any point during the year: Medicaid, other public hospital/physician coverage.
- Medicare only: This category includes persons classified as Medicare beneficiaries but not classified as Medicare and private insurance or as Medicare and other public insurance. This group includes persons who were enrolled in Medicare HMOs and persons who had Medicare fee-for-service coverage only.
About MEPS-HC
MEPS-HC is a nationally representative longitudinal survey that collects detailed information on health care utilization and expenditures, health insurance, and health status, as well as a wide variety of social, demographic, and economic characteristics for the civilian noninstitutionalized population. It is cosponsored by the Agency for Healthcare Research and Quality and the National Center for Health Statistics.
For more information about MEPS, call the MEPS information coordinator at AHRQ (301-427-1656) or visit the MEPS Web site at http://www.meps.ahrq.gov/.
References
For a detailed description of the MEPS-HC survey design, sample design, and methods used to minimize sources of nonsampling error, see the following publications:
Cohen, J. Design and Methods of the Medical Expenditure Panel Survey Household Component. MEPS Methodology Report No. 1. AHCPR Pub. No. 97-0026. Rockville, Md.: Agency for Health Care Policy and Research, 1997.
Cohen, S. Sample Design of the 1996 Medical Expenditure Panel Survey Household Component. MEPS Methodology Report No. 2. AHCPR Pub. No. 97-0027. Rockville, Md.: Agency for Health Care Policy and Research, 1997.
Cohen, S. Design Strategies and Innovations in the Medical Expenditure Panel Survey. Medical Care, July 2003: 41(7) Supplement: III-5-III-12.
Suggested Citation
Machlin, S. R. and Zodet, M. W. Out-of-Pocket Health Care Expenses by Age and Insurance Coverage, United States, 2003. Statistical Brief #126. May 2006. Agency for Healthcare Research and Quality, Rockville, Md. http://www.meps.ahrq.gov/mepsweb/data_files/publications/st126/stat126.shtml
AHRQ welcomes questions and comments from readers of this publication who are interested in obtaining more information about access, cost, use, financing, and quality of health care in the United States. We also invite you to tell us how you are using this Statistical Brief and other MEPS data and tools and to share suggestions on how MEPS products might be enhanced to further meet your needs. Please e-mail us at mepspd@ahrq.gov or send a letter to the address below:
Steven B. Cohen, PhD, Director
Center for Financing, Access, and Cost Trends
Agency for Healthcare Research and Quality
540 Gaither Road
Rockville, MD 20850
Footnotes
*The remaining portion of expenses for uninsured persons were likely paid by various miscellaneous sources that are not classified as health insurance coverage in MEPS, such as the Indian Health Service, Veterans' Administration, community and neighborhood clinics, State and local health departments, Worker's Compensation, as well as automobile, homeowner's, and liability insurance.
 |
||||||||||||||||||||||||||||||||||||||||||||||||||||||||||||||||||||||
|
||||||||||||||||||||||||||||||||||||||||||||||||||||||||||||||||||||||
|
|
||||||||||||||||||||||||||||||||||||||||||||||||||||||||||||||||||||||
 |
||||||||||||||||||||||||||||||||||||||||||||||||||||||||||||||||||||||
|
||||||||||||||||||||||||||||||||||||||||||||||||||||||||||||||||||||||
|
|
||||||||||||||||||||||||||||||||||||||||||||||||||||||||||||||||||||||
 |
||||||||||||||||||||||||||||||||||||||||||||||||||||||||||||||||||||||
|
||||||||||||||||||||||||||||||||||||||||||||||||||||||||||||||||||||||
|
|
||||||||||||||||||||||||||||||||||||||||||||||||||||||||||||||||||||||
 |
||||||||||||||||||||||||||||||||||||||||||||||||||||||||||||||||||||||
|
||||||||||||||||||||||||||||||||||||||||||||||||||||||||||||||||||||||
|
|
||||||||||||||||||||||||||||||||||||||||||||||||||||||||||||||||||||||
 |
||||||||||||||||||||||||||||||||||||||||||||||||||||||||||||||||||||||
|
||||||||||||||||||||||||||||||||||||||||||||||||||||||||||||||||||||||
|
|
||||||||||||||||||||||||||||||||||||||||||||||||||||||||||||||||||||||
 |
||||||||||||||||||||||||||||||||||||||||||||||||||||||||||||||||||||||
|
||||||||||||||||||||||||||||||||||||||||||||||||||||||||||||||||||||||
|
|
||||||||||||||||||||||||||||||||||||||||||||||||||||||||||||||||||||||
 |
||||||||||||||||||||||||||||||||||||||||||||||||||||||||||||||||||||||
|
||||||||||||||||||||||||||||||||||||||||||||||||||||||||||||||||||||||
|
|
||||||||||||||||||||||||||||||||||||||||||||||||||||||||||||||||||||||


