
|
|
Font Size:
|
||||
|
|
|
|
||||
STATISTICAL BRIEF #138:
Population Characteristics of Medicare Beneficiaries in the U.S. Civilian Noninstitutionalized Population, by Level of Annual Prescribed Medicines Expenses, 2003
Highlights
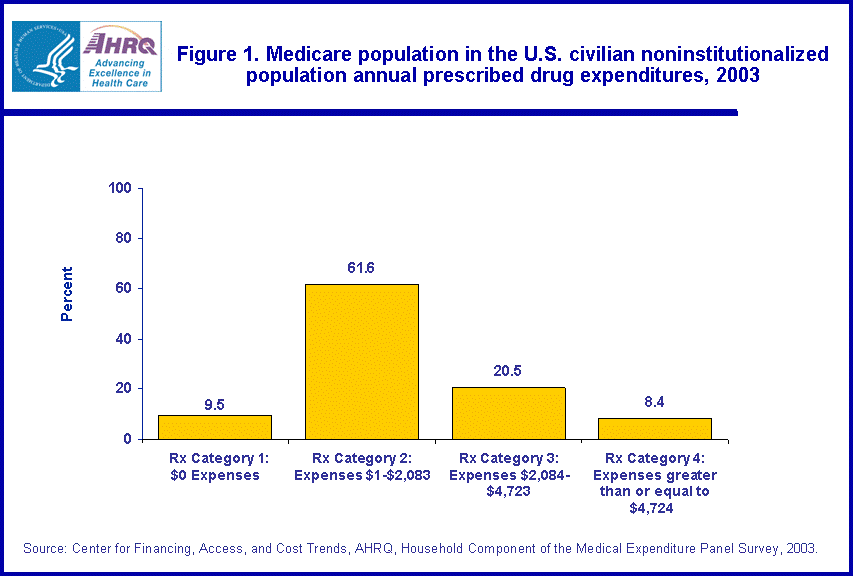
- In 2003, 9.5 percent of the Medicare population had $0 prescribed drug expenses (Rx Category 1), 61.6 percent had expenses of $1-$2,083 (Rx Category 2), 20.5 percent had expenses of $2,084-$4,723 (Rx Category 3), and 8.4 percent had expenses greater than or equal to $4,724.
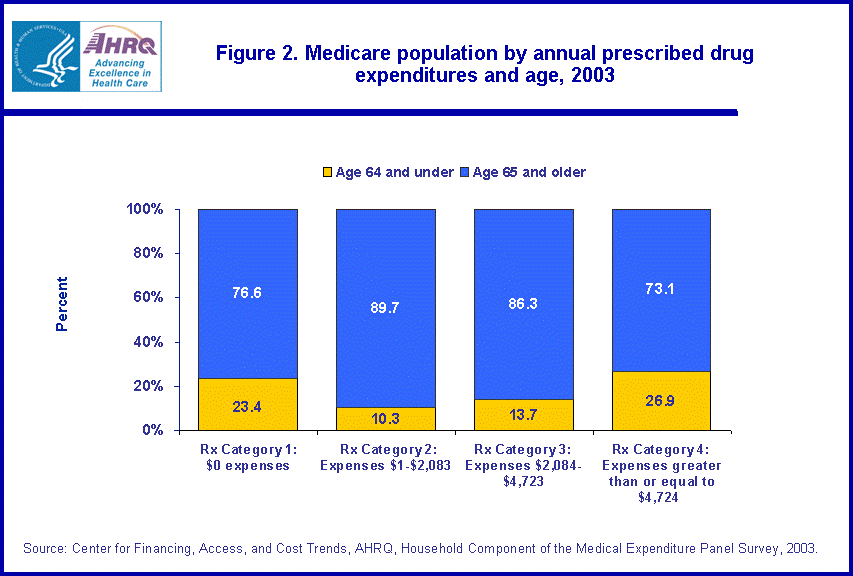
- Medicare beneficiaries under age 65 accounted for a greater proportion of those in Rx Category 4 (26.9 percent) than those in Rx Category 3 (13.7 percent) or Rx Category 2 (10.3 percent).
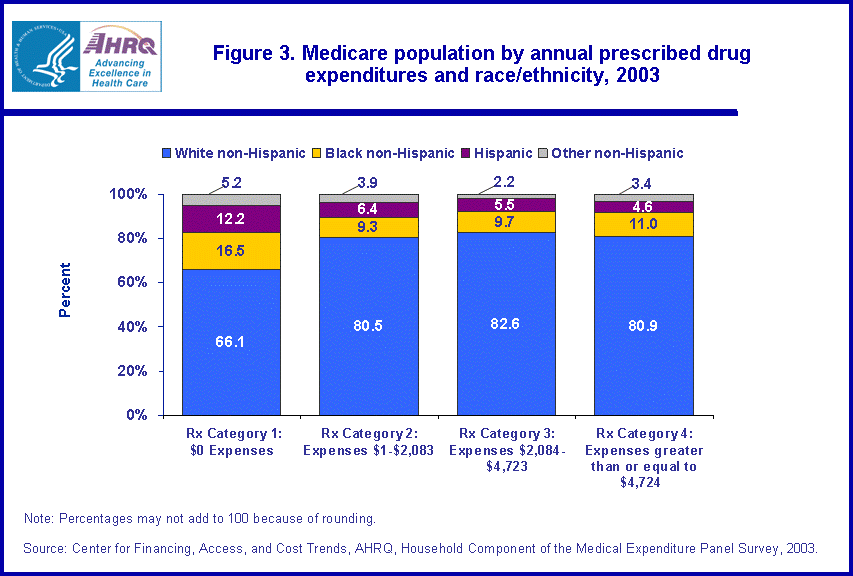
- For Medicare beneficiaries, there were no significant differences in the distribution of white non-Hispanics, black non-Hispanics, and Hispanics in Rx Category 2 (80.5, 9.3, and 6.4 percent, respectively), Rx Category 3 (82.6, 9.7, and 5.5 percent, respectively), or Rx Category 4 in 2003 (80.9, 11.0, and 4.6 percent, respectively).
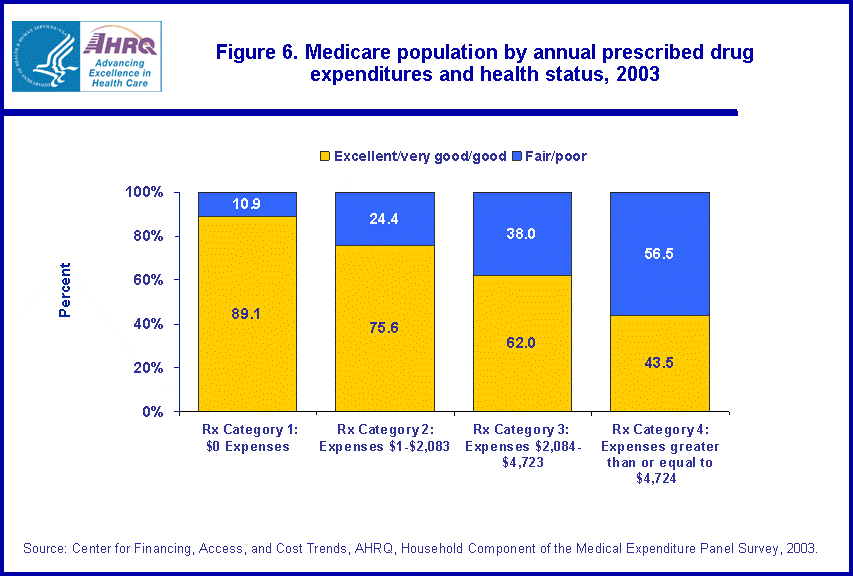
- The proportion of Medicare beneficiaries in excellent, very good, and good health decreased as the categories for total drug expenses increased from Rx Category 2 to Rx Category 3 to Rx Category 4 (75.6 to 62.0 to 43.5 percent, respectively).
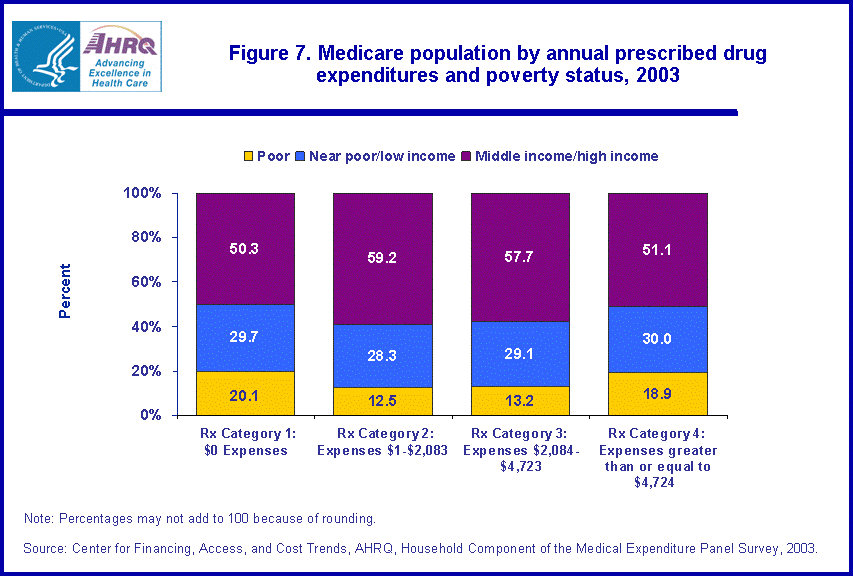
- Poor Medicare beneficiaries accounted for a greater proportion of those in Rx Category 4 (18.9 percent) than those in Rx Category 3 or Rx Category 2 (13.2 and 12.5 percent, respectively).
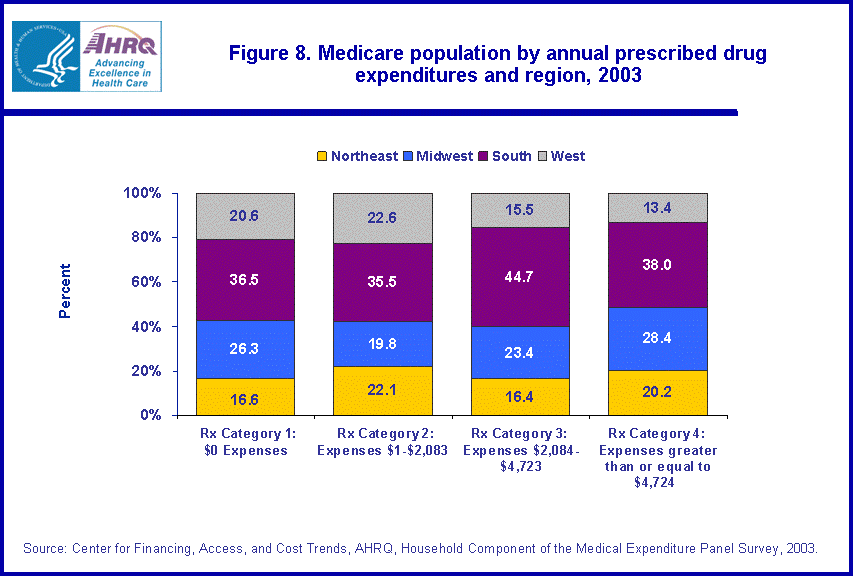
- Medicare beneficiaries in the West made up a higher proportion in Rx Category 2 (22.6 percent) than in Rx Category 3 and Rx Category 4 (15.5 and 13.4 percent, respectively).
Introduction
Using data for the U.S. civilian noninstitutionalized (community) population from the 2003 Household Component of the Medical Expenditure Panel Survey (MEPS-HC), this Statistical Brief compares the population characteristics of Medicare beneficiaries having different levels of annual outpatient prescribed drug expenses.
Starting January 1, 2006, a new Medicare prescription drug coverage (Medicare Part D) was made available to everyone with Medicare. Everyone with Medicare had the option to enroll in this program and obtain coverage that may help lower their prescription drug costs and help protect them against higher costs in the future.*
The estimates in this brief are presented in terms of the expense categories in the standard Medicare Prescription Drug Benefit for this new Medicare Part D, which consists of a multitiered benefit with three drug cost and cost-sharing categories:
- 1st tier: Prescribed medicines expenses less than or equal to $2,250; after a $250 deductible Medicare pays 75 percent and the beneficiary pays 25 percent of drug costs.
- 2nd tier: Prescribed medicines expenses greater than $2,250 but less than or equal to $5,100; beneficiary pays 100 percent of drug costs.
- 3rd tier: Prescribed medicines expenses greater than $5,100; Medicare pays 95 percent and beneficiary pays 5 percent of drug costs.
- Rx Category 1: $0 prescribed medicines expenses
- Rx Category 2: Prescribed medicines expenses of $1-$2,083
- Rx Category 3: Prescribed medicines expenses of $2,084-$4,723
- Rx Category 4: Prescribed medicines expenses greater than or equal to $4,724
Findings
In 2003, there were 41.9 million Medicare beneficiaries in the U.S. civilian noninstitutionalized population. Of that number, 9.5 percent had no prescribed drug expense (Rx Category 1), and 61.6 percent had annual prescribed drug expenses between $1 and $2,083 (Rx Category 2). The percentage of Medicare beneficiaries having drug expenses between $2,084 and $4,723 (Rx Category 3) was 20.5 percent, and the percentage having drug expenses of $4,724 and higher (Rx Category 4) was 8.4 percent. (figure 1)
During 2003, Medicare beneficiaries under age 65 accounted for a greater proportion of those in Rx Category 4 (26.9 percent) when compared with those in Rx Category 3 and Rx Category 2 (13.7 versus 10.3 percent, respectively). In addition, Medicare beneficiaries under age 65 accounted for a greater proportion of those in Rx Category 3 than those in Rx Category 2 (13.7 percent versus 10.3 percent). (figure 2)
There were no significant differences in the distribution of white non-Hispanics, black non-Hispanics, and Hispanics when comparing Rx Category 4 (80.9, 11.0, and 4.6 percent, respectively), Rx Category 3 (82.6, 9.7, and 5.5 percent, respectively) and Rx Category 2 (80.5, 9.3, and 6.4 percent, respectively) for Medicare beneficiaries in 2003. (figure 3)
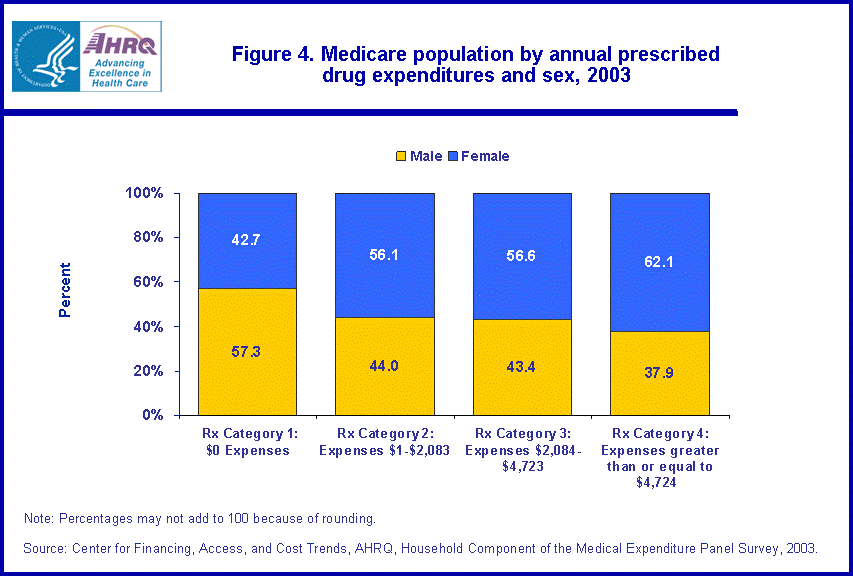
For Medicare beneficiaries in 2003, females accounted for a higher proportion in Rx Category 4 (62.1 percent) than in Rx Category 2 (56.1 percent), while males accounted for a higher proportion in Rx Category 2 (44.0 percent) than in Rx Category 4 (37.9 percent). (figure 4)
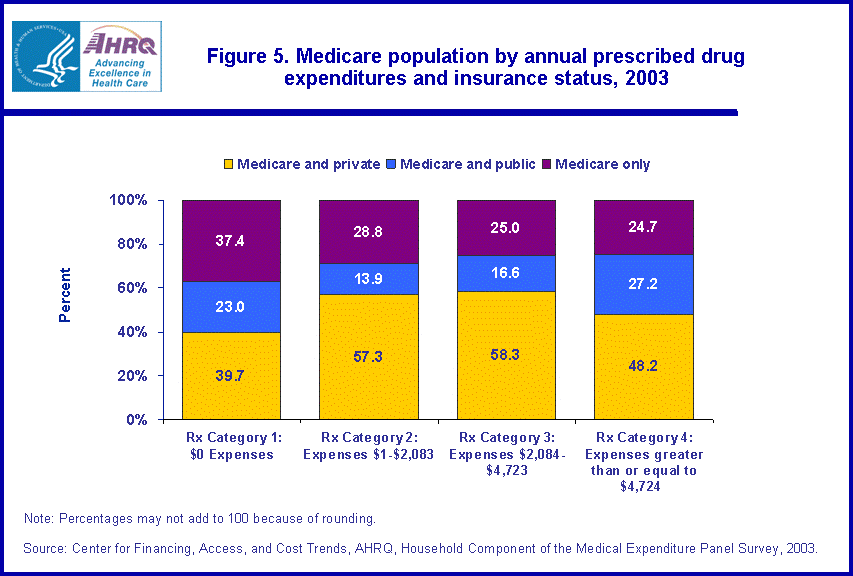
A higher proportion of Medicare beneficiaries in Rx Category 4 were beneficiaries with additional public insurance (27.2 percent) than the proportion in Rx Category 3 (16.6 percent) and the proportion in Rx Category 2 (13.9 percent) in 2003. In addition, there was a lower proportion of beneficiaries in Rx Category 4 with Medicare and private coverage (48.2 percent) than in Rx Category 3 (58.3 percent) and Rx Category 2 (57.3 percent). There was no significant difference in the proportion of Medicare beneficiaries in any of the Rx categories when looking at those with Medicare only. (figure 5)
In 2003, for Medicare beneficiaries, the proportion of those in excellent, very good, and good health decreased (75.6 percent to 62.0 percent to 43.5 percent) as the categories for total drug expenses increased from Rx Category 2 to Category 3 to Rx Category 4; and, conversely, the proportion of those in fair and poor health increased (24.4 percent to 38.0 percent to 56.5 percent) as the categories for total drug expenses rose from Rx Category 2 to Rx Category 3 to Rx Category 4. (figure 6)
During 2003, a higher proportion of Medicare beneficiaries in Rx Category 2 (59.2 percent) than in Rx Category 4 (51.1 percent) were in the middle/high income group. Poor Medicare beneficiaries accounted for a greater proportion of those in Rx Category 4 (18.9 percent) than those in Rx Category 3 or Rx Category 2 (13.2 and 12.5 percent, respectively). (figure 7)
For Medicare beneficiaries in 2003, the West made up a higher proportion in Rx Category 2 (22.6 percent) than in Rx Category 3 (15.5 percent) and Rx Category 4 (13.4 percent). The South represented a larger proportion of Rx Category 3 (44.7 percent) than Rx Category 2 (35.5 percent). Medicare beneficiaries in the Midwest accounted for a greater proportion of those in Rx Category 4 (28.4 percent) than those in Rx Category 2 (19.8 percent), and Medicare beneficiaries in the Northeast accounted for a greater proportion of those in Rx Category 2 (22.1 percent) than those in Rx Category 3 (16.4 percent). (figure 8)
Definitions
Medicare population
People are considered Medicare beneficiaries if they ever report being covered by Medicare while in the survey.
Prescribed drug expenses
The estimates in this brief are presented in terms of the expense categories in the standard Medicare Prescription Drug Benefit for this new Medicare Part D, which consists of a multitiered benefit with three drug cost and cost-sharing categories:
- 1st tier: Prescribed medicines expenses less than or equal to $2,250; after a $250 deductible Medicare pays 75 percent and the beneficiary pays 25 percent of drug costs.
- 2nd tier: Prescribed medicines expenses greater than $2,250 but less than or equal to $5,100; beneficiary pays 100 percent of drug costs.
- 3rd tier: Prescribed medicines expenses greater than $5,100; Medicare pays 95 percent and beneficiary pays 5 percent of drug costs.
- Rx Category 1: $0 prescribed medicines expenses
- Rx Category 2: Prescribed medicines expenses from $1-$2,083
- Rx Category 3: Prescribed medicines expenses from $2,084-$4,723
- Rx Category 4: Prescribed medicines expenses greater than or equal to $4,724
Age is the last available age for the sampled person. For most persons, this was their age at the end of the year.
Racial and ethnic classifications
Classification by race and ethnicity was based on information reported for each family member. Respondents were asked if each family member's race was best described as American Indian, Alaska Native, Asian or Pacific Islander, black, white, or other. They also were asked if each family member's main national origin or ancestry was Puerto Rican; Cuban; Mexican, Mexicano, Mexican American, or Chicano; other Latin American; or other Spanish. All persons whose main national origin or ancestry was reported in one of these Hispanic groups, regardless of racial background, were classified as Hispanic. Since the Hispanic grouping can include black Hispanic, white Hispanic, Asian and Pacific Islanders Hispanic, and other Hispanic, the race categories of black, white, Asian and Pacific Islanders, and other do not include Hispanic. Beginning in 2002, MEPS respondents were allowed to report multiple races, and these persons were included in the other non-Hispanic category. As a result, there was a slight increase in the percentage of persons classified in this category in 2002 compared with prior years.
Health insurance status
Respondents were asked about health insurance coverage for themselves and all household members at each round of interviewing. The insurance variables reflect supplemental coverage, in addition to Medicare, that beneficiaries had for hospital and physician services. Persons categorized as having supplemental insurance coverage may or may not have coverage for prescription drugs. The insurance categories are mutually exclusive and hierarchical. Persons with more than one type of supplemental coverage were placed into an insurance category in the following order.
- Medicare and private insurance: This category includes persons classified as Medicare beneficiaries and covered by Medicare and a supplementary private policy.
- Medicare and other public insurance: This category includes persons classified as Medicare beneficiaries who met both of the following criteria: 1) they were not covered by private insurance at any point during the year, and 2) they were covered by one of the following public programs at any point during the year: Medicaid, other public hospital/physician coverage.
- Medicare only: This category includes persons classified as Medicare beneficiaries but not classified as Medicare and private insurance or as Medicare and other public insurance. This group includes persons who were enrolled in Medicare HMOs and persons who had Medicare fee-for-service coverage only.
During each round of interviewing, the household respondent was asked to rate the health of each person in the family according to the following categories: excellent, very good, good, fair, or poor. For this report, the response categories "excellent," "very good," and "good' were collapsed, as were "fair" and "poor." Health status was missing for approximately 1 percent of beneficiaries.
Poverty status
Each year, persons were classified according to their family's income in terms of poverty status. In this report, poverty status is the ratio of the family's income to the Federal poverty thresholds, which control for the size of the family and the age of the head of the family. The following classification of poverty status was used:
- Poor: Persons in families with income less than 100 percent of the poverty line, including those who reported negative income.
- Near poor/low income: Persons in families with income of 100 percent of the poverty line through 200 percent of the poverty line.
- Middle income/high income: Persons in families with income over 200 percent of the poverty line.
Each MEPS sample person was classified as living in one of the following four regions as defined by the U.S. Census Bureau:
- Northeast: Maine, New Hampshire, Vermont, Massachusetts, Rhode Island, Connecticut, New York, New Jersey, and Pennsylvania.
- Midwest: Ohio, Indiana, Illinois, Michigan, Wisconsin, Minnesota, Iowa, Missouri, North Dakota, South Dakota, Nebraska, and Kansas.
- South: Delaware, Maryland, District of Columbia, Virginia, West Virginia, North Carolina, South Carolina, Georgia, Florida, Kentucky, Tennessee, Alabama, Mississippi, Arkansas, Louisiana, Oklahoma, and Texas.
- West: Montana, Idaho, Wyoming, Colorado, New Mexico, Arizona, Utah, Nevada, Washington, Oregon, California, Alaska, and Hawaii.
About MEPS-HC
MEPS-HC is a nationally representative longitudinal survey that collects detailed information on health care utilization and expenditures, health insurance, and health status, as well as a wide variety of social, demographic, and economic characteristics for the civilian noninstitutionalized population. It is cosponsored by the Agency for Healthcare Research and Quality and the National Center for Health Statistics.
For more information about MEPS, call the MEPS information coordinator at AHRQ (301-427-1406) or visit the MEPS Web site at http://www.meps.ahrq.gov/.
References
Cohen, J. Design and Methods of the Medical Expenditure Panel Survey Household Component. MEPS Methodology Report No. 1. AHCPR Pub. No. 97-0026. Rockville, Md.: Agency for Healthcare Policy and Research, 1997.
Cohen, S. Sample Design of the 1996 Medical Expenditure Panel Survey Household Component. MEPS Methodology Report No. 2. AHCPR Pub. No. 97-0027. Rockville, Md.: Agency for Health Care Policy and Research, 1997.
Cohen, S. Design Strategies and Innovations in the Medical Expenditure Panel Survey. Medical Care, July 2003: 41(7) Supplement: III-5-III-12.
Suggested Citation
Stagnitti, M. N. Population Characteristics of Medicare Beneficiaries in the U.S. Civilian Noninstitutionalized Population, by Level of Annual Prescribed Medicines Expenses, 2003. Statistical Brief #138. September 2006. Agency for Healthcare Research and Quality, Rockville, MD. http://www.meps.ahrq.gov/mepsweb/data_files/publications/st138/stat138.shtml
AHRQ welcomes questions and comments from readers of this publication who are interested in obtaining more information about access, cost, use, financing, and quality of health care in the United States. We also invite you to tell us how you are using this Statistical Brief and other MEPS data and tools and to share suggestions on how MEPS products might be enhanced to further meet your needs. Please e-mail us at mepspd@ahrq.gov or send a letter to the address below:
Steven B. Cohen, PhD, Director
Center for Financing, Access, and Cost Trends
Agency for Healthcare Research and Quality
540 Gaither Road
Rockville, MD 20850
Footnotes
* CMS: Center for Medicare and Medicaid Services Web site. Medicare Program: General information on Prescription Drug Coverage. http://www.cms.hhs.gov/MedicareGenInfo/
 |
|||||||||||||||||||||||||||||||||||
|
|||||||||||||||||||||||||||||||||||
|
|
|||||||||||||||||||||||||||||||||||
 |
|||||||||||||||||||||||||||||||||||
|
|||||||||||||||||||||||||||||||||||
|
|
|||||||||||||||||||||||||||||||||||
 |
|||||||||||||||||||||||||||||||||||
|
|||||||||||||||||||||||||||||||||||
|
|
|||||||||||||||||||||||||||||||||||
 |
|||||||||||||||||||||||||||||||||||
|
|||||||||||||||||||||||||||||||||||
|
|
|||||||||||||||||||||||||||||||||||
 |
|||||||||||||||||||||||||||||||||||
|
|||||||||||||||||||||||||||||||||||
|
|
|||||||||||||||||||||||||||||||||||
 |
|||||||||||||||||||||||||||||||||||
|
|||||||||||||||||||||||||||||||||||
|
|
|||||||||||||||||||||||||||||||||||
 |
|||||||||||||||||||||||||||||||||||
|
|||||||||||||||||||||||||||||||||||
|
|
|||||||||||||||||||||||||||||||||||
 |
|||||||||||||||||||||||||||||||||||
|
|||||||||||||||||||||||||||||||||||
|
|
|||||||||||||||||||||||||||||||||||


