|
|
Font Size:
|
||||
|
|
|
|
||||
STATISTICAL BRIEF #14:
Trends in Access to Routine Care and Experiences with Care: 2001
Introduction
The quality of the health care received by Americans is an issue of public policy concern for several reasons. First, the level of quality of the health care delivery system affects the capacity to provide timely, accessible, effective and efficient medical care to the population in need of services. Secondly, estimates of quality of heath care are vital to evaluate the costs and outcomes of health care delivery and to help identify potential areas where improvements are necessary. Finally, all components of the population may not be receiving care equally. Following these population subgroups over time can provide information about whether greater equity has been achieved or whether serious gaps remain. A self-administered questionnaire was added to the Medical Expenditure Panel Survey (MEPS) starting in 2000 to collect information on health care utilization, access, health status and the quality of health care received. The quality of care measures were taken from an AHRQ-sponsored instrument, the Consumer Assessments of Health Plans (CAHPS®). All of the questions refer to events experienced in the last 12 months. This Statistical Brief presents preliminary findings based on the data obtained from the self-administered questionnaire that was administered in late 2001 and early 2002. Comparisons are made to the 2000 MEPS administered in late 2000 and early 2001 and summarized in Statistical Brief #2.
Access To Care
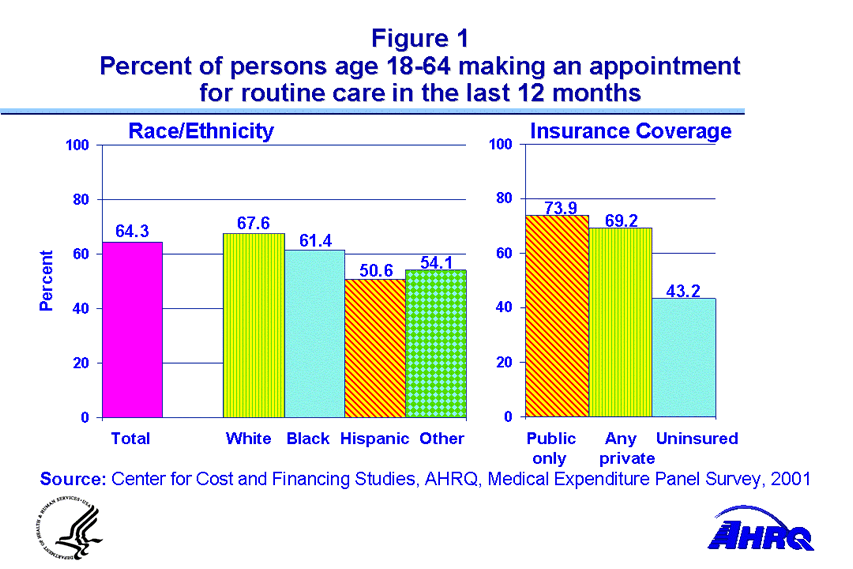
Getting routine care when needed: In 2001, 68.1% of the survey population aged 18 and over (139 million) reported making any appointment with a doctor or other health provider for care in the last 12 months. Among those age 18-64, whites were more likely than blacks and both groups were more likely than Hispanics to have made an appointment (67.6% whites, 61.4% blacks, 50.6% Hispanics, and 54.1% other). Persons age 18-64 with only public only insurance were more likely than those with any private insurance and both of these groups were more likely than the uninsured to have made an appointment (73.9% public only, 69.2% any private, and 43.2% uninsured). (Figure 1)
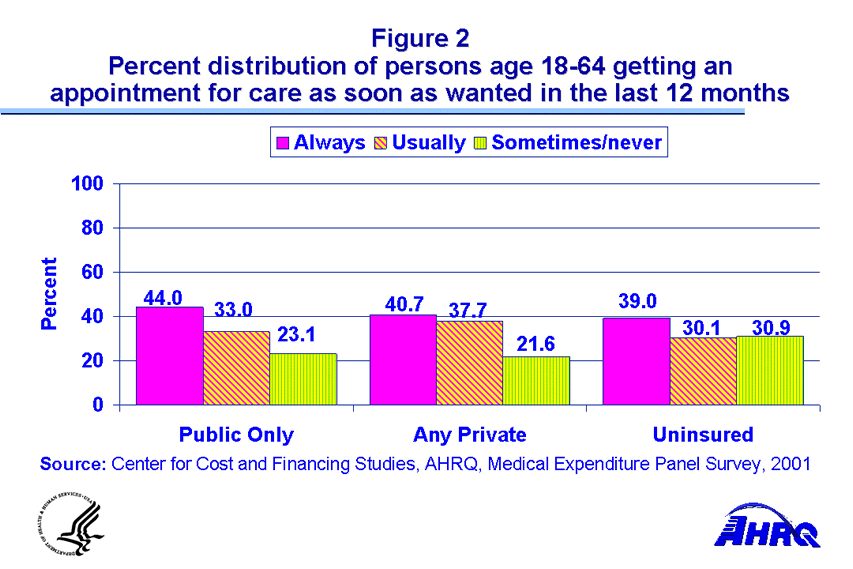
Of those age 18 and older making an appointment, fewer than half reported always obtaining one as soon as wanted (43.9% always, 35.9% usually, 20.2% sometimes/never). Among those age 18-64, nearly one-third of the uninsured said they sometimes or never got an appointment as soon as wanted, a significantly higher percentage than that experienced by those with public only or any private insurance (30.9% uninsured, 23.1% public only, and 21.6% any private). (Figure 2)
Although only 2 out of every 5 Hispanics age 18-64 needing care reported always getting an appointment as soon as wanted, they were more likely to say so in 2001 compared to 2000 (39.6% in 2001 vs. 33.4% in 2000, data not shown).
Experiences During Care
Respondents age 18 and older were asked to report on their experiences during visits to a doctor's office or clinic. They were asked how often their providers listened carefully to them, explained things in a way they could understand, and showed respect for what they had to say. They were also asked if their health providers spent enough time with them.
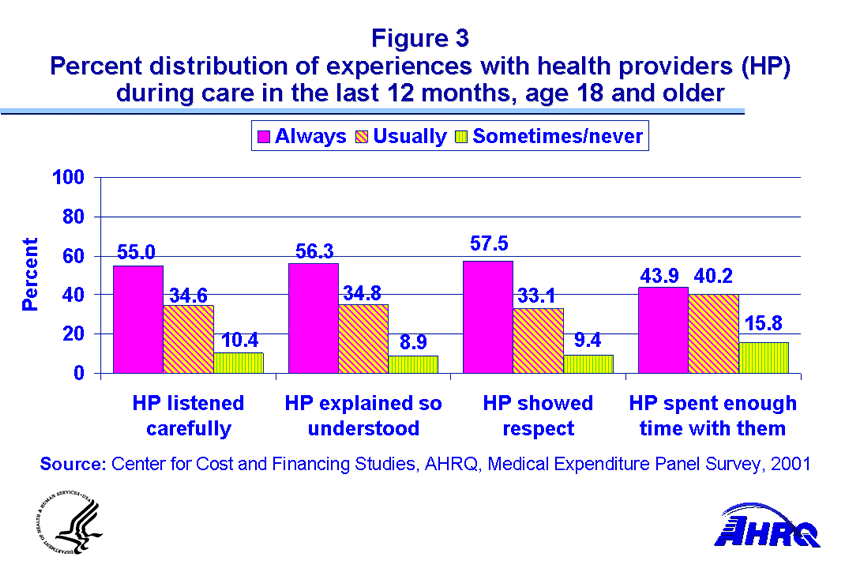
Health providers listening carefully to patients: Overall, more than half of those with a visit said their health providers always listened carefully to them (55.0% always, 34.6% usually, 10.4% sometimes/never). (Figure 3) The percent of Hispanics age 18-64 who said their health professionals always listened carefully to them increased to 56.8% in 2001 from 48.9% in 2000 (data not shown).
Explaining care to patients: Slightly more than half of those with a visit indicated their health providers always explained things in a way they could understand (56.3% always, 34.8% usually, 8.9% sometimes/never). (Figure 3) Among those age 18-64, whites were less likely in 2001 than in 2000 to say their providers always explained things so they understood (54.9% in 2001 vs. 58.2% in 2000, data not shown).
Showing respect to patients: More than half of those with a visit reported their health providers always showed respect for what they had to say (57.5% always, 33.1% usually, and 9.4% sometimes/never). (Figure 3) Hispanics age 18-64 were more likely in 2001 than in 2000 to say their providers always showed respect (61.1% in 2001 vs. 54.3% in 2000, data not shown).
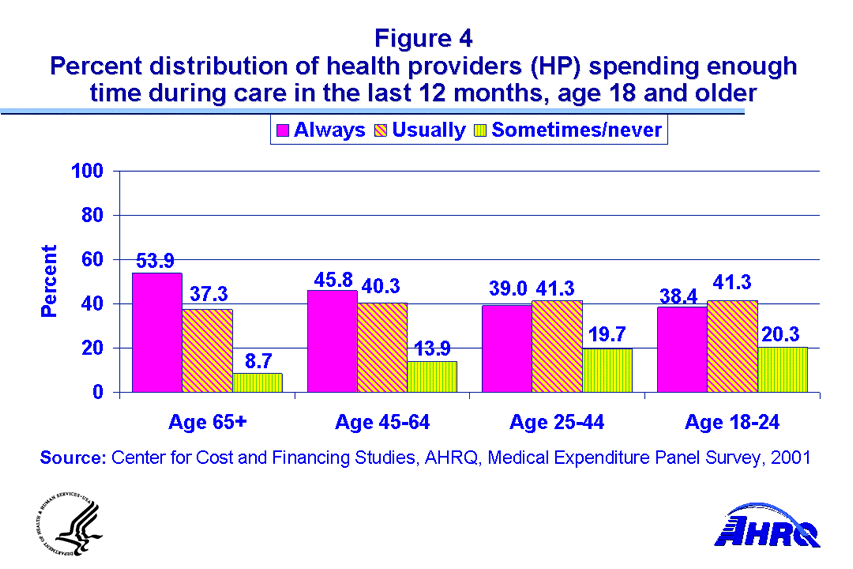
Spending enough time with patients: Among those with a visit, fewer than half said their health providers always spent enough time with them (43.9% always, 40.2% usually, 15.8% sometimes/never). (Figure 3) Younger adults age 18-44 were less likely than older people to say their providers always spent enough time with them (53.9% age 65 and older; 45.8% age 45-64; 39.0% age 25-44, and 38.4% age 18-24). (Figure 4)
About MEPS and CAHPS®
This Statistical Brief summarizes access and quality of care measures pertaining to the health care received by the civilian noninstitutionalized population of the United States. The Medical Expenditure Panel Survey (MEPS) collects nationally representative data on health care use, expenditures, sources of payment, insurance coverage and the quality of care for the U.S. civilian noninstitutionalized population. MEPS is sponsored by the Agency for Healthcare Research and Quality (AHRQ). The health care quality measures used for this study were taken from the Consumer Assessments of Health Plans (CAHPS®), an AHRQ sponsored instrument to measure quality of care by consumers. A conditional response rate of 88% was achieved for the 2001 MEPS self-administered questionnaire (SAQ), yielding an overall response rate of 63% for the survey (21,435 respondents to the SAQ). Specific item nonresponse rates generally varied from 1 to 4 percent for the SAQ questions. The results presented in this Statistical Brief are statistically significant at the .05 level. More information about MEPS can be obtained through the MEPS website at http://www.meps.ahrq.gov. More information about CAHPS® can be obtained through the CAHPS® website (http://www.cahps.ahrq.gov) or on the AHRQ website.
 |
||||||||||||||||||||||||||||||||||||||||
|
||||||||||||||||||||||||||||||||||||||||
|
|
||||||||||||||||||||||||||||||||||||||||
 |
||||||||||||||||||||||||||||||||||||||||
|
||||||||||||||||||||||||||||||||||||||||
|
|
||||||||||||||||||||||||||||||||||||||||
 |
||||||||||||||||||||||||||||||||||||||||
|
||||||||||||||||||||||||||||||||||||||||
|
|
||||||||||||||||||||||||||||||||||||||||
 |
||||||||||||||||||||||||||||||||||||||||
|
||||||||||||||||||||||||||||||||||||||||
|
|
||||||||||||||||||||||||||||||||||||||||


