
|
|
Font Size:
|
||||
|
|
|
|
||||
STATISTICAL BRIEF #166:
Expenses for Office-Based Physician Visits by Specialty, 2004
Highlights
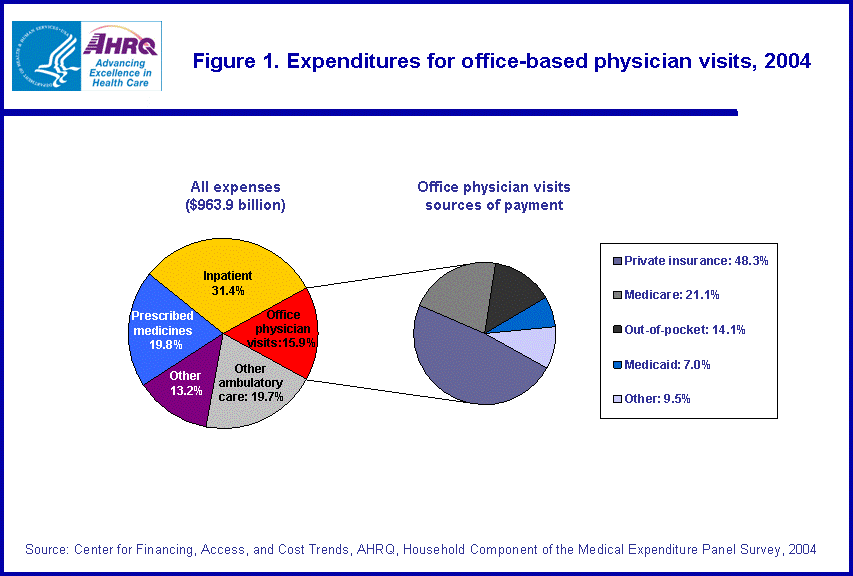
- In 2004, office visits to physicians accounted for about 16 percent of total health care expenses for the civilian noninstitutionalized population. Private insurance paid for nearly half of all expenses for these visits.
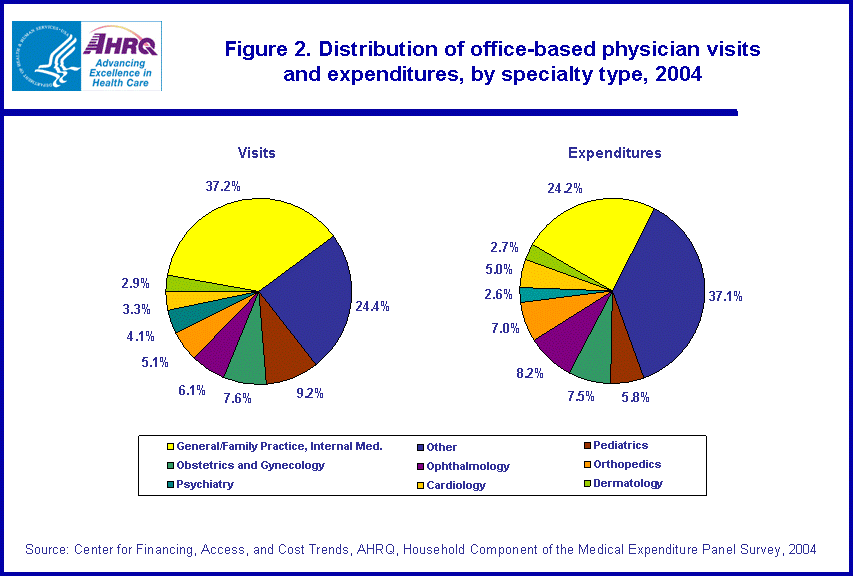
- While almost half of visits for office-based physician care were to doctors in general practice, family practice, internal medicine, or pediatrics, less than one-third of aggregate expenditures were for visits to these types of physicians.
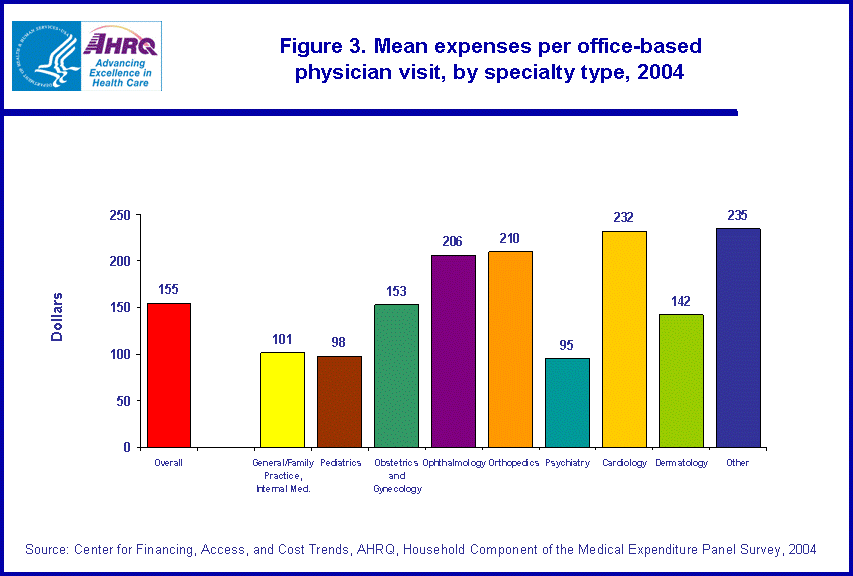
- Overall, the average expenditure for an office-based physician visit was $155 while the median per visit expenditure was $72. Among the specialty types examined, average expenses per visit were lowest for primary care providers, pediatricians, and psychiatrists, and were highest (at least twice as large) for ophthalmologists, orthopedists, and cardiologists.
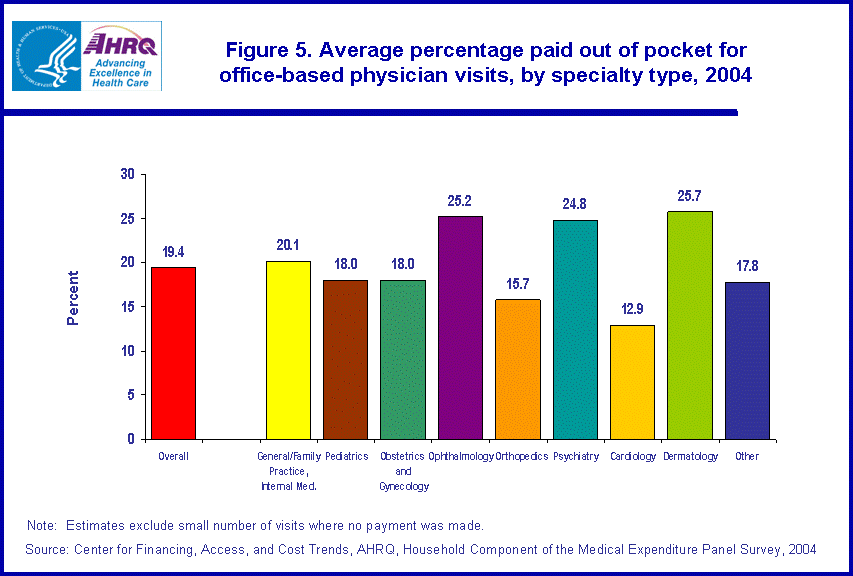
- In 2004, the average share of expenses paid out of pocket for a physician visit was lowest for visits to cardiologists and orthopedists and highest for visits to ophthalmologists, psychiatrists, and dermatologists.
Introduction
In recent years, an important health policy issue with implications for both cost and quality of care has been the use of primary care physicians versus specialists. This Statistical Brief presents data from the Household Component of the Medical Expenditure Panel Survey (MEPS-HC) on expenses by provider specialty type for office-based physician visits in 2004 among persons in the U.S. civilian noninstitutionalized population. Data are shown for the eight most common types of office-based physician specialties, including 1) primary care (defined in this brief as general practice, family practice, and internal medicine); 2) pediatrics; 3) obstetrics/gynecology; 4) ophthalmology; 5) orthopedics; 6) psychiatry; 7) cardiology; and 8) dermatology; as well as a ninth catchall category that includes all other physician specialty types. Descriptive data on aggregate expenses, expenses per visit, and out-of-pocket payments for these physician specialty categories are presented. All differences between estimates noted in the text are statistically significant at the 0.05 level or better.
Findings
Sources of payment
In 2004, office visits to physicians accounted for about 16 percent of total health care expenses for the civilian noninstitutionalized population (figure 1). Private insurance paid for nearly half (48.3 percent) and Medicare paid for just over one-fifth (21.1 percent) of all expenditures for these visits. Out-of-pocket payments by individuals and families was the third largest source of payment category, comprising 14.1 percent of total expenditures for office-based physician care.
Distribution of visits and expenses
While more than one-third of visits for office-based physician care (37.2 percent) were to primary care doctors in general practice, family practice, or internal medicine, only about one-quarter of expenditures were for visits to these types of physicians (figure 2). Expenditures for visits to pediatricians also comprised a disproportionately low share of total expenditures for office-based physician care (9.2 percent of visits versus 5.8 percent of expenses). These discrepancies reflect the fact that visits to these types of physicians are generally less expensive than visits to many other types of physicians (e.g., ophthalmologists, orthopedists, cardiologists, and specialists included in the "other" category, such as neurologists, urologists, and general surgeons).
Average expenses per visit
In 2004, the average expense for an office-based visit to a physician was $155 (figure 3). However, the average expense per visit varied substantially according to physician specialty. For example, the averages for primary care providers (general practitioners, family practitioners, internists), pediatricians, and psychiatrists were about $100, which was about half or less of the average expense for a visit to a cardiologist ($232), orthopedist ($210), or ophthalmologist ($206).
Median expenses per visit
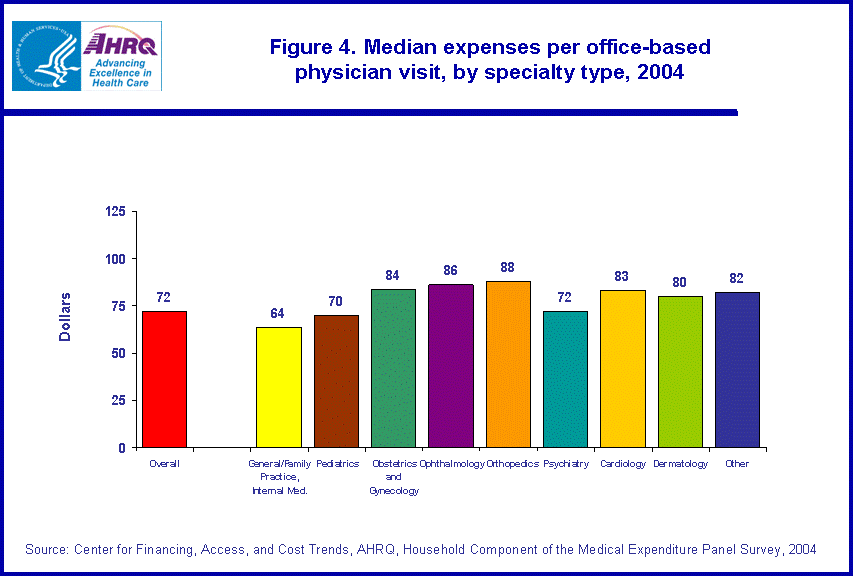
In 2004, the median expense for an office-based visit to a physician was $72 (figure 4), which was less than half the overall average expense per physician visit of $155 (figure 3). The median expense per visit was substantially lower than the average because the most expensive visits have a disproportionate impact on the average.
Among the specialty types examined, median expenses per visit ranged from $64 for the category of general practitioners, family practitioners, and internists to $88 for orthopedists (figure 4). Although the median expense was markedly lower than the average expense (figure 3) for each physician specialty group examined, there was less variation across physician specialty groups in median than in average expenses.
Out-of-pocket payments
On average, in 2004 about one-fifth of expenses for an office-based physician visit were paid out of pocket (19.4 percent) (figure 5), but this percentage varied by physician specialty. The average share paid out of pocket was lowest for visits to cardiologists (12.9 percent) and orthopedists (15.7 percent) and highest for visits to ophthalmologists, psychiatrists, and dermatologists (about one-quarter of expenses for these providers, on average).
Data Source
The estimates in this Statistical Brief are based upon data from the MEPS 2004 Full Year Consolidated File (HC-089) and Office-Based Medical Provider Visits data files (HC-085G).
Definitions
Expenses/expenditures
Payments from all sources for office-based visits to a physician reported by respondents in the MEPS-HC. Sources include direct payments from individuals, private insurance, Medicare, Medicaid, Workers Compensation, and miscellaneous other sources.
Type of specialist
MEPS respondents who reported an office-based visit in which a medical doctor was seen were asked to identify the doctor's specialty (the questionnaire contains 34 response categories for coding the specialty type reported). In this Statistical Brief, the categories for general practice, family practice, and internal medicine (internist) were combined because it may be difficult for respondents to distinguish between these types of primary care physicians (pediatricians were kept as a separate category). Multiple types of physician specialties were combined into the catchall "other" category shown in this brief, including allergy/immunology, anesthesiology, endocrinology/metabolism, gastroenterology, general surgery, geriatrics, hematology, hospital residence, nephrology, nuclear medicine, oncology, osteopathy, otorhinolaryngology (ear, nose, throat), pathology, physical medicine/rehab, plastic surgery, proctology, pulmonary, radiology, rheumatology, thoracic surgery, urology, and other doctor specialty. While each of the specialist types within this category comprised less than 2 percent of physician visits, they cumulatively comprised approximately one-quarter of all visits. A small proportion of visits in which a medical doctor was seen (1.6 percent) were excluded from the analysis because specialty type was not reported.
About MEPS-HC
MEPS-HC is a nationally representative longitudinal survey that collects detailed information on health care utilization and expenditures, health insurance, and health status, as well as a wide variety of social, demographic, and economic characteristics for the civilian noninstitutionalized population. It is cosponsored by the Agency for Healthcare Research and Quality and the National Center for Health Statistics.
For more information about MEPS, call the MEPS information coordinator at AHRQ (301-427-1656) or visit the MEPS Web site at http://www.meps.ahrq.gov/.
References
For a detailed description of the MEPS survey design, sample design, and methods used to minimize sources of nonsampling error, see the following publications:
Cohen, J. Design and Methods of the Medical Expenditure Panel Survey Household Component. MEPS Methodology Report No. 1. AHCPR Pub. No. 97-0026. Rockville, Md.: Agency for Health Care Policy and Research, 1997.
Cohen, S. Sample Design of the 1996 Medical Expenditure Panel Survey Household Component. MEPS Methodology Report No. 2. AHCPR Pub. No. 97-0027. Rockville, Md.: Agency for Health Care Policy and Research, 1997.
Cohen, S. Design Strategies and Innovations in the Medical Expenditure Panel Survey. Medical Care, July 2003: 41(7) Supplement: III-5-III-12
Suggested Citation
Machlin, S. R. and Carper K. Expenses for Office-Based Physician Visits by Specialty, 2004. Statistical Brief #166. March 2007. Agency for Healthcare Research and Quality, Rockville, Md. http://www.meps.ahrq.gov/mepsweb/data_files/publications/st166/stat166.shtml
AHRQ welcomes questions and comments from readers of this publication who are interested in obtaining more information about access, cost, use, financing, and quality of health care in the United States. We also invite you to tell us how you are using this Statistical Brief and other MEPS data and tools and to share suggestions on how MEPS products might be enhanced to further meet your needs. Please e-mail us at mepspd@ahrq.gov or send a letter to the address below:
Stephen B. Cohen, PhD, Director
Center for Financing, Access, and Cost Trends
Agency for Healthcare Research and Quality
540 Gaither Road
Rockville, MD 20850
 |
||||||||||||||||||||||||||||||||||||||||||||||||||
|
||||||||||||||||||||||||||||||||||||||||||||||||||
|
|
||||||||||||||||||||||||||||||||||||||||||||||||||
 |
||||||||||||||||||||||||||||||||||||||||||||||||||
|
||||||||||||||||||||||||||||||||||||||||||||||||||
|
|
||||||||||||||||||||||||||||||||||||||||||||||||||
 |
||||||||||||||||||||||||||||||||||||||||||||||||||
|
||||||||||||||||||||||||||||||||||||||||||||||||||
|
|
||||||||||||||||||||||||||||||||||||||||||||||||||
 |
||||||||||||||||||||||||||||||||||||||||||||||||||
|
||||||||||||||||||||||||||||||||||||||||||||||||||
|
|
||||||||||||||||||||||||||||||||||||||||||||||||||
 |
||||||||||||||||||||||||||||||||||||||||||||||||||
|
||||||||||||||||||||||||||||||||||||||||||||||||||
|
|
||||||||||||||||||||||||||||||||||||||||||||||||||


