
|
|
|
Font Size:
|
||||
|
|
|
|
||||
STATISTICAL BRIEF #214:
The Uninsured in America, 1996-2007: Estimates for the U.S. Civilian Noninstitutionalized Population under Age 65
Highlights
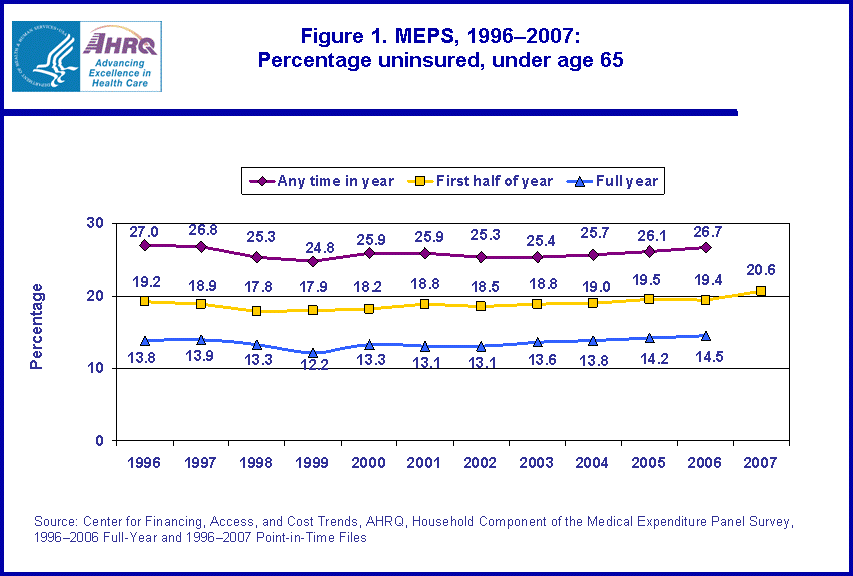
- The percentage of uninsured Americans under age 65 varied, depending on the time period of being uninsured. In 2006, 26.7 percent of the population was uninsured at some point during the year, 19.4 percent was uninsured throughout the first half of the year, and 14.5 percent was uninsured for the entire year.
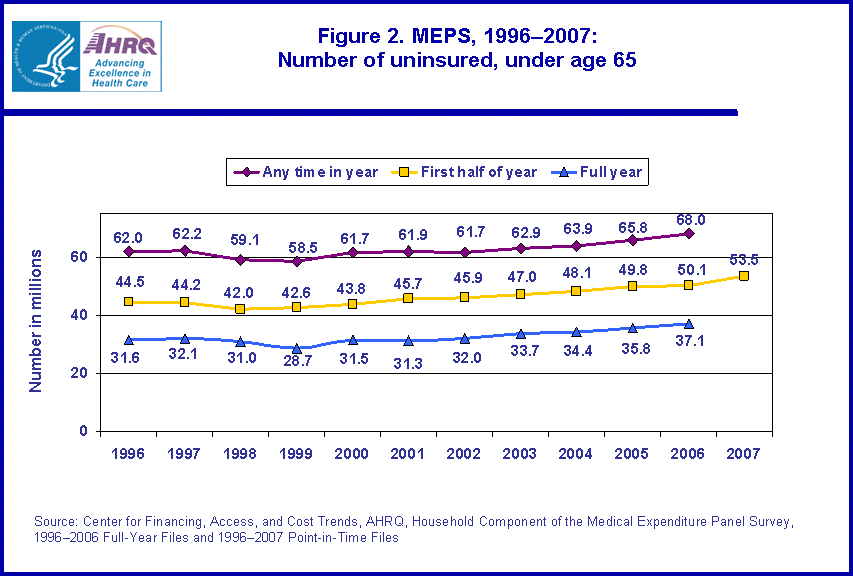
- The number of non-elderly individuals (under age 65) uninsured for the full year increased from 31.6 million in 1996 to 37.1 million in 2006.
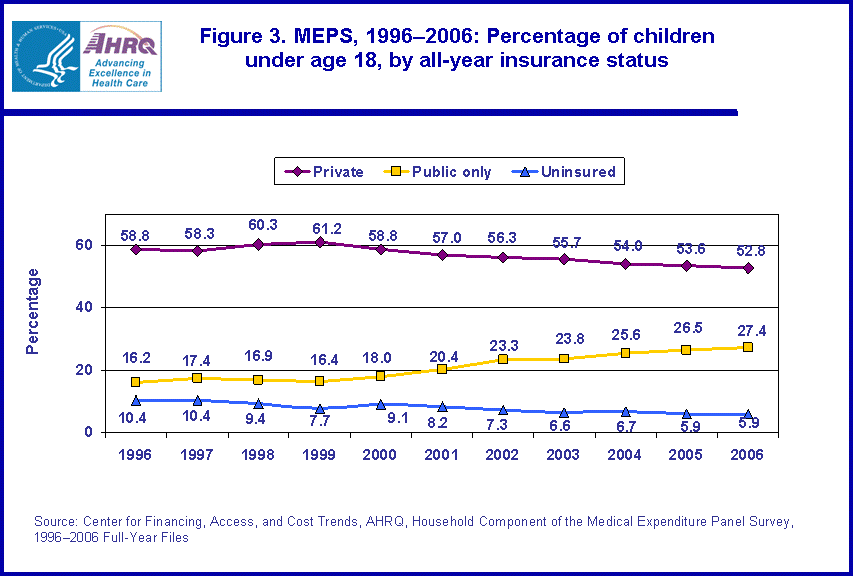
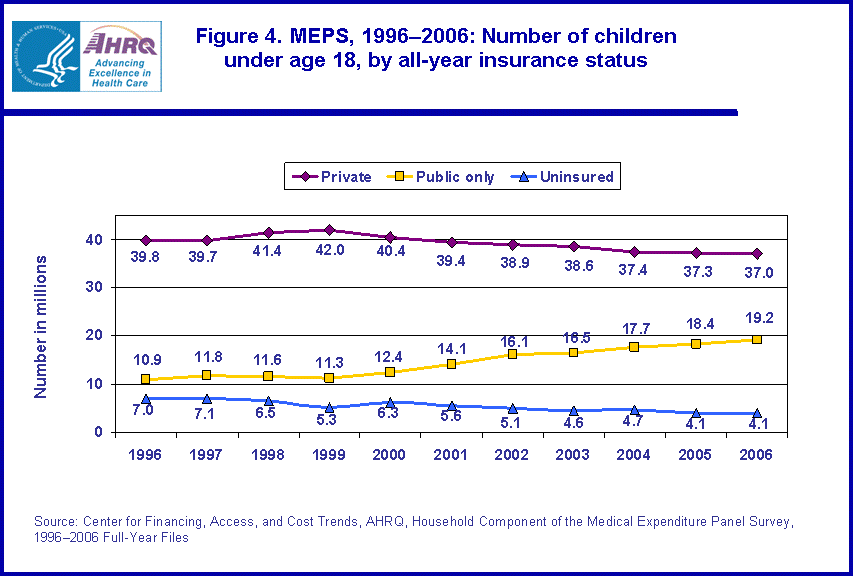
- From 1996 to 2006, the number and percentage of children under age 18 uninsured all year decreased from 7.0 million to 4.1 million and from 10.4 percent to 5.9 percent.
- The number and percentage of children (under age 18) covered by public only insurance increased between 1996 and 2006 from 10.9 million to 19.2 million and from 16.2 percent to 27.4 percent.
Introduction
Estimates of the health insurance status of the U.S. civilian noninstitutionalized population are critical to policymakers and others concerned with access to medical care and the cost and quality of that care. Health insurance helps people get timely access to medical care and protects them against the risk of expensive and unanticipated medical events. Compared to people with health care coverage, uninsured people are less likely to visit a doctor, have a usual source of medical care, receive preventive services, or have a recommended test or prescription filled.*
Timely and reliable estimates of the population's health insurance status are essential to evaluate the costs and expected impact of public policy interventions in this area, such as efforts to expand coverage or to alter the way in which private and public insurance is financed.
The Household Component of the Medical Expenditure Panel Survey (MEPS-HC) conducted since 1996, provides critical information for evaluating trends in the health insurance status of the population. This Statistical Brief presents estimates on the uninsured in America under age 65 for calendar years 1996 through 2006, as well as the first half of 2007. All differences between estimates discussed in the text are statistically significant at the 0.05 level unless otherwise noted.
Findings
The MEPS-HC collects data to produce estimates of the uninsured for three different periods within a calendar year: at any time during the year, throughout the first half of the year, and the entire year. In 2006, the latest year for which all three measures are available, 26.7 percent of the population under age 65 (non-elderly) was uninsured at some point during the year, 19.4 percent was uninsured throughout the first half of the year, and 14.5 percent was uninsured the entire year (figure 1). The number of people uninsured varied by a nearly two-fold margin, depending on the time period of being uninsured. In 2006, 68.0 million non-elderly individuals were uninsured at some point during the year, 50.1 million were uninsured throughout the first half of the year, and 37.1 million were uninsured all year (figure 2).
A comparison of estimates across the time period 1996 to 2006 show that the percentage of the population uninsured at some point during the year declined from 27.0 percent in 1996 to 25.3 percent in 2002, and the percentage uninsured all year declined from 13.8 percent in 1996 to 12.2 percent in 1999 (figure 1). The number of non-elderly individuals uninsured for the full year increased from 31.6 million in 1996 to 37.1 million in 2006 (figure 2).
For the first half of 2007, the most recent MEPS-HC estimates available, 20.6 percent (53.5 million) of the non-elderly population was uninsured (figures 1 and 2).
From 1996 to 2006, the percentage and number of children (under age 18) who were uninsured declined. The percentage of children who were uninsured the entire year declined by 4.5 percentage points, from 10.4 percent to 5.9 percent (figure 3); and the number of children uninsured for the entire year declined by 2.9 million, from 7.0 million to 4.1 million (figure 4). Concurrently, the percentage and number of children covered by public only insurance increased 11.2 percentage points (from 16.2 percent to 27.4 percent, as shown in figure 3) and by 8.3 million (from 10.9 million to 19.2 million, as shown in figure 4). On the other hand, the percentage of children with private insurance declined between 1996 and 2006, from 58.8 percent to 52.8 percent (figure 3).
Data Source
The estimates shown in this Statistical Brief are drawn from analyses conducted by the MEPS staff from the following public use files: 1996-2006 full-year consolidated data files (HC-012, HC-020, HC-028, HC-038, HC-050, HC-060, HC-070, HC079, HC089. HC097) and the 2006 full-year population characteristics data file (HC-099). Point-in-time estimates for years 1996-2007 were derived from data files HC-001, HC-005, HC-009, HC-013, HC-022, HC-034, HC-053, HC-064, HC-075, HC-084, HC 093, and from HC-101 (July 2008) for the first half of 2007.
Definitions
Uninsured
People who did not have insurance coverage at any time during the survey year were classified as uninsured for the full year. People who did not have coverage during the period from January of the survey year through the time of their first interview in that year were classified as uninsured throughout the first half of the year. (Interviews were typically conducted from February to June.) People who lacked coverage for at least one month during the year were classified in the any time in year category. People who were covered only by noncomprehensive State-specific programs (e.g., Maryland Kidney Disease Program) or private single-service plans (e.g., coverage for dental or vision care only, coverage for accidents or specific diseases) were considered to be uninsured.
Public only coverage
People were considered to have public only health insurance coverage if they were not covered by private insurance and they were covered by Medicare, Medicaid, TRICARE, or other public hospital and physician coverage.
Private coverage
Private health insurance coverage was defined as nonpublic insurance that provided coverage for hospital and physician care (including Medigap coverage).
About MEPS-HC
MEPS-HC is a nationally representative longitudinal survey that collects detailed information on health care utilization and expenditures, health insurance, and health status, as well as a wide variety of social, demographic, and economic characteristics for the civilian noninstitutionalized population. It is cosponsored by the Agency for Healthcare Research and Quality and the National Center for Health Statistics.
For more information about MEPS, call the MEPS information coordinator at AHRQ (301-427-1656) or visit the MEPS Web site at http://www.meps.ahrq.gov/.
References
For a detailed description of the MEPS-HC survey design, sample design, and methods used to minimize sources of nonsampling error, see the following publications:
Cohen, J. Design and Methods of the Medical Expenditure Panel Survey Household Component. MEPS Methodology Report No. 1. AHCPR Pub. No. 97-0026. Rockville, MD: Agency for Health Care Policy and Research, 1997. http://www.meps.ahrq.gov/mepsweb/data_files/publications/mr1/mr1.shtml
Cohen, S. Sample Design of the 1996 Medical Expenditure Panel Survey Household Component. MEPS Methodology Report No. 2. AHCPR Pub. No. 97-0027. Rockville, MD: Agency for Health Care Policy and Research, 1997. http://www.meps.ahrq.gov/mepsweb/data_files/publications/mr2/mr2.shtml
Cohen, S. Design Strategies and Innovations in the Medical Expenditure Panel Survey. Medical Care, July 2003: 41(7) Supplement: III-5-III-12.
Ezzati-Rice, TM, Rohde, F, Greenblatt, J, Sample Design of the Medical Expenditure Panel Survey Household Component, 1998-2007. Methodology Report No. 22. March 2008. Agency for Healthcare Research and Quality, Rockville, MD. http://www.meps.ahrq.gov/mepsweb/data_files/publications/mr22/mr22.shtml
Suggested Citation
Chu, M.C. and Rhoades, J. A. The Uninsured in America, 1996-2007: Estimates for the U.S. Civilian Noninstitutionalized Population under Age 65. Statistical Brief #214. July 2008. Agency for Healthcare Research and Quality, Rockville, MD http://www.meps.ahrq.gov/mepsweb/data_files/publications/st214/stat214.shtml
AHRQ welcomes questions and comments from readers of this publication who are interested in obtaining more information about access, cost, use, financing, and quality of health care in the United States. We also invite you to tell us how you are using this Statistical Brief and other MEPS data and tools and to share suggestions on how MEPS products might be enhanced to further meet your needs. Please e-mail us at mepsprojectdirector@ahrq.hhs.gov or send a letter to the address below:
Steven B. Cohen, PhD, Director
Center for Financing, Access, and Cost Trends
Agency for Healthcare Research and Quality
540 Gaither Road
Rockville, MD 20850
Footnotes
* Taylor, A., Cohen, J., and Machlin, S. Being uninsured in 1996 compared to 1987: How has the experience of the uninsured changed over time? Health Services Research, December 2001: 36(6) Part II:16-31.
Weinick, R., Zuvekas, S., and Drilea, S. Access to health care--sources and barriers, 1996. MEPS Research Findings No. 3. AHCPR Pub. No. 98-000l. Rockville, MD: Agency for Health Care Policy and Research, 1997.
 |
||||||||||||||||||||||||||||||||||||||||||||||||||||||||||||||||||||||||||||||
|
||||||||||||||||||||||||||||||||||||||||||||||||||||||||||||||||||||||||||||||
|
|
||||||||||||||||||||||||||||||||||||||||||||||||||||||||||||||||||||||||||||||
 |
||||||||||||||||||||||||||||||||||||||||||||||||||||||||||||||||||||||||||||||
|
||||||||||||||||||||||||||||||||||||||||||||||||||||||||||||||||||||||||||||||
|
|
||||||||||||||||||||||||||||||||||||||||||||||||||||||||||||||||||||||||||||||
 |
||||||||||||||||||||||||||||||||||||||||||||||||||||||||||||||||||||||||||||||
|
||||||||||||||||||||||||||||||||||||||||||||||||||||||||||||||||||||||||||||||
|
|
||||||||||||||||||||||||||||||||||||||||||||||||||||||||||||||||||||||||||||||
 |
||||||||||||||||||||||||||||||||||||||||||||||||||||||||||||||||||||||||||||||
|
||||||||||||||||||||||||||||||||||||||||||||||||||||||||||||||||||||||||||||||
|
|
||||||||||||||||||||||||||||||||||||||||||||||||||||||||||||||||||||||||||||||