
|
|
Font Size:
|
||||
|
|
|
|
||||
STATISTICAL BRIEF #217:
Persons with High Health Care Expenditures: Proportions by Age and Insurance Coverage, 2005
Highlights
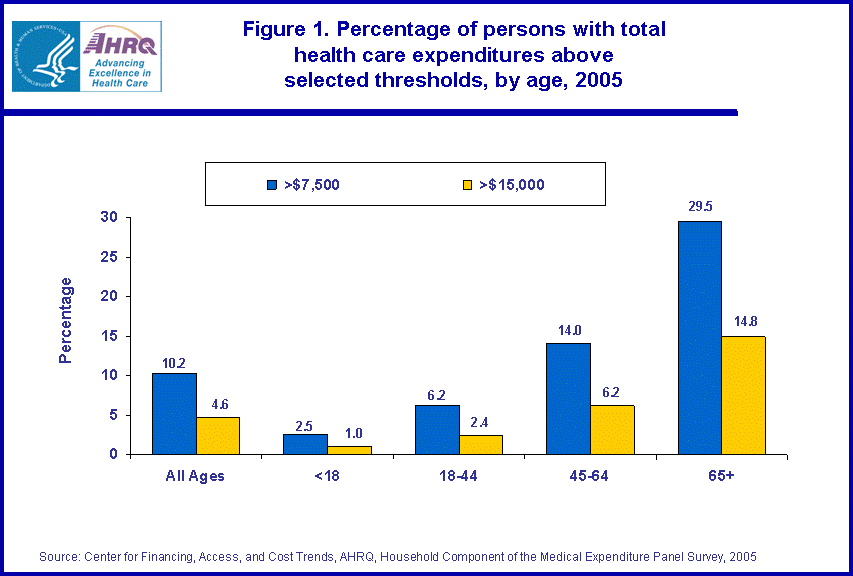
- In 2005, about one of every 10 persons had total health care expenditures greater than $7,500 and almost 5 percent had expenditures greater than $15,000.
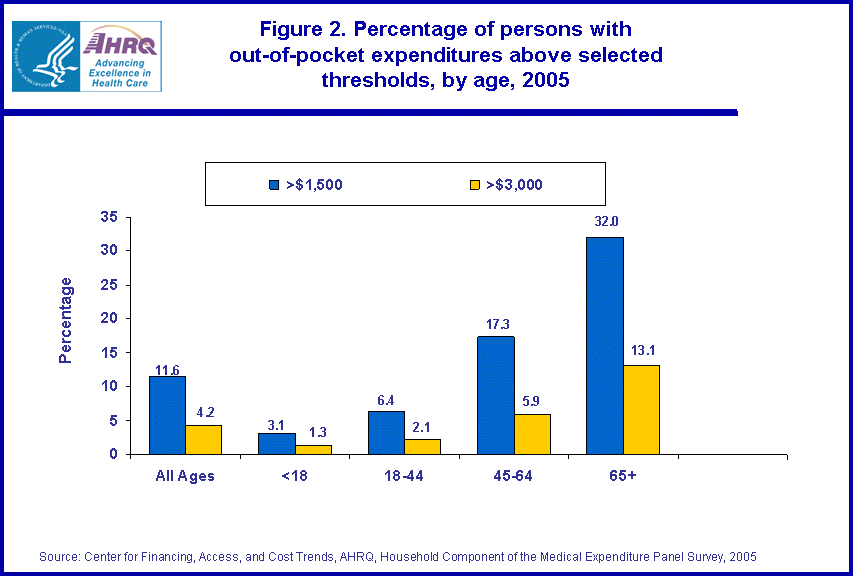
- In 2005, 11.6 percent of persons had out-of-pocket health care expenditures of more than $1,500 while 4.2 percent had out-of-pocket expenditures greater than $3,000.
- The proportion of persons with high levels of total medical expenses and the proportion with high out-of-pocket expenses increased dramatically with age.
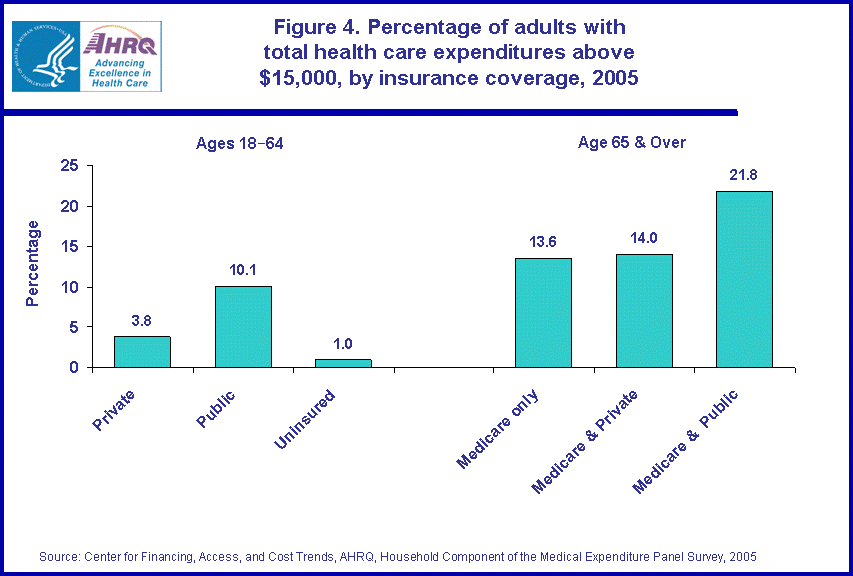
- The proportion of adults age 18-64 with public only insurance (primarily Medicaid) that had total health care expenditures over $15,000 was more than twice that for those with private insurance coverage.
- Elderly persons age 65 and over with Medicare and other public insurance were more likely to have health care expenditures above $15,000 than their counterparts with Medicare only or Medicare and supplemental private coverage.
- Despite a lower likelihood of uninsured adults having high total medical expenses, the likelihood of the uninsured having high out-of-pocket expenses was similar to that for their counterparts with private insurance coverage.
- The likelihood of an individual having out-of-pocket expenses exceeding $3,000 did not vary significantly by family income status.
Introduction
The likelihood of a person having high medical expenses (in total or out of pocket) is affected by several factors, including health status, decisions about health care use by individuals and their health care providers, whether the person is insured, and the generosity of insurance for those with coverage.
This Brief provides estimates from the 2005 Medical Expenditure Panel Survey (MEPS) of proportions of the population with high medical expenditures by age and insurance coverage. All differences between estimates discussed in the text are statistically significant at the .05 level or better.
Estimates are provided separately for total and out-of-pocket expenses. Total expenses include payments from all sources (including third-party payers and other miscellaneous sources) to hospitals, physicians, dental providers, pharmacies and other health care providers for services reported in the MEPS Household Component (HC), but does not include health insurance premiums. Out-of-pocket expenses comprise the portion of total payments made by individuals and families for services received.
We first present variations by age for two selected thresholds of total expenses ($7,500 and $15,000) and two selected thresholds of out-of-pocket expenses ($1,500 and $3,000).1 Then we examine variation in the proportions above the higher thresholds for adults age 18-64 and the elderly age 65 and over by insurance coverage. We also examine variations in individual high out-of-pocket expenses by family income status.
Findings
Variations by age
Total expenses (Figure 1)
In 2005, about one of every 10 persons had health care expenditures greater than $7,500 and almost 5 percent had expenditures greater than $15,000. However, the proportion of persons with high levels of medical expenses increased dramatically with age. For example, only 2.5 percent of children under 18 and 6.2 percent of adults age 18-44 had medical expenses greater than $7,500. In contrast, more than one of every four persons age 65 and over had expenses greater than $7,500 and about 15 percent had expenses that exceeded $15,000.
Out-of-pocket expenses (Figure 2)
In 2005, 11.6 percent of persons had out-of-pocket health care expenditures greater than $1,500 while 4.2 percent had out-of-pocket expenditures greater than $3,000. As for total expenses, the proportion of persons with high levels of out-of-pocket medical expenses increased dramatically with age. For example, only 3.1 percent of children under 18 and 6.4 percent of adults age 18-44 had out of pocket expenses greater than $1,500. In contrast, nearly one-third of persons age 65 and over had out-of-pocket expenses greater than $1,500 and 13.1 percent had expenses that exceeded $3,000.
Variations among adults by insurance coverage
Figures 3-5 cover variations by insurance coverage for adults age 18-64 and the elderly age 65 and over. Variations for children under 18 are not analyzed because of insufficient sample sizes.
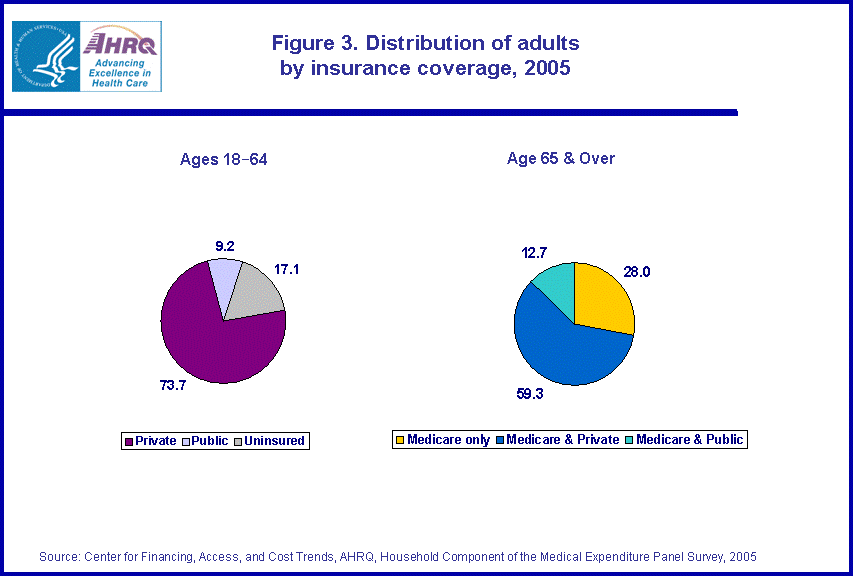
Distributions of adults by insurance coverage (Figure 3)
Nearly three quarters of adults age 18-64 had private insurance coverage at some point during the year (73.7 percent) while an additional 9.2 percent had public only coverage (primarily Medicaid). About 17 percent of persons age 18-64 were uninsured throughout the year.
Among persons age 65 and over covered by Medicare (which comprises the overwhelming majority of the elderly population), most had supplementary private coverage (59.3 percent) while 12.7 percent had other public coverage. About one-quarter of elderly persons (28.0 percent) were covered by Medicare only.
Total expenses (Figure 4)
The proportion of adults age 18-64 with public only insurance (primarily Medicaid) that had total health care expenditures over $15,000 was more than twice that for those with private insurance coverage (10.1 versus 3.8 percent). Only 1.0 percent of uninsured adults age 18-64 had expenditures greater than $15,000. The greater likelihood of high expenses for persons with public only coverage is consistent with a substantially higher proportion in fair or poor health (36 percent versus 10 percent of other adults age 18-64--data not shown in a figure).
Elderly persons age 65 and over with Medicare and other public insurance (primarily Medicaid) were more likely to have health care expenditures above $15,000 (21.8 percent) than those with Medicare only or Medicare and supplemental private coverage (about 14 percent for each group). This difference is consistent with a higher proportion of persons with Medicare and other public insurance being in fair or poor health (44 percent versus 22 percent of other elderly persons--data not shown in a figure).
Out-of-pocket expenses (Figures 5 and 6)
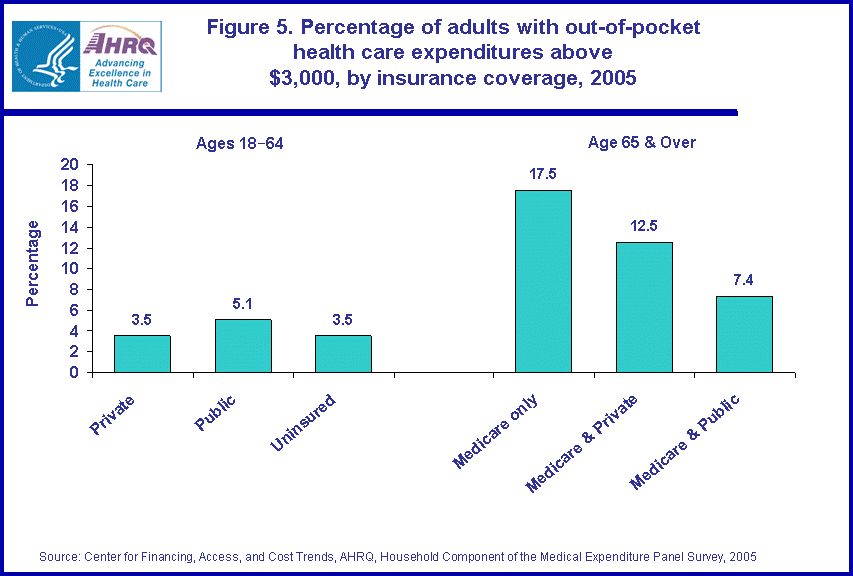
Adults age 18-64 with public only insurance (primarily Medicaid) were slightly more likely to have out-of-pocket health care expenditures over $3,000 than their counterparts with private coverage or no insurance (5.1 versus 3.5 percent for both the privately insured and uninsured) (Figure 5).
The likelihood of the uninsured having high out-of-pocket expenses did not differ from that for those with private insurance coverage (3.5 percent) despite a lower likelihood of having total medical expenses above the $15,000 threshold (see Figure 4).
Among persons age 65 and over, those with Medicare and other public insurance coverage were least likely (7.4 percent) while those with Medicare only were most likely (17.5 percent) to have out-of-pocket health care expenditures greater than $3,000.
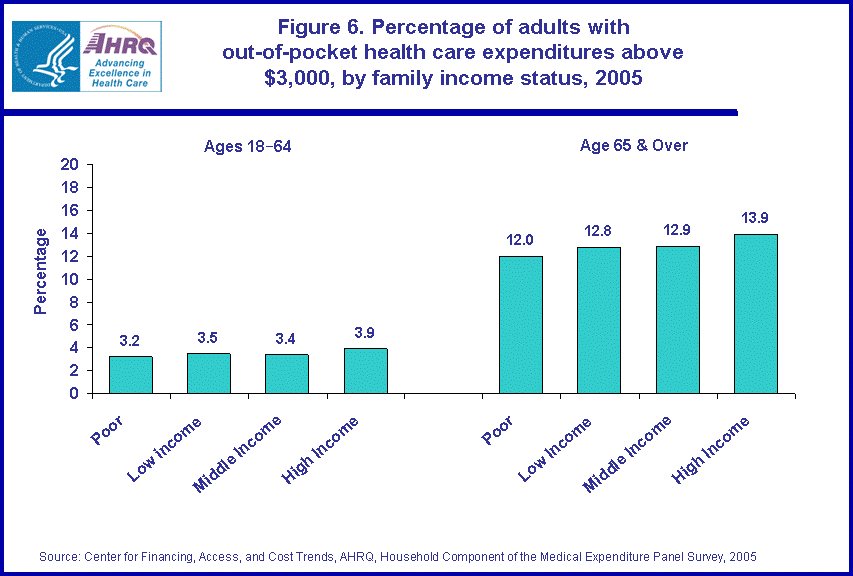
The likelihood of having out-of-pocket expenses that exceeded $3,000 did not vary significantly by family income status among either adults age 18-64 or the elderly age 65 and over (Figure 6). Nonetheless, an individual having expenses above $3,000 constitutes a greater burden for lower income than higher income families.
Definitions
Expenses for health care
Total: Includes payments from all sources (including third-party payers and other miscellaneous sources) to hospitals, physicians, dental providers, pharmacies and other health care providers for services reported in the MEPS Household Component of the survey, but does not include health insurance premiums.
Out-of-pocket: The portion of total expenses paid by individuals and families for services received during the year.
Health insurance status
Based on household responses to health insurance status questions, adults age 18-64 were classified in the following three insurance categories:
- Private health insurance: Individuals who, at any time during the year, had insurance that provides coverage for hospital and physician care (other than Medicare, Medicaid, or other public hospital/physician coverage). Coverage by TRICARE (Armed Forces-related coverage) was also included as private health insurance. Insurance that provides coverage for a single service only, such as dental or vision coverage, was not included.
- Public coverage only: Individuals who met both of the following criteria: 1) not covered by private insurance at any time during the year, 2) were covered by any of the following public programs at any point during the year: Medicare, Medicaid, or other public hospital/physician coverage.
- Uninsured: Persons not covered by private hospital/physician insurance, TRICARE, Medicare, Medicaid, or other public hospital/physician programs at any time during the entire year (or period of eligibility for the survey if that was less than a year).
- Medicare and private insurance: This category includes persons covered by Medicare and a supplementary private policy.
- Medicare and other public insurance: This category includes persons classified as Medicare beneficiaries who were not covered by private insurance at any point during the year but were covered by Medicaid or other public hospital/physician coverage at some point during the year.
- Medicare only: Persons classified as Medicare beneficiaries but not classified in either of the two categories above.
Family income status
Personal income from all family members within a household was summed to create family income. Based on the ratio of family income to the Federal poverty thresholds, which vary with family size and age of the head of family, categories are defined as follows:
- Poor: Persons in families with income less than 100 percent of the poverty line, including those who reported negative income.
- Low income: Persons in families with income from 100-99 percent of the poverty line.
- Middle income: Persons in families with income from 200-399 percent of the poverty line.
- High income: Persons in families with income of at least 400 percent of the poverty line.
About MEPS-HC
The MEPS Household Component (HC) is a nationally representative longitudinal survey that collects detailed information on health care utilization and expenditures, health insurance, and health status, as well as a wide variety of social, demographic, and economic characteristics for the civilian noninstitutionalized population. It is cosponsored by the Agency for Healthcare Research and Quality and the National Center for Health Statistics.
For more information about MEPS, call the MEPS information coordinator at AHRQ (301-427-1406) or visit the MEPS Web site at http://www.meps.ahrq.gov/.
References
Cohen, J. Design and Methods of the Medical Expenditure Panel Survey Household Component. MEPS Methodology Report No. 1. AHCPR Pub. No. 97-0026. Rockville, MD: Agency for Healthcare Policy and Research, 1997. http://www.meps.ahrq.gov/mepsweb/data_files/publications/mr1/mr1.shtml
Cohen, S. Sample Design of the 1996 Medical Expenditure Panel Survey Household Component. MEPS Methodology Report No. 2. AHCPR Pub. No. 97-0027. Rockville, MD: Agency for Health Care Policy and Research, 1997. http://www.meps.ahrq.gov/mepsweb/data_files/publications/mr2/mr2.shtml
Cohen, S. Design Strategies and Innovations in the Medical Expenditure Panel Survey. Medical Care, July 2003: 41(7) Supplement: III-5-III-12.
Suggested Citation
Machlin, S., and Cohen J. Persons with High Health Care Expenses: Proportions by Age and Insurance Coverage, 2005. Statistical Brief #217. August 2008. Agency for Healthcare Research and Quality, Rockville, MD, http://www.meps.ahrq.gov/mepsweb/data_files/publications/st217/stat217.pdf
AHRQ welcomes questions and comments from readers of this publication who are interested in obtaining more information about access, cost, use, financing, and quality of health care in the United States. We also invite you to tell us how you are using this Statistical Brief and other MEPS data and tools and to share suggestions on how MEPS products might be enhanced to further meet your needs. Please e-mail us at MEPSProjectDirector@ahrq.hhs.gov or send a letter to the address below:
Steven B. Cohen, PhD, Director
Center for Financing, Access, and Cost Trends
Agency for Healthcare Research and Quality
540 Gaither Road
Rockville, MD 20850
1 These thresholds were selected to roughly approximate the 90th and 95th percentile expenditure levels. The actual values of these percentiles were $7,628 and $14,095 respectively for total expenses, and $1,692 and $2,710 respectively for out-of-pocket expenses.
 |
||||||||||||||||||||
Source: Center for Financing, Access, and Cost Trends, AHRQ, Household Component of the Medical Expenditure Panel Survey, 2005 | ||||||||||||||||||||
|
|
||||||||||||||||||||
 |
||||||||||||||||||||
Source: Center for Financing, Access, and Cost Trends, AHRQ, Household Component of the Medical Expenditure Panel Survey, 2005 | ||||||||||||||||||||
 |
||||||||||||||||||||
Source: Center for Financing, Access, and Cost Trends, AHRQ, Household Component of the Medical Expenditure Panel Survey, 2005
Source: Center for Financing, Access, and Cost Trends, AHRQ, Household Component of the Medical Expenditure Panel Survey, 2005 | ||||||||||||||||||||
 |
||||||||||||||||||||
Source: Center for Financing, Access, and Cost Trends, AHRQ, Household Component of the Medical Expenditure Panel Survey, 2005
Source: Center for Financing, Access, and Cost Trends, AHRQ, Household Component of the Medical Expenditure Panel Survey, 2005 | ||||||||||||||||||||
 |
||||||||||||||||||||
Source: Center for Financing, Access, and Cost Trends, AHRQ, Household Component of the Medical Expenditure Panel Survey, 2005
Source: Center for Financing, Access, and Cost Trends, AHRQ, Household Component of the Medical Expenditure Panel Survey, 2005 | ||||||||||||||||||||
 |
||||||||||||||||||||
Source: Center for Financing, Access, and Cost Trends, AHRQ, Household Component of the Medical Expenditure Panel Survey, 2005
Source: Center for Financing, Access, and Cost Trends, AHRQ, Household Component of the Medical Expenditure Panel Survey, 2005 |
||||||||||||||||||||
|
|


