
|
|
Font Size:
|
||||
|
|
|
|
||||
STATISTICAL BRIEF #225:
Characteristics of Non-Hispanic Asian and Non-Hispanic White Adults Uninsured for 6 to 12 Months during a Year, 2002-2005
Highlights
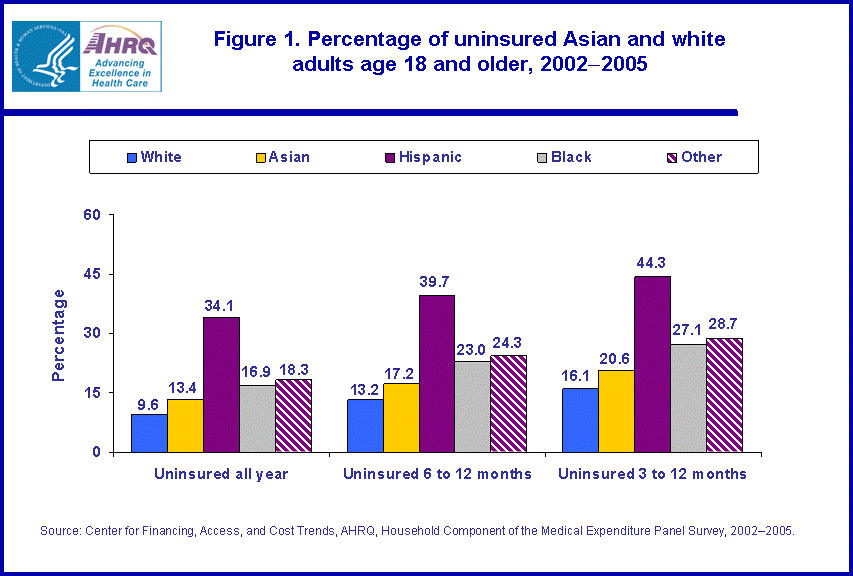
- For the period 2002 through 2005, non-Hispanic Asian adults ages 18 and older were more likely than non-Hispanic white adults to be uninsured. For instance, Asian adults were 4.0 percentage points on average more likely than white adults to be uninsured for 6 to 12 months during the year (17.2 percent of Asians versus 13.2 percent of whites).
- Hispanic adults were more likely than white adults to be uninsured. For instance, Hispanic adults were 26.5 percentage points more likely than white adults to be uninsured for 6 to 12 months during the year (39.7 percent of Hispanics versus 13.2 percent of whites).
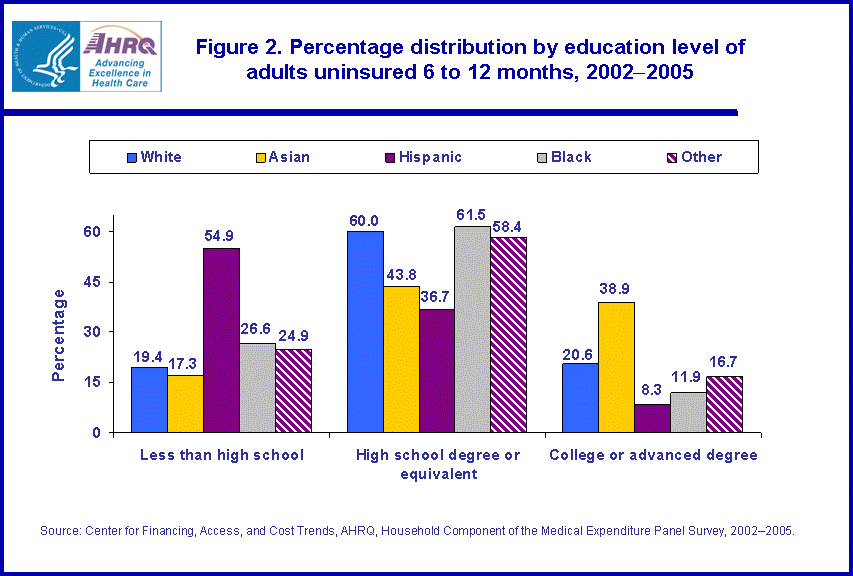
- 38.9 percent of Asian adults uninsured for 6 to 12 months had a college or advanced degree, compared with 20.6 percent of white adults--a difference of 18.3 percentage points.
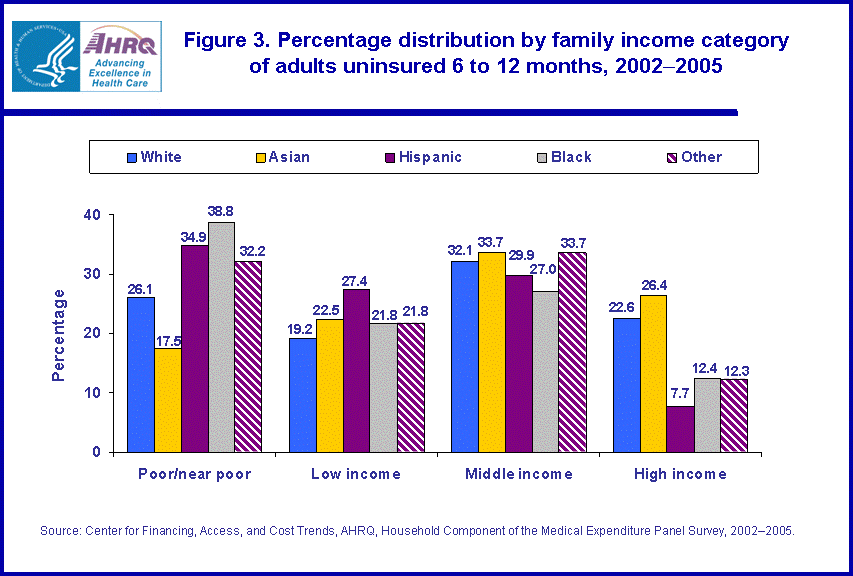
- Approximately 1 out of 4 Asian adults without insurance for 6 to 12 months were members of families that had a high level of income (the family income was greater than 400 percent of the federal poverty line).
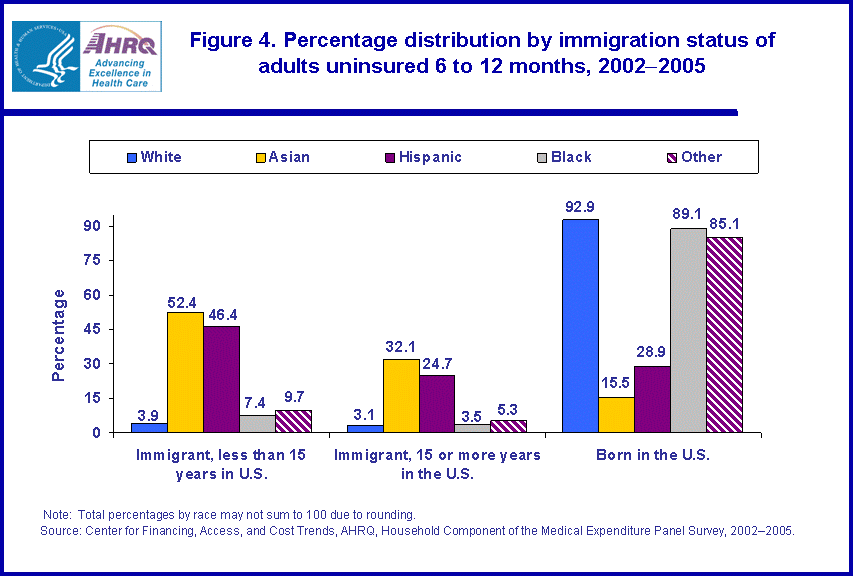
- 52.4 percent of Asians without health insurance for 6 to 12 months were immigrants who had lived in the United States for less than 15 years.
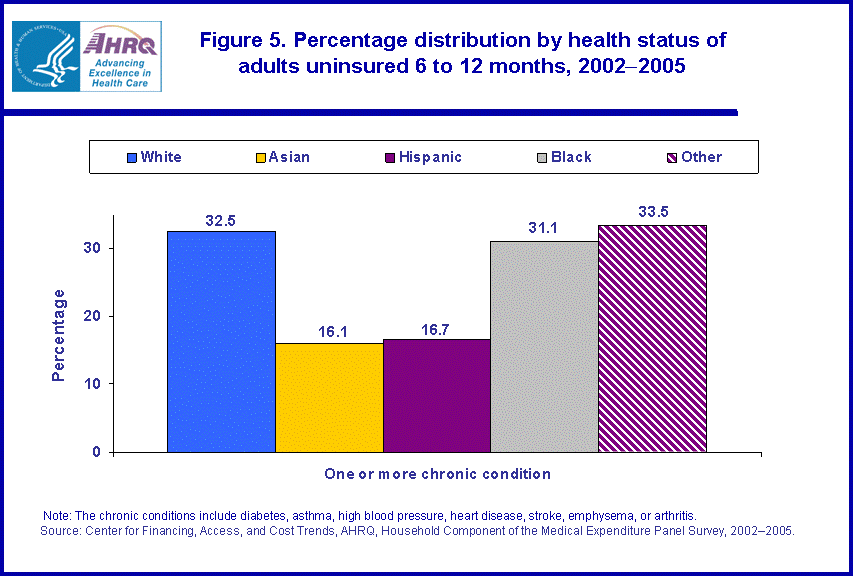
- 32.5 percent of white adults without health insurance for 6 to 12 months had 1 or more of the following chronic conditions (diabetes, asthma, high blood pressure, heart disease, stroke, emphysema, or arthritis) compared with 16.1 percent of Asian adults--a difference of 16.4 percent.
Introduction
Non-Hispanic Asians are one of the fastest growing racial or ethnic groups in the United States, largely due to increases in immigration. In 2000, 62 percent of Asian and Pacific Islanders in the U.S. were immigrants.1 For the period 2004 through 2006, 77 percent of Asian adults were immigrants.2 Many of these immigrants face significant linguistic and cultural barriers which may affect their access to jobs that offer health insurance or their propensity or ability to purchase health insurance on their own.
Adults with health insurance are more likely to purchase health care and have better health. People without health insurance receive less preventive care, are in worse health when diagnosed with a condition, and receive less therapeutic care.3 In addition, health insurance provides protection against the risk of unanticipated high or catastrophic medical expenses.
This Statistical Brief compares selected characteristics of non-Hispanic Asian and non-Hispanic white adults ages 18 and older who lacked health insurance coverage for 6 to 12 months for the period 2002 through 2005. For context, estimates of these characteristics for Hispanic, non-Hispanic black, and other race adults are also presented, and some estimates for adults in these additional racial/ethnic categories are discussed. The adults in the other race category include Pacific Islanders, Native Americans, native Alaskans, native Hawaiians, and adults of multiple races.
Four characteristics are compared: 1) level of education, 2) family income level, 3) immigration status, and 4) health status. In addition, estimates are presented of the percentage of adults who were (on average for 2002-2005): 1) uninsured an entire calendar year, 2) uninsured for 6 to 12 months during the year, and 3) uninsured for 3 to 12 months during the year. Estimates in this brief are based on data from the Household Component of the Medical Expenditure Panel Survey (MEPS-HC) pooled for 2002 through 2005. All differences between estimates discussed in the text are statistically significant at the 0.05 level.
Findings
For the period 2002 through 2005, non-Hispanic Asian adults were more likely than non-Hispanic white adults to be uninsured an entire calendar year as well as for 3 to 12 months or 6 to 12 months during the year (figure 1). Asian adults were 3.8 percentage points more likely than white adults to be uninsured an entire calendar year (13.4 percent of Asian adults versus 9.6 percent of white adults). Asian adults were 4.0 percentage points more likely than white adults to be uninsured for 6 to 12 months during the year (17.2 percent of Asian adults versus 13.2 percent of white adults). The difference was 4.5 percentage points for those uninsured for 3 to 12 months (20.6 percent of Asian adults versus 16.1 percent of white adults).
Hispanic, non-Hispanic black, and adults of other races were also more likely than whites to be uninsured for an entire calendar year as well as for 3 to 12 months or 6 to 12 months during the year. Relative to white adults, the largest percentage differences in insurance coverage were among Hispanic adults. For instance, 34.1 percent of all Hispanic adults were uninsured an entire calendar year (compared with 9.6 percent of white adults), and 44.3 percent of Hispanic adults were uninsured for 3 to 12 months during the year (compared with 16.1 percent of white adults).
Approximately 1 out of 5 non-Hispanic white adults without insurance for 6 to 12 months had a college or advanced degree (figure 2) or had high family income (figure 3). As shown in figure 2, a substantially higher percent of Asian adults without insurance for 6 to 12 months had a college or advanced degree (38.9 percent), compared with 20.6 percent of white adults--a difference of 18.3 percentage points. As shown in figure 3, 26.4 percent of uninsured Asian adults were in the high family income category.4 There are no statistically significant differences in the percentages of Asian and white uninsured adults in the high, middle, or low income categories. Alternatively, there is an 8.6 percentage point difference between uninsured Asian and white adults in the poor/near poor family income category, with a substantively lower percent of Asians uninsured for 6 to 12 months in the poor or near poor category (17.5 percent) compared with 26.1 percent of whites.
For the period 2002 through 2005, 83.3 percent of Asian adults in the civilian, noninstitutionalized population were immigrants (not shown). On average, 84.5 percent of Asians uninsured for 6 to 12 months were immigrants (figure 4). Most of these immigrants have lived in the U.S. for less than 15 years (52.4 percent); 32.1 percent have lived in the U.S. for 15 or more years. A much smaller percentage of white adults (5.3 percent) were immigrants during this period (not shown). On average, 7.1 percent of uninsured white adults were immigrants.
Uninsured Asian adults were substantively less likely than white adults to have reported one or more of the following set of chronic conditions (diabetes, asthma, high blood pressure, heart disease, stroke, emphysema, or arthritis).5 For the period 2002 through 2005, 16.1 percent of uninsured Asian adults and 32.5 percent of uninsured white adults had at least one of these conditions.
Data Source
The estimates in this Statistical Brief are based on data from the MEPS-HC and National Health Interview Survey (NHIS) pooled for 2002 through 2005. The data are pooled to increase statistical precision.
Individual-level data on immigration status are from the NHIS. The NHIS, conducted by the National Center for Health Statistics, is a major source of information on the health of the civilian, institutionalized population of the U.S. Each year the MEPS household sample is drawn from the NHIS sampling frame.
Definitions/Methodology
Racial and Ethnic Classifications
Classification by race and ethnicity is mutually exclusive and based on information reported for each family member. Respondents were asked if each family member's race was best described as white, black, Asian, American Indian, Alaska Native, native Hawaiian, Pacific Islander, or multiple races. All persons whose main national origin or ancestry was reported as Hispanic, regardless of racial background, are classified as Hispanic. All non-Hispanic persons whose race was reported as American Indian, Alaska native, native Hawaiian, or multiple races are classified in the other race category.
Age
Age is the last available age for the sampled person. For most persons, this was their age at the end of the year.
Adults
Adults are ages 18 and older.
Health Insurance
Adults are defined as insured during a month if they held one of the following types of coverage any time during that month: private insurance, Medicaid, Medicare, TRICARE, SCHIP (State Children's Health Insurance Program), or other public hospital/physician coverage.6 Adults without health insurance for part of the year (6 to 12 months or 3 to 12 months) could have nonconsecutive months without insurance coverage.
Income Level
Family income is expressed in terms of the ratio of the family's income to the federal poverty thresholds, which control for the size of the family and the age of the head of the family (see the Department of Health and Human Services Poverty Guidelines at http://aspe.hhs.gov/POVERTY/figures-fed-reg.shtml for more details). In this Statistical Brief, the following income level classification is used:
Poor/near poor: Persons in families with income less than 125 percent of the poverty line, including those whose losses exceeded their earnings, resulting in negative income.
Low income: Persons in families with income from 125 percent to less than 200 percent of the poverty line.
Middle income: Persons in families with income from 200 percent to less than 400 percent of the poverty line.
High income: Persons in families with income at or over 400 percent of the poverty line.
Federal poverty thresholds are based on family units as defined in the Current Population Survey (CPS), but the definition of families in MEPS-HC differs from the CPS definition (mainly with respect to the classification of foster children and unmarried persons living together). In the few instances where there are differences, the poverty threshold for the MEPS-HC family unit is based on that of the person who owns or rents the home. For further details, see MEPS-HC documentation at: http://www.meps.ahrq.gov/mepsweb/data_stats/download_data_files_detail.jsp?cboPufNumber=HC-097
Chronic condition
Chronic conditions include the seven priority conditions in the MEPS questionnaire: diabetes, asthma, high blood pressure, heart disease (including coronary heart disease, angina, or myocardial infarction), stroke, emphysema, or arthritis. The MEPS questionnaire asks sample members whether they have ever been told by a doctor that they had any of these priority conditions. These priority conditions were selected because they are relatively prevalent, and generally accepted standards for appropriate clinical care have been developed for them. MEPS sample members may report being diagnosed with any of these conditions even if they had not been treated specifically for any of them during the past year.
About MEPS-HC
MEPS-HC is a nationally representative longitudinal survey that collects detailed information on health care utilization and expenditures, health insurance, and health status, as well as a wide variety of social, demographic, and economic characteristics for the civilian, noninstitutionalized population. It is cosponsored by the Agency for Healthcare Research and Quality and the National Center for Health Statistics.
For more information about MEPS, call the MEPS information coordinator at AHRQ (301-427-1656) or visit the MEPS website at http://www.meps.ahrq.gov/.
References
For information on the demographic and health characteristics of Asians, see the following publications:
Barnes, P., P. Adams, and E. Powell-Griner. Health Characteristics of the Asian Adult Population: United States, 2004-2006. Advance data from vital and health statistics, no. 394. Hyattsville, MD: National Center for Health Statistics, 2008.
Schmidley, A.D. Profile of the Foreign-Born Population in the United States: 2000. U.S. Census Bureau, Current Population Reports, Series P23-206. U.S. Government Printing Office, Washington, DC, 2001.
For a review of the literature on the consequences of being uninsured, see the following publication:
Hadley, J. Sicker and poorer--the consequences of being uninsured: A review of the research on the relationship between health insurance, medical care use, health, work, and income. Medical Care Research and Review, June 2003:60(2)Supplement:3S-75S.
For a detailed description of the MEPS-HC survey design, sample design, and methods used to minimize sources of nonsampling error, see the following publications:
Cohen, J. Design and Methods of the Medical Expenditure Panel Survey Household Component. MEPS Methodology Report No. 1. AHCPR Pub. No. 97-0026. Rockville, MD: Agency for Health Care Policy and Research, 1997. http://www.meps.ahrq.gov/mepsweb/data_files/publications/mr1/mr1.shtml
Cohen, S. Sample Design of the 1996 Medical Expenditure Panel Survey Household Component. MEPS Methodology Report No. 2. AHCPR Pub. No. 97-0027. Rockville, MD: Agency for Health Care Policy and Research, 1997. http://www.meps.ahrq.gov/mepsweb/data_files/publications/mr2/mr2.shtml
Cohen, S. Design strategies and innovations in the Medical Expenditure Panel Survey. Medical Care, July 2003: 41(7) Supplement: III-5-III-12.
Suggested Citation
Sing, M. Characteristics of Non-Hispanic Asian and Non-Hispanic White Adults Uninsured for 6 to 12 Months during a Year, 2002-2005. Statistical Brief #225. October 2008. Agency for Healthcare Research and Quality, Rockville, MD, http://www.meps.ahrq.gov/data_files/publications/st225/stat225.shtml
AHRQ welcomes questions and comments from readers of this publication who are interested in obtaining more information about access, cost, use, financing, and quality of health care in the United States. We also invite you to tell us how you are using this Statistical Brief and other MEPS data and tools and to share suggestions on how MEPS products might be enhanced to further meet your needs. Please e-mail us at mepspd@ahrq.gov or send a letter to the address below:
Steven B. Cohen, PhD
Director
Center for Financing, Access, and Cost Trends
Agency for Healthcare Research and Quality
540 Gaither Road
Rockville, MD 20850
1Schmidley, A.D. Profile of the Foreign-Born Population in the United States: 2000. U.S. Census Bureau, Current Population Reports, Series P23-206. U.S. Government Printing Office, Washington, DC, 2001.
2Barnes, P., P. Adams, and E. Powell-Griner. Health Characteristics of the Asian Adult Population: United States, 2004-2006. Advance data from vital and health statistics, no. 394. Hyattsville, MD: National Center for Health Statistics, 2008.
3Hadley, J. Sicker and poorer-the consequences of being uninsured: A review of the research on the relationship between health insurance, medical care use, health, work, and income. Medical Care Research and Review, June 2003:60(2) Supplement: 3S-75S.
4For the remainder of this Statistical Brief, when the term "uninsured" is used without reference to a specific time period, it refers to adults who were uninsured for 6 to 12 months during the year.
5These conditions were selected as priority conditions in the MEPS questionnaire because they are relatively prevalent and generally accepted standards for appropriate clinical care have been developed for them.
6In many states, people who were 18 years old were eligible for SCHIP coverage for the period 2002 through 2005 if they also met the other SCHIP eligibility requirements.
 |
||||||||||||||||||||||||||||||||||||||||
|
||||||||||||||||||||||||||||||||||||||||
|
|
||||||||||||||||||||||||||||||||||||||||
 |
||||||||||||||||||||||||||||||||||||||||
|
||||||||||||||||||||||||||||||||||||||||
|
|
||||||||||||||||||||||||||||||||||||||||
 |
||||||||||||||||||||||||||||||||||||||||
|
||||||||||||||||||||||||||||||||||||||||
|
|
||||||||||||||||||||||||||||||||||||||||
 |
||||||||||||||||||||||||||||||||||||||||
|
||||||||||||||||||||||||||||||||||||||||
|
|
||||||||||||||||||||||||||||||||||||||||
 |
||||||||||||||||||||||||||||||||||||||||
|
||||||||||||||||||||||||||||||||||||||||
|
|
||||||||||||||||||||||||||||||||||||||||


