
|
|
Font Size:
|
||||
|
|
|
|
||||
STATISTICAL BRIEF #235:
Trends in Outpatient Prescription Analgesics Utilization and Expenditures for the U.S. Civilian Noninstitutionalized Population, 1996 and 2006
Highlights
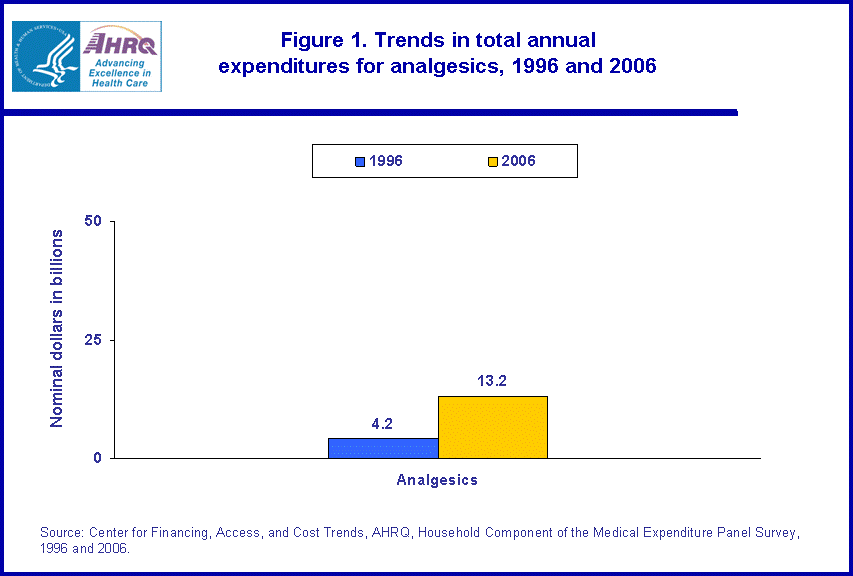
- From 1996 to 2006, total expenditures for prescription analgesics purchased in an outpatient setting more than tripled, rising from $4.2 billion to $13.2 billion.
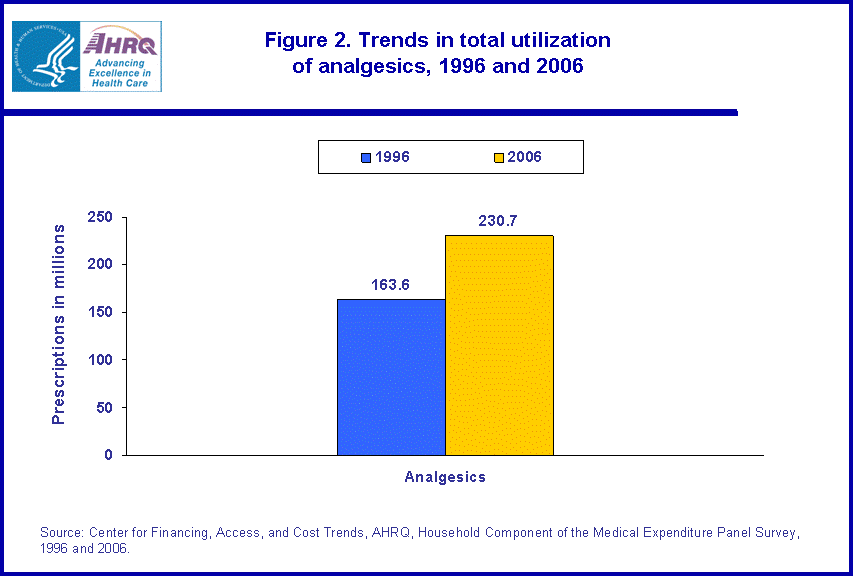
- When comparing 1996 and 2006, total number of outpatient prescription purchases of analgesics increased from 163.6 million prescription purchases in 1996 to 230.7 million prescription purchases in 2006.
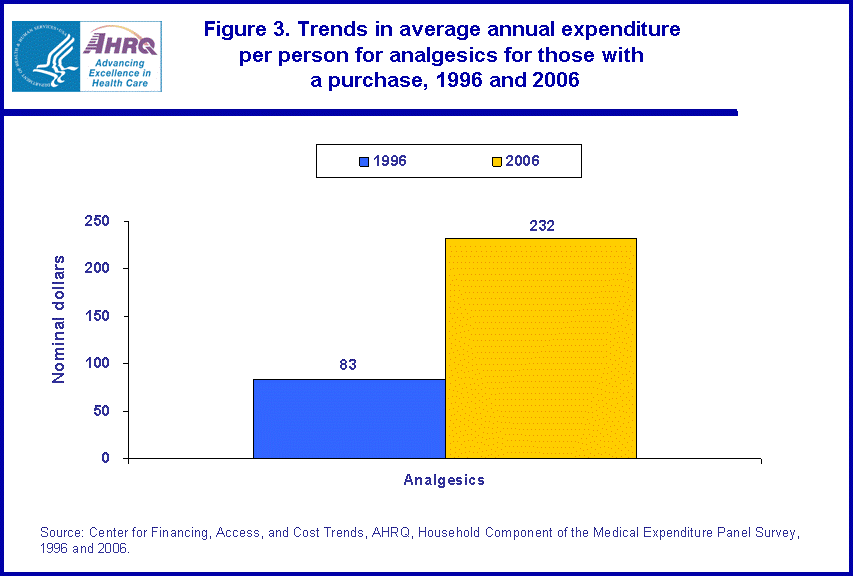
- The average expenditure for persons with at least one prescription medicine purchase of an outpatient analgesic nearly tripled, rising from $83 to $232, when comparing 1996 to 2006.
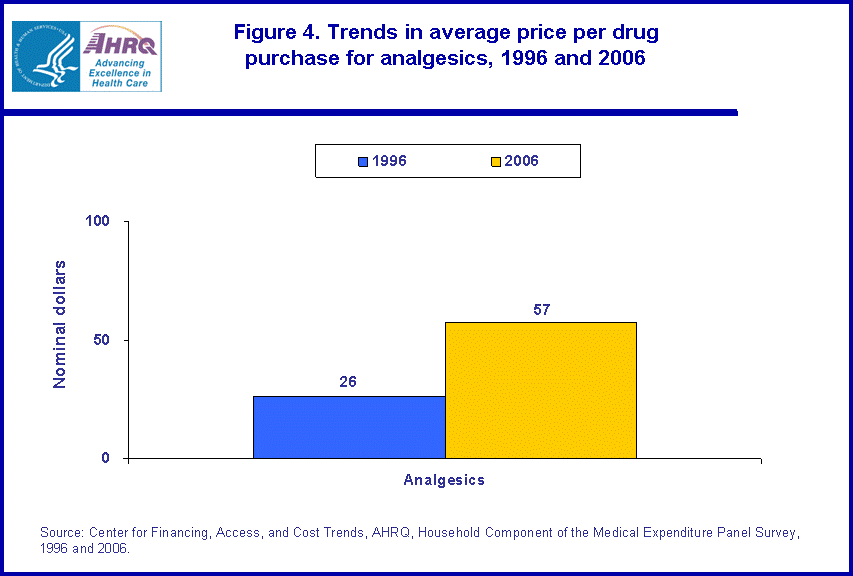
- The average expenditure per drug purchase of an outpatient prescription analgesic more than doubled from 1996 to 2006, rising from $26 to $57.
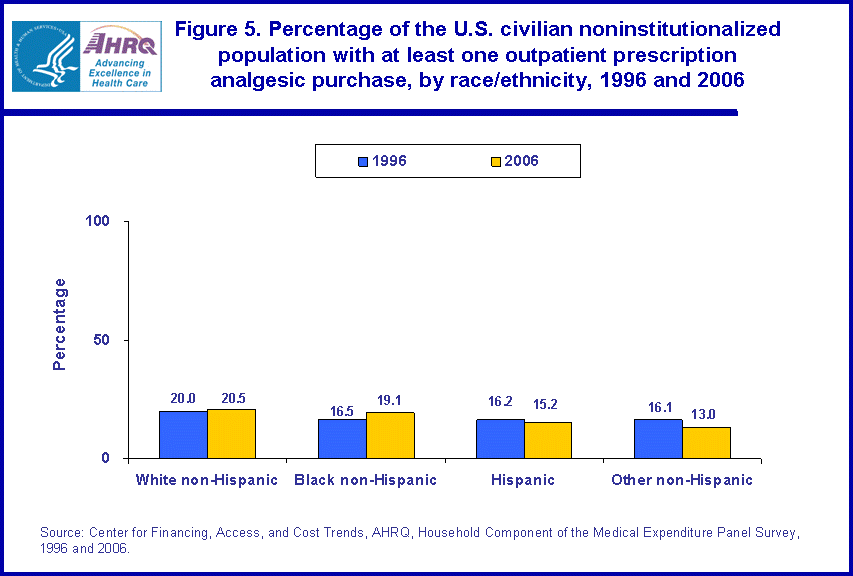
- When comparing the years 1996 and 2006 and the proportion of the population purchasing at least one outpatient prescription analgesic by race/ethnicity, there was an increase in the proportion of black non-Hispanics purchasing at least one analgesic which increased from 16.5 percent to 19.1 percent.
Introduction
This Statistical Brief presents trends in utilization and expenditures for outpatient prescription analgesics (pain relievers, medicines that treat aches and pains) for the years 1996 and 2006. The estimates are for the U.S. civilian noninstitutionalized population and are derived from the 1996 and 2006 Household Component of the Medical Expenditure Panel Survey (MEPS-HC). For outpatient prescription analgesics, the Brief compares 1996 and 2006 total expenditures, total number of purchases, and total number of persons purchasing, as well as the average annual expenditure per person with a purchase and average expenditure per purchase.
Only prescribed medicine purchases in an outpatient setting are included in the estimates presented in this Brief. Prescription medicines administered in an inpatient setting, clinic, or physician's office are excluded from these estimates. Expenditures are in nominal dollars.1 All differences discussed in the text are statistically significant at the 0.05 level.
Findings
In 1996, there were 268.9 million persons in the U.S. noninstitutionalized civilian population and the proportion of the population purchasing at least one outpatient prescription analgesic was 19.0 percent (or 51.1 million people). In 2006, the total U.S. noninstitutionalized civilian population had grown to 299.3 million persons and the proportion of the population purchasing at least one analgesic remained at 19.0 percent (or 57.0 million people).
When comparing 1996 and 2006, MEPS nominal dollar estimates showed an increase of more than 200 percent from $4.2 billion in 1996 to $13.2 billion in 2006 for total outpatient prescription expenditures for analgesics (figure 1).
Total prescribed medicine purchases of outpatient prescription analgesics rose from 163.6 million prescription purchases in 1996 to 230.7 million prescription purchases in 2006 (figure 2).
When comparing 1996 and 2006, for those with at least one prescription analgesic drug purchase in an outpatient setting, the average annual expenditure increased 180 percent from $83 to $232 (figure 3).
The average expenditure for an outpatient prescription analgesic increased 119 percent when comparing 1996 with 2006, rising from $26 in 1996 to $57 in 2006 (figure 4).
There was no difference in the proportion of men (16.0 percent and 16.0 percent) or women (21.9 percent and 21.9 percent) purchasing at least one outpatient prescription analgesic when comparing the years 1996 and 2006.
When comparing the years 1996 and 2006 and the proportion of the population purchasing at least one outpatient prescription analgesic by race/ethnicity, there was an increase in the proportion of black non-Hispanics purchasing at least one analgesic, which increased from 16.5 percent to 19.1 percent (figure 5).
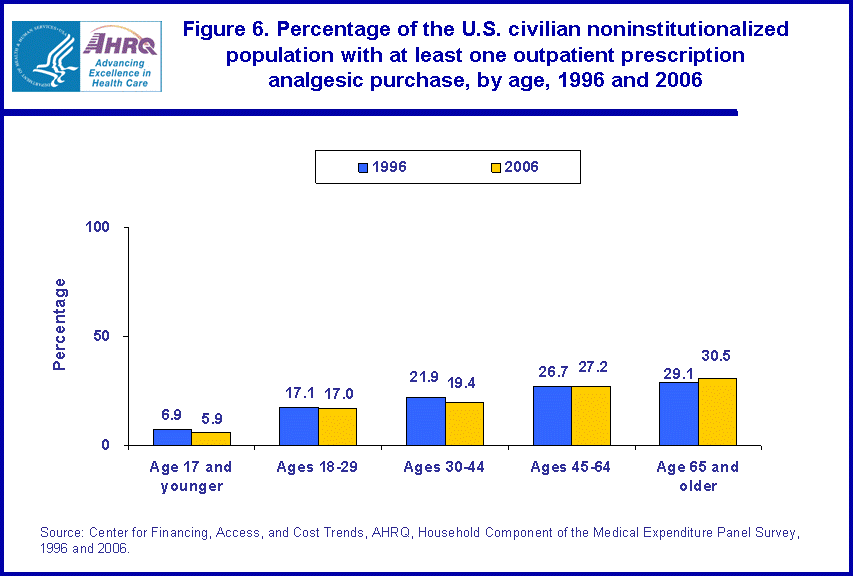
For the years 1996 and 2006, when comparing the proportion of the population purchasing at least one outpatient prescription analgesic by the following age categories: age 17 and younger, ages 18-29, ages 30-44, ages 45-64, and age 65 and older, there was a decrease in the proportion of those age 17 and younger purchasing an analgesic (6.9 percent and 5.9 percent, respectively) (figure 6).
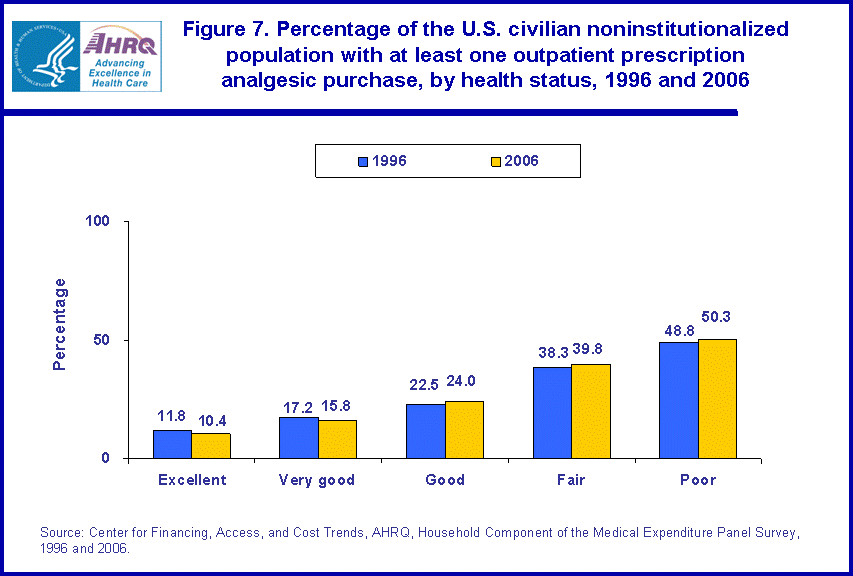
When comparing 1996 and 2006 and the proportion of the population purchasing at least one outpatient prescription analgesic by health status, there was a decrease of those in excellent health (11.8 percent and 10.4 percent, respectively) and very good health (17.2 percent and 15.8 percent, respectively) purchasing an analgesic and an increase of those in good health (22.5 percent and 24.0 percent, respectively) purchasing an analgesic (figure 7).
Data Source
The estimates shown in this Statistical Brief are drawn from analyses conducted by the MEPS staff from the following public use files: MEPS HC-105: 2006 Full Year Consolidated Data File and MEPS HC-102A: 2006 Prescribed Medicines File.
Definitions
Utilization and expenditures
Utilization was defined as one or more purchases of a prescribed medicine of interest. Refills as well as original prescriptions are included in expenditure and utilization estimates. Individuals were classified as using a prescribed medicine of interest if they had one or more purchases of the drug of interest during the year. Expenditures are in nominal dollars. If preferred, 1996 dollars can be inflated to 2006 dollars with the use of the GDP Price Index, National Income and Product Accounts, Bureau of Economic Analysis, available at http://www.bea.gov/national/nipaweb/SelectTable.asp?Selected=Y then select "Table 1.1.9 Implicit Price Deflators for Gross Domestic Product (A) (Q)", or use the CPI Index, All Urban Consumers, All Items, Bureau of Labor Statistics, available at http://data.bls.gov/cgi-bin/surveymost?cu.
Therapeutic classifications
Therapeutic class and subclass were assigned to MEPS prescribed medicines using Multum Lexicon variables from Cerner Multum, Inc. MEPS prescribed medicines files were linked to the Multum Lexicon database to obtain therapeutic class and subclass variables. For additional information on these and other Multum Lexicon variables, as well as the Multum Lexicon database itself, please refer to the following Web site: http://www.multum.com/Lexicon.htm.
Age
Age is the last available age for the sampled person. For most persons, this was their age at the end of the year.
Racial and ethnic classifications
Classification by race and ethnicity was based on information reported for each family member. Respondents were asked if each family member's race was best described as American Indian, Alaska Native, Asian or Pacific Islander, black, white, or other. They also were asked if each family member's main national origin or ancestry was Puerto Rican; Cuban; Mexican, Mexicano, Mexican American, or Chicano; other Latin American; or other Spanish. All persons whose main national origin or ancestry was reported in one of these Hispanic groups, regardless of racial background, were classified as Hispanic. Since the Hispanic grouping can include black Hispanic, white Hispanic, Asian and Pacific Islanders Hispanic, and other Hispanic, the race categories of black, white, Asian and Pacific Islanders, and other do not include Hispanic. Beginning in 2002, MEPS respondents were allowed to report multiple races, and these persons were included in the other non-Hispanic category. As a result, there was a slight increase in the percentage of persons classified in this category in 2002 compared with prior years.
Perceived health status
During each round of interviewing, the household respondent was asked to rate the health of each person in the family according to the following categories: excellent, very good, good, fair, or poor. Health status was missing for less than 1 percent of the U.S. civilian noninstitutionalized population.
About MEPS-HC
MEPS-HC is a nationally representative longitudinal survey that collects detailed information on health care utilization and expenditures, health insurance, and health status, as well as a wide variety of social, demographic, and economic characteristics for the U.S. civilian noninstitutionalized population. It is cosponsored by the Agency for Healthcare Research and Quality and the National Center for Health Statistics.
For more information about MEPS, call the MEPS information coordinator at AHRQ (301-427-1656) or visit the MEPS Web site at http://www.meps.ahrq.gov/.
References
For a detailed description of the MEPS-HC survey design, sample design, and methods used to minimize sources of nonsampling error, see the following publications:
Cohen, J. Design and Methods of the Medical Expenditure Panel Survey Household Component. MEPS Methodology Report No. 1. AHCPR Pub. No. 97-0026. Rockville, MD. Agency for Health Care Policy and Research, 1997. http://www.meps.ahrq.gov/mepsweb/data_files/publications/mr1/mr1.shtml
Cohen, S. Sample Design of the 1996 Medical Expenditure Panel Survey Household Component. MEPS Methodology Report No. 2. AHCPR Pub. No. 97-0027. Rockville, MD. Agency for Health Care Policy and Research, 1997. http://www.meps.ahrq.gov/mepsweb/data_files/publications/mr2/mr2.shtml
Cohen, S. Design Strategies and Innovations in the Medical Expenditure Panel Survey. Medical Care, July 2003: 41(7) Supplement: III-5-III-12.
Ezzati-Rice, TM, Rohde, F, Greenblatt, J, Sample Design of the Medical Expenditure Panel Survey Household Component, 1998-2007. Methodology Report No. 22. March 2008. Agency for Healthcare Research and Quality, Rockville, MD. http://www.meps.ahrq.gov/mepsweb/data_files/publications/mr22/mr22.pdf
Suggested Citation
Stagnitti, M. N. Trends in Outpatient Prescription Analgesics Utilization and Expenditures for the U.S. Civilian Noninstitutionalized Population, 1996 and 2006. Statistical Brief #235. February 2009. Agency for Healthcare Research and Quality. Rockville, MD. http://www.meps.ahrq.gov/mepsweb/data_files/publications/st235/stat235.pdf
AHRQ welcomes questions and comments from readers of this publication who are interested in obtaining more information about access, cost, use, financing, and quality of health care in the United States. We also invite you to tell us how you are using this Statistical Brief and other MEPS data and tools and to share suggestions on how MEPS products might be enhanced to further meet your needs. Please e-mail us at mepspd@ahrq.gov or send a letter to the address below:
Steven B. Cohen, PhD, Director
Center for Financing, Access, and Cost Trends
Agency for Healthcare Research and Quality
540 Gaither Road
Rockville, MD 20850
1 1996 dollars can be inflated to 2006 dollars using the GDP Price Index, National Income and Product Accounts, Bureau of Economic Analysis, available at http://www.bea.gov/national/nipaweb/SelectTable.asp?Selected=Y then select "Table 1.1.9 Implicit Price Deflators for Gross Domestic Product (A) (Q)", or use the CPI Index, All Urban Consumers, All Items, Bureau of Labor Statistics, available at http://data.bls.gov/cgi-bin/surveymost?cu.
 |
||||||||||||||||||||||||||||||
|
||||||||||||||||||||||||||||||
|
|
||||||||||||||||||||||||||||||
 |
||||||||||||||||||||||||||||||
|
||||||||||||||||||||||||||||||
|
|
||||||||||||||||||||||||||||||
 |
||||||||||||||||||||||||||||||
|
||||||||||||||||||||||||||||||
|
|
||||||||||||||||||||||||||||||
 |
||||||||||||||||||||||||||||||
|
||||||||||||||||||||||||||||||
|
|
||||||||||||||||||||||||||||||
 |
||||||||||||||||||||||||||||||
|
||||||||||||||||||||||||||||||
|
|
||||||||||||||||||||||||||||||
 |
||||||||||||||||||||||||||||||
|
||||||||||||||||||||||||||||||
|
|
||||||||||||||||||||||||||||||
 |
||||||||||||||||||||||||||||||
|
||||||||||||||||||||||||||||||
|
|
||||||||||||||||||||||||||||||


