|
|
Font Size:
|
||||
|
|
|
|
||||
STATISTICAL BRIEF #292:
Trends in Select Reported Chronic Conditions for Persons under Age 40 in the U.S. Civilian Noninstitutionalized Population, 1997 and 2007
Highlights
- When comparing 1997 to 2007, for persons age 39 and younger, the proportions of persons reporting diabetes, hyperlipidemia, hypertension, and asthma all increased.
- When comparing 1997 to 2007, among those age 39 and younger, the number of medical events reported by those with hyperlipidemia increased five-fold from 0.9 million to 4.5 million medical events.
- From 1997 to 2007, total expenditures for those under age 40 reporting hyperlipidemia increased from $0.1 billion to $1.0 billion.
- When comparing the years 1997 and 2007, for those under age 40, total expenditures for those reporting hypertension increased from $0.9 billion to $1.6 billion.
Introduction
This Statistical Brief presents trends in utilization and expenditures for persons under age 40 reporting the following chronic conditions: diabetes, hyperlipidemia (high cholesterol), hypertension, heart disease, and asthma for the years 1997 and 2007. The estimates are for the U.S. civilian noninstitutionalized population and are derived from the 1997 and 2007 Household Component of the Medical Expenditure Panel Survey (MEPS-HC).
With the costs of medical care continuing to increase and representing larger portions of the Gross Domestic Product (GDP), utilization and expenditures for those with chronic medical conditions are of great interest to policymakers as well as to the U.S. public. Examining data collected in 1997 and 2007 for persons under the age of 40 with chronic conditions provides valuable insight into the spending and utilization patterns for a key subgroup with chronic medical conditions. Expenditures in this Brief are presented in real dollars; estimates for 1997 were adjusted to 2007 dollars based on the GDP Price Index (http://www.meps.ahrq.gov/mepsweb/about_meps/Price_Index.shtml).
All differences discussed in the text are statistically significant at the 0.05 level.
Findings
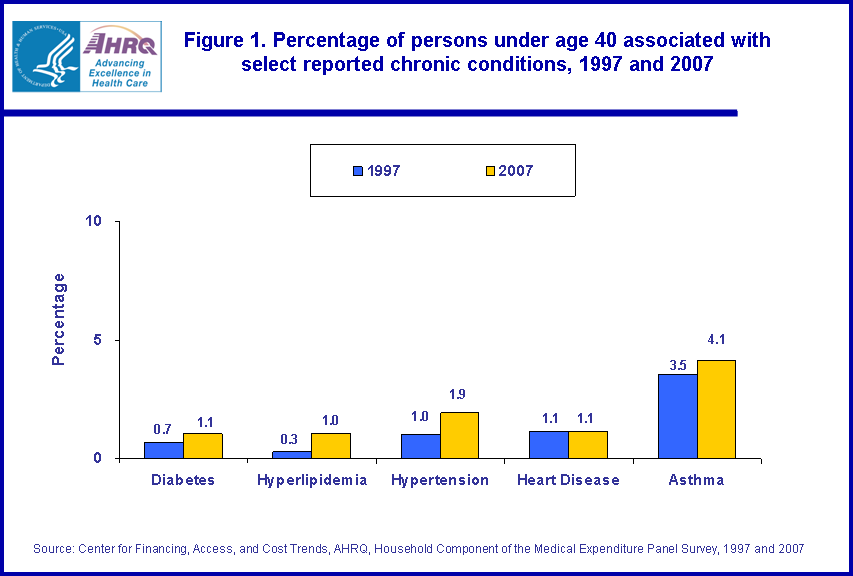
In 1997, there were 271.3 million persons in the U.S. noninstitutionalized civilian population and 158.6 million were age 39 and younger. Of those age 39 and younger, the proportion reporting diabetes was 0.7 percent, the proportion reporting hyperlipidemia was 0.3 percent, the proportion reporting hypertension was 1.0 percent, the proportion reporting heart disease was 1.1 percent, and the proportion reporting asthma was 3.5 percent. In 2007, the total number of persons age 39 and younger was 164.2 million people and the proportion of persons age 39 and younger reporting diabetes increased to 1.1 percent, the proportion of those reporting hyperlipidemia increased to 1.0 percent, the proportion reporting hypertension increased to 1.9 percent, and the proportion reporting asthma increased to 4.1 percent. The proportion of people age 39 and younger reporting heart disease did not change significantly when comparing 1997 with 2007 (1.1 percent in both years) (figure 1).
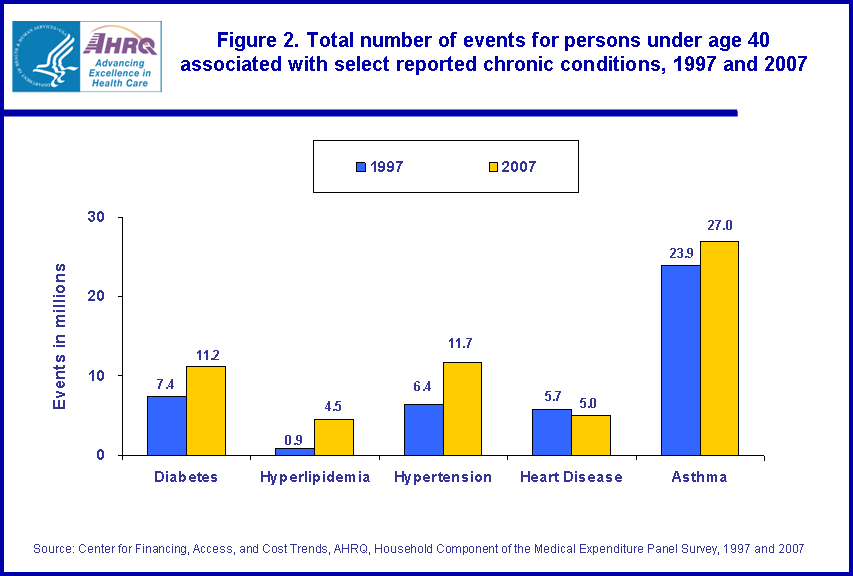
The number of medical events for those under age 40 reporting diabetes totaled 7.4 million in 1997; by 2007 that number had increased to 11.2 million. For those under age 40 reporting hypertension, the number of medical events increased from 6.4 million in 1997 to 11.7 million in 2007. Moreover, the total number of medical events increased five-fold, from 1997 to 2007, for those reporting hyperlipidemia (rising from 0.9 million events to 4.5 million events). The total number of medical events reported by those under age 40 reporting heart disease and asthma did not change significantly from 1997 to 2007 (figure 2).
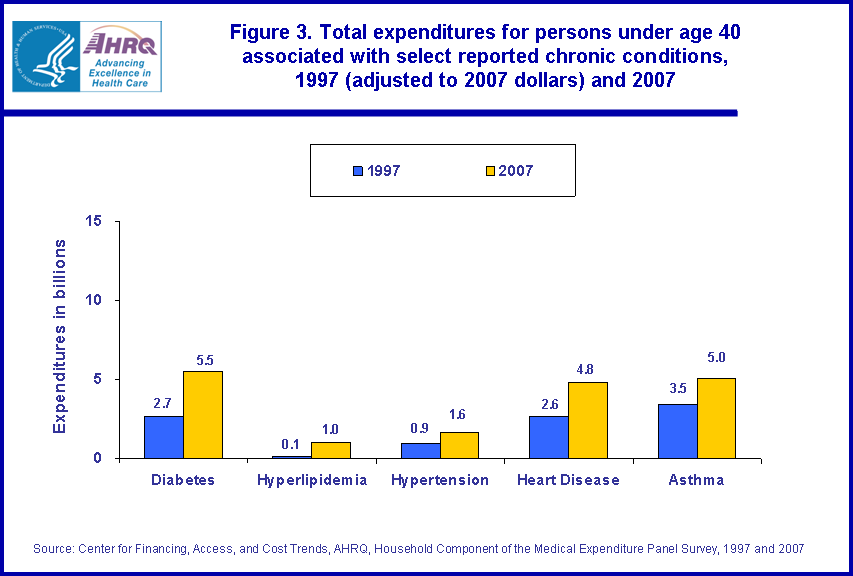
When comparing estimates for 1997 and 2007, among those age 39 and younger reporting hyperlipidemia, total expenditures increased ten-fold from $0.1 billion to $1.0 billion. Furthermore, for those age 39 and younger, total expenditures for those reporting hypertension increased from $0.9 billion to $1.6 billion, and total expenditures for those reporting asthma increased from $3.5 billion to $5.0 billion. Total medical expenditures for those under age 40 reporting diabetes and for those reporting heart disease did not change significantly from 1997 to 2007 (figure 3).
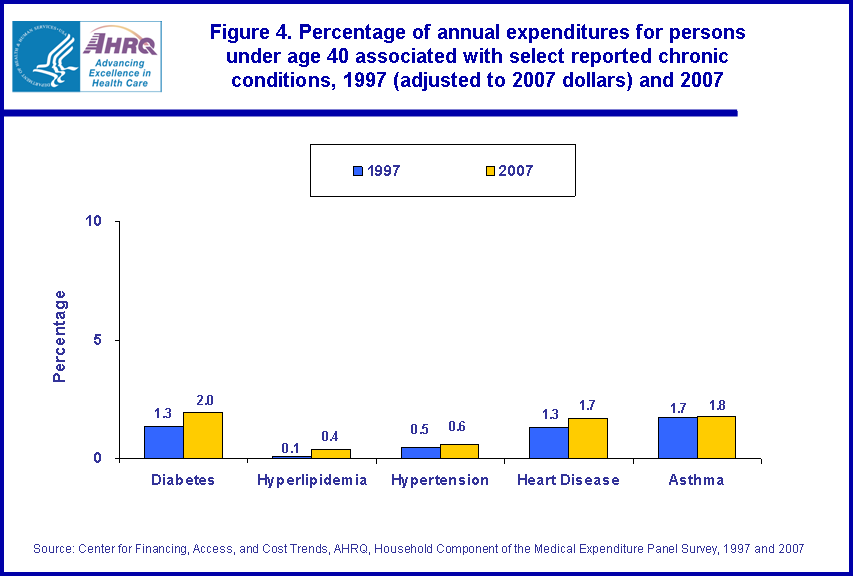
When comparing estimates for 1997 and 2007, the proportion of annual expenditures for persons age 39 and younger increased for those reporting hyperlipidemia (rising from 0.1 percent to 0.4 percent), but did not change significantly for those reporting diabetes (1.3 percent to 2.0 percent), hypertension (0.5 percent to 0.6 percent), heart disease (1.3 percent to 1.7 percent), or asthma (1.7 percent to 1.8 percent) (figure 4).
Data Source
The estimates shown in this Statistical Brief are based on data from MEPS HC-020: 1997 Full Year Consolidated Data File, MEPS HC-018: 1997 Medical Conditions File, MEPS HC-113: 2007 Full Year Consolidated Data File, and MEPS HC-112: 2007 Medical Conditions File.
Definitions/Methodology
Age
Age is the last available age for the sampled person. For most persons, this was their age at the end of the year.
Medical conditions
Condition data were collected from household respondents during each round as verbatim text and coded by professional coders using the International Classification of Diseases, Ninth Revision (ICD-9). ICD-9-CM condition codes were then aggregated into clinically meaningful categories that group similar conditions using the Clinical Classification System (CCS) software. Categories were collapsed when appropriate. Note that the reported ICD-9-CM condition code values were mapped to the appropriate clinical classification category prior to being collapsed to 3-digit ICD-9-CM condition codes. The result is that every record which has an ICD-9-CM diagnosis code also has a clinical classification code. For this Statistical Brief, the following CCS codes were used: Diabetes Mellitus (CCS=49, 50); Hyperlipidemia (CCS=53); Hypertension (CCS=98, 99); Heart conditions (CCS=96, 97, 100-108); and Asthma (CCS=128).
There were substantial conditions-related design changes made to the MEPS-HC instrument for 2007 data that were not implemented for preceding years of data. Starting with 2007 data, a new section, Priority Conditions Enumeration (PE), was added. The PE section asks a series of questions regarding whether the person has ever been diagnosed with a specified priority condition (e.g., diabetes). If the answer is yes, the computer-assisted personnel interviewing (CAPI) system automatically creates a condition record that is flagged as a priority condition (PRIOLIST=1). Respondents may also report medical conditions in the Condition Enumeration (CE), medical events, and Disability Days (DD) section. For data before 2007, the interviewer manually identified whether a condition collected in the CE, events, or DD sections was a priority condition based on a list provided in the help text. In addition to changing the method of assigning priority condition status from manual to automated, the list of priority conditions changed in 2007. Please see Appendix 4 for the 1997 and 2007 MEPS Medical Conditions File for details.
Expenditures
Expenditures refer to what is paid for health care services. More specifically, expenditures in MEPS are defined as the sum of direct payments for care provided during the year, including out-of-pocket payments and payments by private insurance, Medicaid, Medicare, and other sources. Payments for over-the-counter drugs are not included in MEPS total expenditures. Indirect payments not related to specific medical events, such as Medicaid Disproportionate Share and Medicare Direct Graduate Medical Education subsidies, are also excluded.
Expenditures may be associated with more than one condition and are not unduplicated in the condition totals; summing over conditions would double-count some expenses. Total spending does not include amounts for other medical expenses, such as durable and nondurable supplies, medical equipment, eyeglasses, ambulance services, and dental expenses, because these items could not be linked to specific conditions.
Expenditures are expressed in real dollars; estimates for 1997 were adjusted to 2007 dollars based on the GDP Implicit Price Deflator (http://www.meps.ahrq.gov/mepsweb/about_meps/Price_Index.shtml).
About MEPS-HC
MEPS-HC is a nationally representative longitudinal survey that collects detailed information on health care utilization and expenditures, health insurance, and health status, as well as a wide variety of social, demographic, and economic characteristics for the U.S. civilian noninstitutionalized population. It is cosponsored by the Agency for Healthcare Research and Quality and the National Center for Health Statistics.
For more information about MEPS, call the MEPS information coordinator at AHRQ (301) 427-1656 or visit the MEPS Web site at http://www.meps.ahrq.gov/.
References
For a detailed description of the MEPS-HC survey design, sample design, and methods used to minimize sources of nonsampling error, see the following publications:
Cohen, J. Design and Methods of the Medical Expenditure Panel Survey Household Component. MEPS Methodology Report No. 1. AHCPR Pub. No. 97-0026. Rockville, MD. Agency for Health Care Policy and Research, 1997. http://www.meps.ahrq.gov/mepsweb/data_files/publications/mr1/mr1.shtml
Cohen, S. Sample Design of the 1996 Medical Expenditure Panel Survey Household Component. MEPS Methodology Report No. 2. AHCPR Pub. No. 97-0027. Rockville, MD. Agency for Health Care Policy and Research, 1997. http://www.meps.ahrq.gov/mepsweb/data_files/publications/mr2/mr2.shtml
Cohen, S. Design Strategies and Innovations in the Medical Expenditure Panel Survey. Medical Care, July 2003: 41(7) Supplement: III-5-III-12.
Ezzati-Rice, T.M., Rohde, F., Greenblatt, J., Sample Design of the Medical Expenditure Panel Survey Household Component, 1998-2007. Methodology Report No. 22. March 2008. Agency for Healthcare Research and Quality, Rockville, MD. http://www.meps.ahrq.gov/mepsweb/data_files/publications/mr22/mr22.shtml
Suggested Citation
Stagnitti, M.N. Trends in Select Reported Chronic Conditions for Persons Under Age 40 in the U.S. Civilian Noninstitutionalized Population, 1997 and 2007. Statistical Brief #292. August 2010. Agency for Healthcare Research and Quality, Rockville, MD. http://www.meps.ahrq.gov/mepsweb/data_files/publications/st292/stat292.shtml
AHRQ welcomes questions and comments from readers of this publication who are interested in obtaining more information about access, cost, use, financing, and quality of health care in the United States. We also invite you to tell us how you are using this Statistical Brief and other MEPS data and tools and to share suggestions on how MEPS products might be enhanced to further meet your needs. Please e-mail us at mepspd@ahrq.gov or send a letter to the address below:
Steven B. Cohen, PhD, Director
Center for Financing, Access, and Cost Trends
Agency for Healthcare Research and Quality
540 Gaither Road
Rockville, MD 20850
 |
||||||||||||||||||||||||||||||
|
||||||||||||||||||||||||||||||
|
|
||||||||||||||||||||||||||||||
 |
||||||||||||||||||||||||||||||
|
||||||||||||||||||||||||||||||
|
|
||||||||||||||||||||||||||||||
 |
||||||||||||||||||||||||||||||
|
||||||||||||||||||||||||||||||
|
|
||||||||||||||||||||||||||||||
 |
||||||||||||||||||||||||||||||
|
||||||||||||||||||||||||||||||
|
|
||||||||||||||||||||||||||||||


