
|
|
|
Font Size:
|
||||
|
|
|
|
||||
STATISTICAL BRIEF #302:
Employer-Sponsored Health Insurance for Employees of State and Local Governments, by Census Division, 2009
Highlights
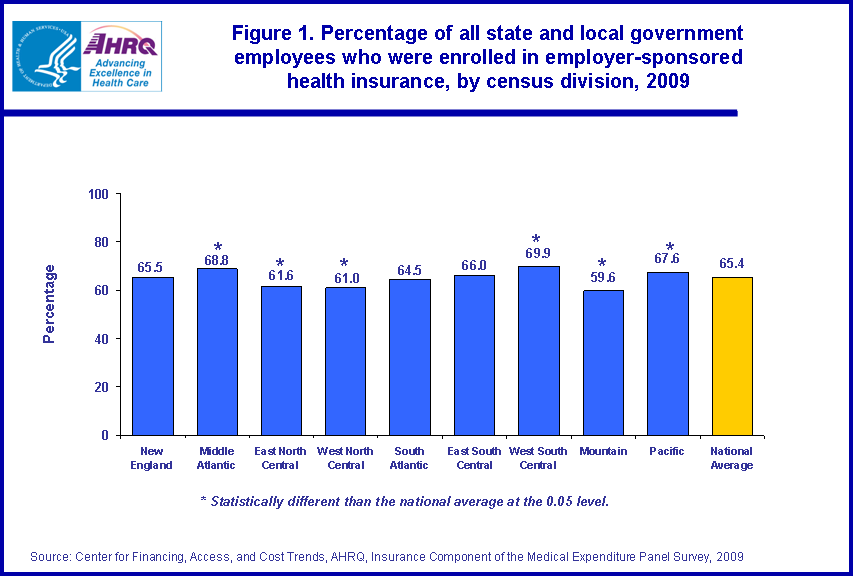
- In 2009, 65.4 percent of employees of state and local governments were enrolled in employer-sponsored health insurance. By census division, enrollment rates ranged from 59.6 percent to 69.9 percent.
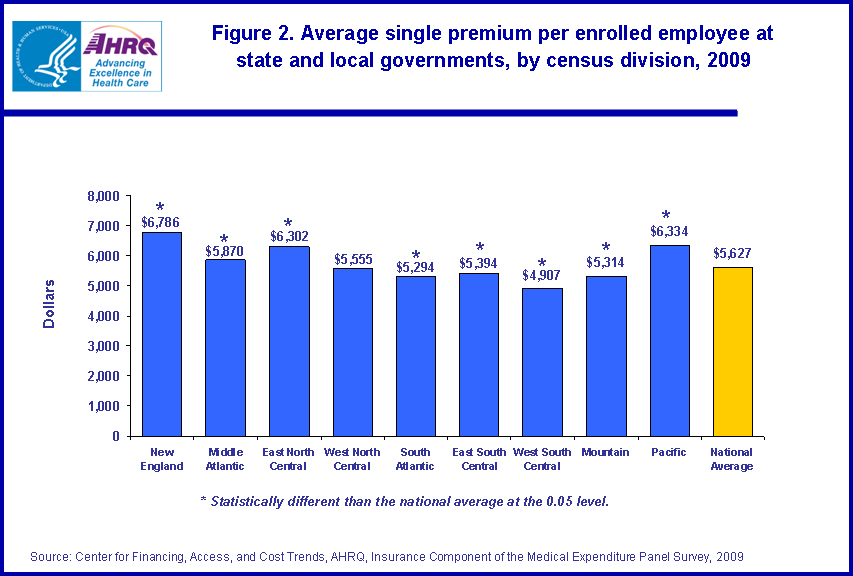
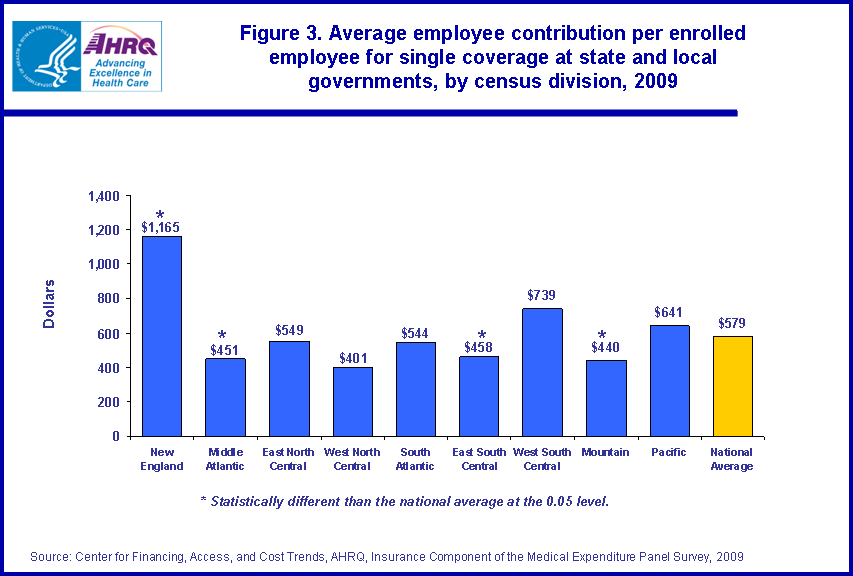
- In 2009, the average premium for single coverage for state and local government enrolled employees was $5,627. The average employee premium contribution per enrollee for single coverage was $579 in 2009. Single premiums and contributions by census division frequently varied from the U.S. average.
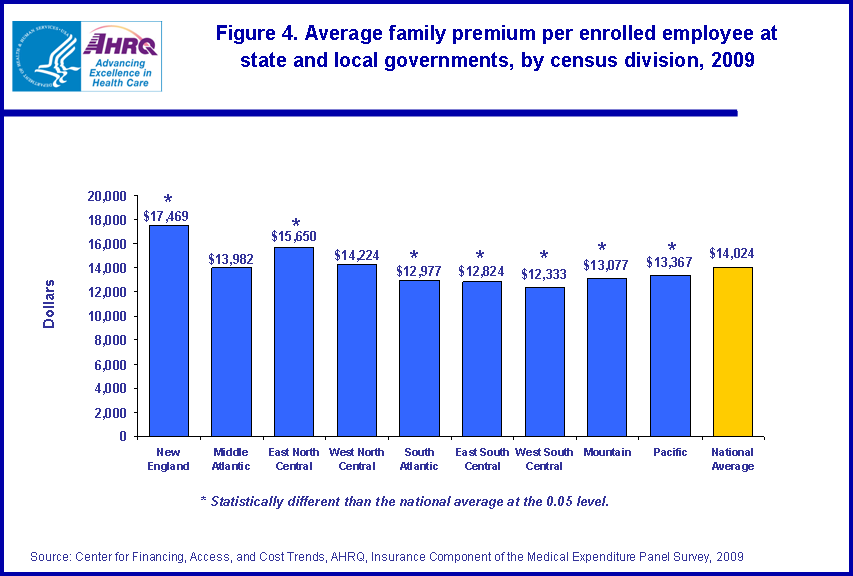
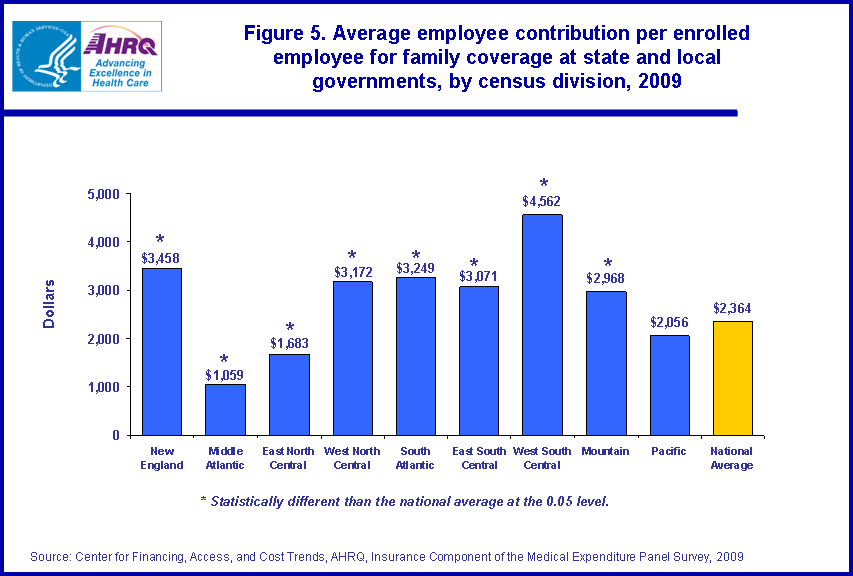
- The average premium for employer-sponsored health insurance per enrolled employee for family coverage across state and local government employers was $14,024. In 2009, the average employee contribution towards premiums per enrollee in family coverage was $2,364. As with single coverage, family premiums and contributions by census division frequently were different from the U.S. average.
Introduction
Employees of state and local governments were much more likely to be enrolled in employer-sponsored health insurance than their private sector counterparts in 2009. According to data from the Insurance Component of the Medical Expenditure Panel Survey (MEPS-IC), 65.4 percent of state and local government employees were enrolled in employer-sponsored health insurance plans compared to 53.6 percent of private sector employees. State and local government employees were also more likely to work where health insurance is offered than were private employees. Of the 19.6 million state and local government employees in 2009, 75.5 percent were eligible to enroll in employer-sponsored health insurance coverage compared to 69.6 percent of the 110.5 million private sector employees.This Statistical Brief focuses on state and local government enrollment rates, premiums, and employee contributions for employer-sponsored health insurance by census geographic division. These health insurance characteristics varied significantly across the United States for state and local government employees.
Only those estimates that had a statistically significant difference from the national average at the 0.05 percent significance level are noted in the text.
Findings
The percentage of all state and local government employees enrolled in employer-sponsored health insurance in 2009 was 65.4 percent (figure 1). The enrollment rate in several census divisions differed from the national average. The Mountain (59.6 percent), West North Central (61.0 percent), and East North Central (61.6 percent) census divisions had enrollment rates lower than the national average. The West South Central (69.9 percent), Middle Atlantic (68.8 percent), and Pacific (67.6 percent) census divisions had enrollment percentages higher than the national average.In 2009, the single premium per enrolled employee for employer-sponsored health insurance provided through state and local governments was $5,627 (figure 2). The governments in the New England, Pacific, East North Central, and Middle Atlantic census divisions had average single premiums of $6,786, $6,334, $6,302, and $5,870, respectively--all above the national average. The governments in the West South Central ($4,907), South Atlantic ($5,294), Mountain ($5,314), and East South Central ($5,394) census divisions had lower than average single premiums.
Employees enrolled in family coverage through state and local government jobs had an average premium of $14,024 (figure 4). In both the New England ($17,469) and the East North Central ($15,650) census divisions, the family premium was significantly higher than the national average for 2009. The Middle Atlantic ($13,982) and West North Central ($14,224) census division premiums did not differ from the average. The remaining census divisions, such as West South Central ($12,333), all had below-average premiums.
In 2009, the average contribution towards family coverage per enrollee in employer-sponsored health insurance provided by state and local governments was $2,364 (figure 5). Only the Pacific census division's family contribution--$2,056--did not differ from the national average. The Middle Atlantic ($1,059) and East North Central ($1,683) census divisions had below average contribution amounts. The rest of the census divisions had above average contribution amounts, including West South Central at $4,562.
Data Source
This Statistical Brief summarizes data from the 2009 MEPS-IC. The data are available on the MEPS Web site at http://www.meps.ahrq.gov/mepsweb/survey_comp/Insurance.jsp or have been produced using special computation runs on the confidential MEPS-IC data available at the U.S. Census Bureau.Definitions
States were grouped into nine census divisions as follows:- New England: Connecticut, Maine, Massachusetts, New Hampshire, Rhode Island, Vermont
- Middle Atlantic: New Jersey, New York, Pennsylvania
- East North Central: Illinois, Indiana, Michigan, Ohio, Wisconsin
- West North Central: Iowa, Kansas, Minnesota, Missouri, Nebraska, North Dakota, South Dakota
- South Atlantic: Delaware, District of Columbia, Florida, Georgia, Maryland, North Carolina, South Carolina, Virginia, West Virginia
- East South Central: Alabama, Kentucky, Mississippi, Tennessee
- West South Central: Arkansas, Louisiana, Oklahoma, Texas
- Mountain: Arizona, Colorado, Idaho, Montana, Nevada, New Mexico, Utah, Wyoming
- Pacific: Alaska, California, Hawaii, Oregon, Washington
About MEPS-IC
The MEPS-IC is a survey of business establishments and state and local governments that collects information on employer-sponsored health insurance, such as whether insurance is offered, enrollments, types of plans, and premiums. The survey is conducted annually by the U.S. Census Bureau under the sponsorship of the Agency for Healthcare Research and Quality (AHRQ). For state and local governments, the annual average response rate is over 90 percent. In 2009, 3,000 government sample units were selected for the survey. For more information on this survey, see MEPS Methodology Reports 6, 8, 10, 14, 17, and 18 on the MEPS Web site at http://www.meps.ahrq.gov/mepsweb/data_stats/publications.jsp and Insurance Component Survey Basics at http://www.meps.ahrq.gov/mepsweb/survey_comp/Insurance.jsp.Suggested Citation
Crimmel, B.L. Employer-Sponsored Health Insurance for Employees of State and Local Governments, by Census Division, 2009. Statistical Brief #302. December 2010. Agency for Healthcare Research and Quality, Rockville, MD. http://www.meps.ahrq.gov/mepsweb/data_files/publications/st302/stat302.shtmlAHRQ welcomes questions and comments from readers of this publication who are interested in obtaining more information about access, cost, use, financing, and quality of health care in the United States. We also invite you to tell us how you are using this Statistical Brief and other MEPS data and tools and to share suggestions on how MEPS products might be enhanced to further meet your needs. Please e-mail us at mepspd@ahrq.gov or send a letter to the address below:
Steven B. Cohen, PhD, Director
Center for Financing, Access, and Cost Trends
Agency for Healthcare Research and Quality
540 Gaither Road
Rockville, MD 20850
 |
||||||||||||||||||||||||||||||||||||||||||
|
||||||||||||||||||||||||||||||||||||||||||
|
|
||||||||||||||||||||||||||||||||||||||||||
 |
||||||||||||||||||||||||||||||||||||||||||
|
||||||||||||||||||||||||||||||||||||||||||
|
|
||||||||||||||||||||||||||||||||||||||||||
 |
||||||||||||||||||||||||||||||||||||||||||
|
||||||||||||||||||||||||||||||||||||||||||
|
|
||||||||||||||||||||||||||||||||||||||||||
 |
||||||||||||||||||||||||||||||||||||||||||
|
||||||||||||||||||||||||||||||||||||||||||
|
|
||||||||||||||||||||||||||||||||||||||||||
 |
||||||||||||||||||||||||||||||||||||||||||
|
||||||||||||||||||||||||||||||||||||||||||
|
|
||||||||||||||||||||||||||||||||||||||||||