
|
|
|
Font Size:
|
||||
|
|
|
|
||||
STATISTICAL BRIEF #311:
Enrollment in High Premium Employer-Sponsored Health Insurance by State: Private Industry, 2009
Highlights
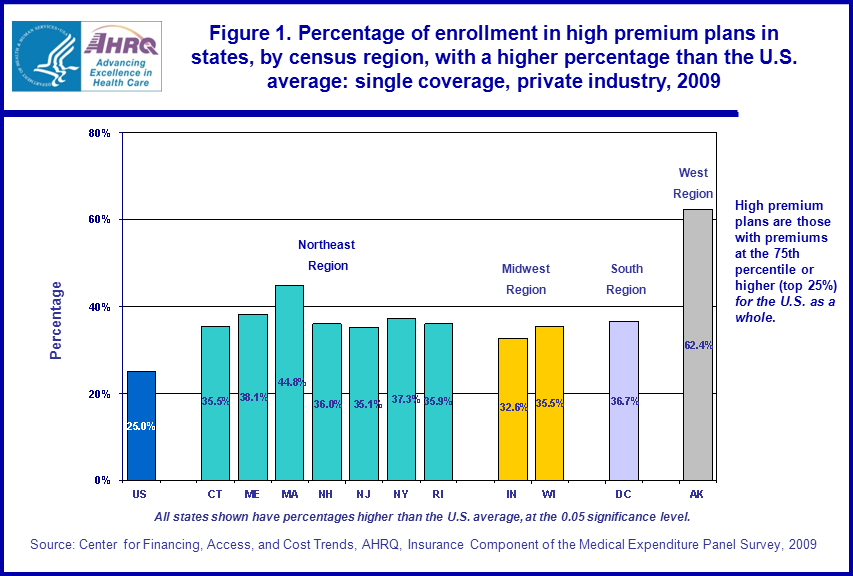
- In 2009, 10 states and the District of Columbia had a higher percentage of enrollees in single coverage employer-sponsored health insurance plans with high premiums, greater than or equal to $5,500 annually, than the 25 percent U.S. average. Seven of the 10 states were located in the Northeast region.
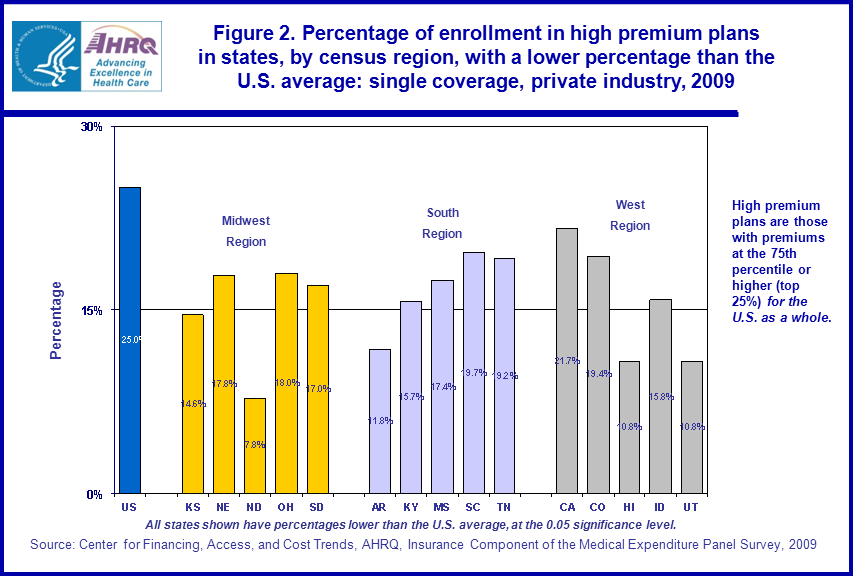
- In 2009, 15 states had less than 25 percent of enrollees in single coverage plans with premiums greater than or equal to $5,500. Of these 15, five each were located in the Midwest, South, and West regions. None of these states were located in the Northeast region.
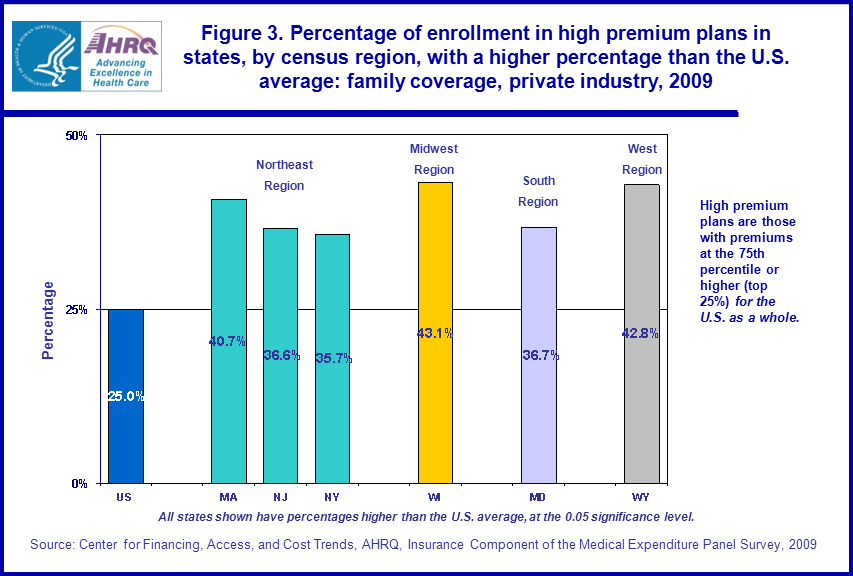
- For employer-sponsored family coverage in 2009, six states had a greater percentage of enrollees than the national average of 25 percent in plans with high premiums, greater than or equal to $15,000 per year. Three of these states were located in the Northeast region and one each was located in the remaining regions.
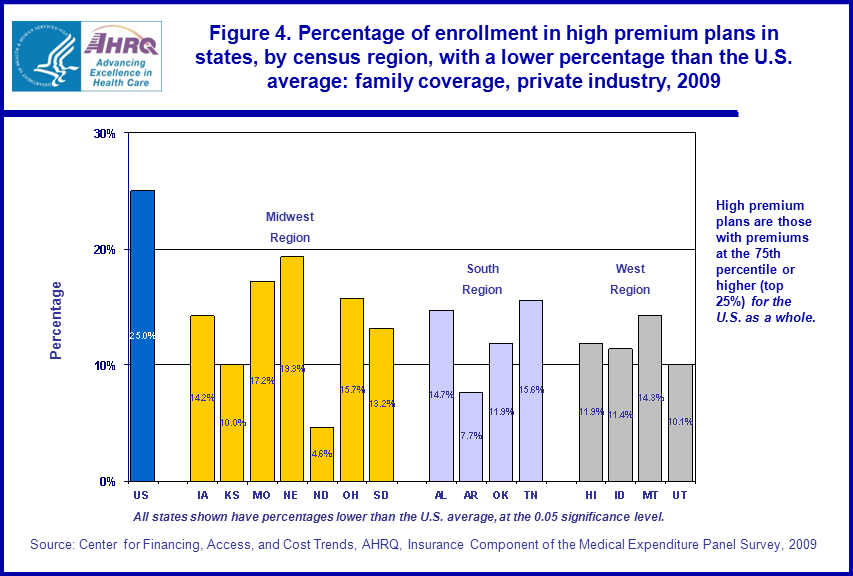
- Fifteen states had a lower percentage of enrollees in high-premium (greater than or equal to $15,000) family coverage than the national average of 25 percent. Seven of these states were located in the Midwest region, with four states each in the South and West regions. As was found with single coverage, no state in the Northeast had a percentage of high-premium enrollees in employer-sponsored family coverage lower than 25 percent.
Introduction
This Statistical Brief reports estimates by state on the percentage of private sector employees enrolled in employer-sponsored health insurance plans with high premiums, which are defined as those with annual premiums greater than or equal to $5,500 for single coverage plans, and greater than or equal to $15,000 for family coverage plans. According to 2009 data from the Medical Expenditure Panel Survey-Insurance Component (MEPS-IC), these values represent the 75th percentile of private employer-sponsored health insurance premiums for single coverage and family coverage plans in private industry. That is, of all enrollees within each coverage type, 25 percent had premiums at or above these amounts.This analysis discusses results by state--classified by census region (Northeast, Midwest, South, and West)--as to the percentage of enrollees in single and family coverage that have premiums at or above the national 75th percentile figures. In addition to location, other factors that can effect premiums include benefit packages that are more or less generous (through the absence or presence of deductibles and co-pays, for example), employer characteristics (such as firm size and industry), and demographic factors (such as age of enrollees).
All estimates discussed in the text are significantly different from the overall 75th percentile estimates at the 0.05 level unless otherwise noted.
Findings
Figure 1 shows all states that had a higher percentage of enrollees than the U.S. average with a high premium (greater than or equal to $5,500) for employer-sponsored single coverage; that is, higher than 25 percent for the private sector in 2009. The percentages ranged from 62.4 percent for Alaska to 32.6 percent for Indiana. Of the 10 states included, seven were located in the Northeast region of the United States. These seven include Connecticut (35.5 percent), Maine (38.1 percent), Massachusetts (44.8 percent), New Hampshire (36.0 percent), New Jersey (35.1 percent), New York (37.3 percent), and Rhode Island (35.9 percent). Others shown include the District of Columbia and Wisconsin which had 36.7 percent and 35.5 percent, respectively, of single-coverage enrollees with a premium of greater than or equal to $5,500.In figure 2, states with a lower percentage than the U.S. average of 25 percent of enrollees in employer-sponsored single coverage that had a premium of greater than or equal to $5,500 are listed. The percentages ranged from 21.7 percent for California to 7.8 percent for North Dakota in 2009. Of the 15 states listed, none were located in the Northeast region. They were split evenly between the three other regions.
In the Midwest, the states with less than 25 percent of single-coverage enrollees with high premiums were Kansas (14.6 percent), Nebraska (17.8 percent), North Dakota (7.8 percent), Ohio (18.0 percent), and South Dakota (17.0 percent). The five states in the South region that had percentages less than the U.S. average were Arkansas (11.8 percent), Kentucky (15.7 percent), Mississippi (17.4 percent), South Carolina (19.7 percent), and Tennessee (19.2 percent). California (21.7 percent), Colorado (19.4 percent), Hawaii (10.8 percent), Idaho (15.8 percent), and Utah (10.8 percent) were the states in the West in 2009.
Figure 3 shows the states in 2009 with a greater percentage of private sector enrollees than the U.S. average of 25 percent in private sector employer-sponsored health plans with high annual family premiums, greater than or equal to the 75th percentile of the U.S. average, or $15,000. Of the six listed states, three were located in the Northeast region, Massachusetts (40.7 percent), New Jersey (36.6 percent), and New York (35.7 percent). One state each was located in the Midwest region (Wisconsin; 43.1 percent), the South region (Maryland; 36.7 percent), and the West region (Wyoming; 42.8 percent).
Figure 4 reveals the 15 states in 2009 with lower percentages than average of private sector enrollees in family health plans with annual premiums at or in excess of $15,000. As was found with single premiums, no state from the Northeast region was found to have a smaller percentage of high-premium enrollees than 25 percent. Seven of the states with smaller percentages of enrollees than the U.S. average were located in the Midwest region, Iowa (14.2 percent), Kansas (10.0 percent), Missouri (17.2 percent), Nebraska (19.3 percent), North Dakota (4.6 percent), Ohio (15.7 percent), and South Dakota (13.2 percent). Four of the states were located in the South region--Alabama (14.7 percent), Arkansas (7.7 percent), Oklahoma (11.9 percent), and Tennessee (15.6 percent). The West region also claimed four states with a lower percentage than the U.S. average of 25 percent for employer-sponsored family coverage, Hawaii (11.9 percent), Idaho (11.4 percent), Montana (14.3 percent), and Utah (10.1 percent).
As mentioned with regard to single coverage in figures 1 and 2, any state not shown in either figure 3 or figure 4 had a percentage of family-coverage enrollees with premiums of greater than or equal to $15,000 that did not differ from the U.S. average of 25 percent.
Data Source
This Statistical Brief summarizes data from the 2009 MEPS-IC. The data are available on the MEPS Web site at http://www.meps.ahrq.gov/mepsweb/survey_comp/Insurance.jsp or have been produced using special computation runs on the confidential MEPS-IC data available at the U.S. Census Bureau.Definitions
Health insurance planAn insurance contract that provides hospital and/or physician coverage to an employee for an agreed-upon fee (premium) for a defined benefit period.
Premium
Agreed-upon fee paid for coverage of medical benefits for a defined benefit period, usually a calendar year. Premiums can vary based on a variety of factors, such as services covered, amounts of deductibles and co-pays, location of firm, and demographics of the workforce.
Single coverage
Health insurance that covers the employee only.
Family coverage
Health insurance that covers the employee and the employee's family. If a plan offered more than one pricing level for family coverage, information for a family of four was reported.
State abbreviations
State Postal Abbreviation
- Alabama,AL
- Alaska,AK
- Arizona,AZ
- Arkansas,AR
- California,CA
- Colorado,CO
- Connecticut,CT
- Delaware,DE
- Florida,FL
- Georgia,GA
- Hawaii,HI
- Idaho,ID
- Illinois,IL
- Indiana,IN
- Iowa,IA
- Kansas,KS
- Kentucky,KY
- Louisiana,LA
- Maine,ME
- Maryland,MD
- Massachusetts,MA
- Michigan,MI
- Minnesota,MN
- Mississippi,MS
- Missouri,MO
- Montana,MT
- Nebraska,NE
- Nevada,NV
- New Hampshire,NH
- New Jersey,NJ
- New Mexico,NM
- New York,NY
- North Carolina,NC
- North Dakota,ND
- Ohio,OH
- Oklahoma,OK
- Oregon,OR
- Pennsylvania,PA
- Rhode Island,RI
- South Carolina,SC
- South Dakota,SD
- Tennessee,TN
- Texas,TX
- Utah,UT
- Vermont,VT
- Virginia,VA
- Washington,WA
- West Virginia,WV
- Wisconsin,WI
- Wyoming,WY
The U.S. Department of Commerce, Bureau of the Census groups states into four regions and nine divisions:
Northeast Region
- New England Division: Connecticut, Maine, Massachusetts, New Hampshire, Rhode Island, and Vermont
- Middle Atlantic Division: New Jersey, New York, and Pennsylvania
- East North Central Division: Illinois, Indiana, Michigan, Ohio, and Wisconsin
- West North Central Division: Iowa, Kansas, Minnesota, Missouri, Nebraska, North Dakota, and South Dakota
- South Atlantic Division: Delaware, District of Columbia, Florida, Georgia, Maryland, North Carolina, South Carolina, Virginia, and West Virginia
- East South Central Division: Alabama, Kentucky, Mississippi, and Tennessee
- West South Central Division: Arkansas, Louisiana, Oklahoma, and Texas
- Mountain Division: Arizona, Colorado, Idaho, Montana, Nevada, New Mexico, Utah, and Wyoming
- Pacific Division: Alaska, California, Hawaii, Oregon, and Washington
About MEPS-IC
MEPS-IC is a survey of business establishments and governments that collects information on employer-sponsored health insurance, such as whether insurance is offered, enrollments, types of plans, and premiums. The survey is conducted annually by the U.S. Census Bureau under the sponsorship of the Agency for Healthcare Research and Quality. The yearly response rate has averaged 78 percent for in-scope sample units. Approximately 4 percent of the original sample has been out-of-scope in a typical year. A total sample of 42,000 private sector establishments was selected for the 2009 survey, prior to accounting for losses due to nonresponse and out-of-scope cases.For more information on this survey, see MEPS Methodology Reports 6, 8, 10, 14, 17, and 18 on the MEPS Web site at http://www.meps.ahrq.gov/mepsweb/data_stats/publications.jsp and Insurance Component Survey Basics at http://www.meps.ahrq.gov/mepsweb/survey_comp/Insurance.jsp.
Suggested Citation
Crimmel, B.L., and Cooper, P.F. Enrollment in High Premium Employer-Sponsored Health Insurance by State: Private Industry, 2009. Statistical Brief #311. Agency for Healthcare Research and Quality, Rockville, MD. http://www.meps.ahrq.gov/mepsweb/data_files/publications/st311/stat311.shtmlAHRQ welcomes questions and comments from readers of this publication who are interested in obtaining more information about access, cost, use, financing, and quality of health care in the United States. We also invite you to tell us how you are using this Statistical Brief and other MEPS data and tools and to share suggestions on how MEPS products might be enhanced to further meet your needs. Please e-mail us at mepspd@ahrq.gov or send a letter to the address below:
Steven B. Cohen, PhD, Director
Center for Financing, Access, and Cost Trends
Agency for Healthcare Research and Quality
540 Gaither Road
Rockville, MD 20850
 |
|||||||||||||||||||||||||||||||||||||||||||||||||||||||||||||||||||||||||||||||||||||||||||||||||||||||||||||||||||||||
|
|||||||||||||||||||||||||||||||||||||||||||||||||||||||||||||||||||||||||||||||||||||||||||||||||||||||||||||||||||||||
|
|
|||||||||||||||||||||||||||||||||||||||||||||||||||||||||||||||||||||||||||||||||||||||||||||||||||||||||||||||||||||||