
|
|
|
Font Size:
|
||||
|
|
|
|
||||
STATISTICAL BRIEF #322:
Employer-Sponsored Health Insurance for Large Employers in the Private Sector, by Industry Classification, 2009
Highlights
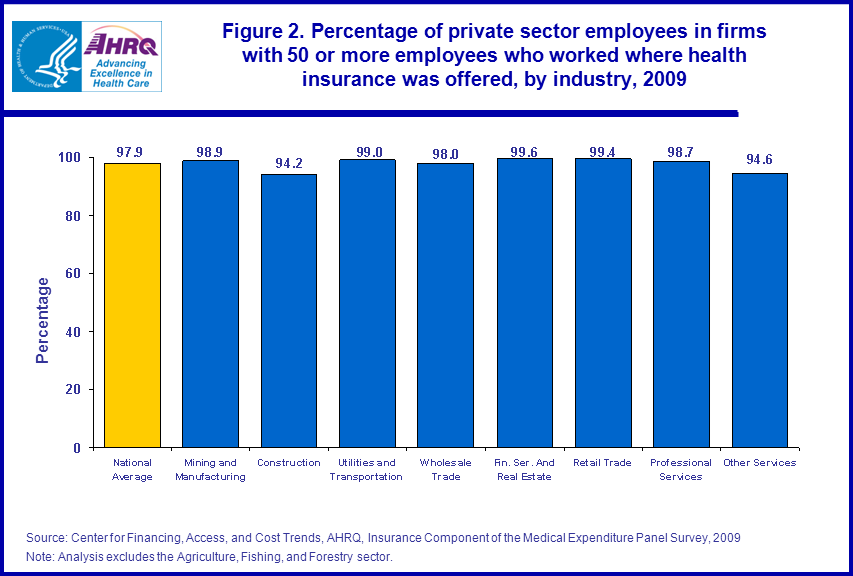
- In 2009, the overwhelming majority (97.9 percent) of employees of large (50 or more employees) firms worked where health insurance was offered. All industries had offer rates of over 90 percent for these large employers.
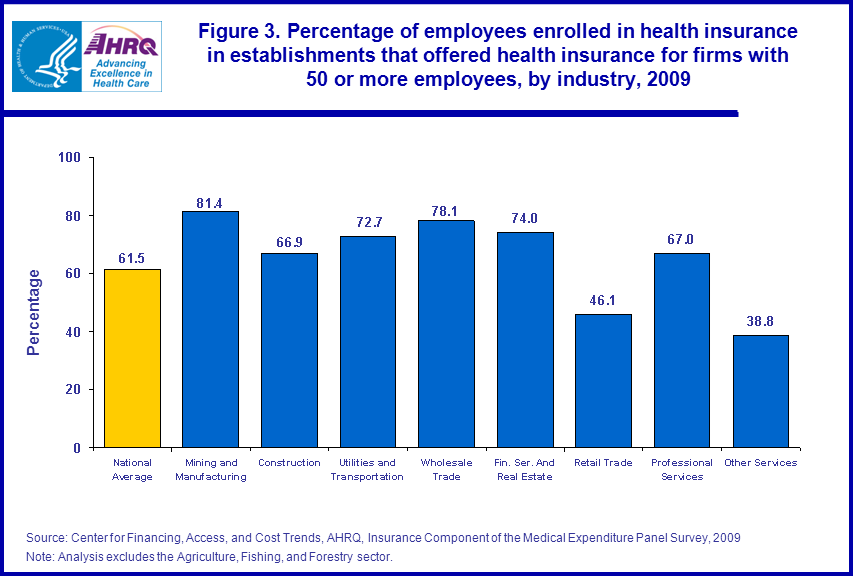
- In 2009, 61.5 percent of private sector employees enrolled in health insurance plans that were offered by their large employers. There was substantial variation in the enrollment rates by industry classification for workers at large employers.
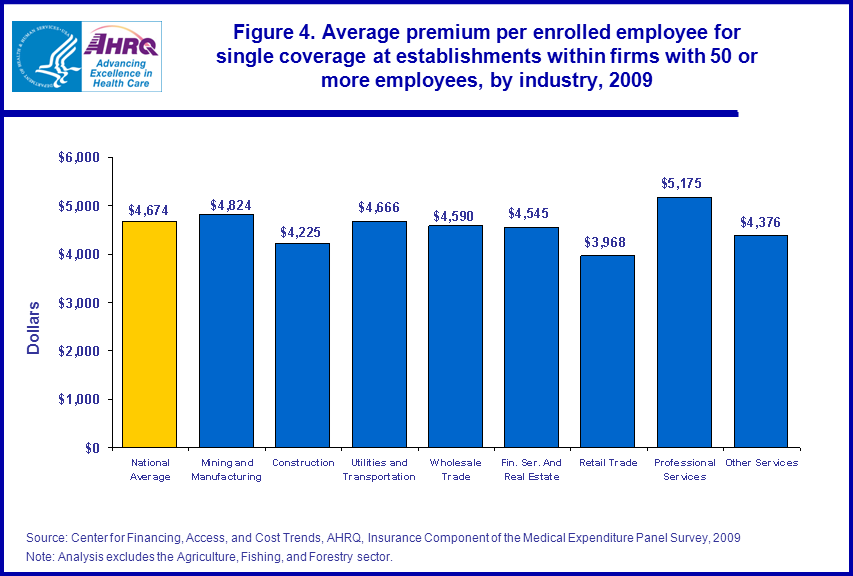
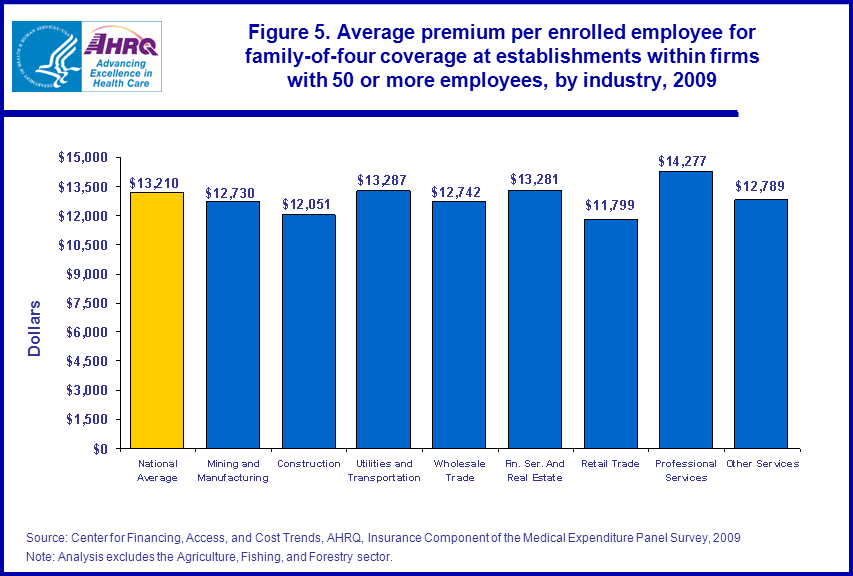
- Annual health insurance premiums per enrolled employee with single coverage at large firms averaged $4,674 in 2009. Premiums averaged $13,210 per enrolled employee for family-of-four coverage. Private sector single and family premiums for large firms were highest in Professional Services and lowest in Retail Trade.
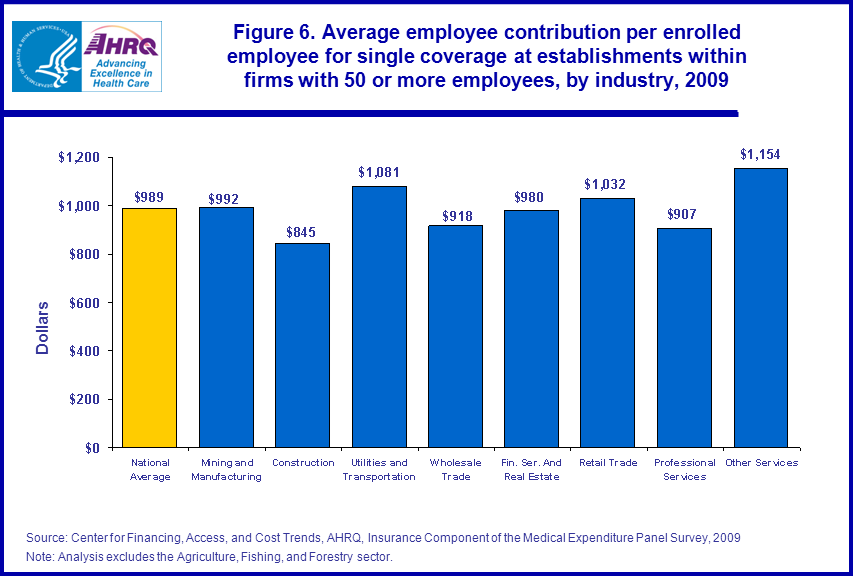
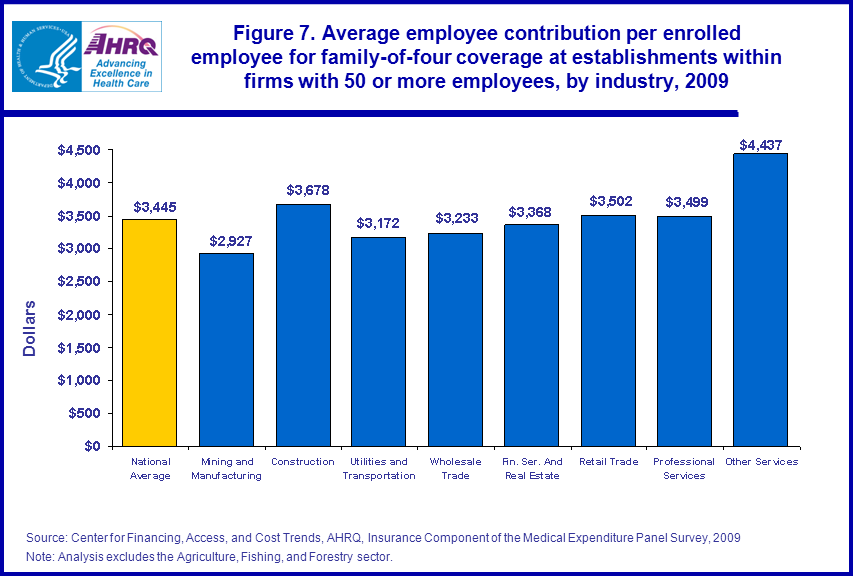
- The average employee premium contribution per enrolled employee for single coverage across large private employers was $989. The average employee premium contribution per enrolled employee for family coverage across large private sector employers was $3,445.
- Employees in the Professional Services sector had the lowest average contribution for single coverage for large firms, while those in Mining and Manufacturing had the lowest contribution for family coverage. Employees in the Other Services category had the highest contributions for both single and family insurance.
Introduction
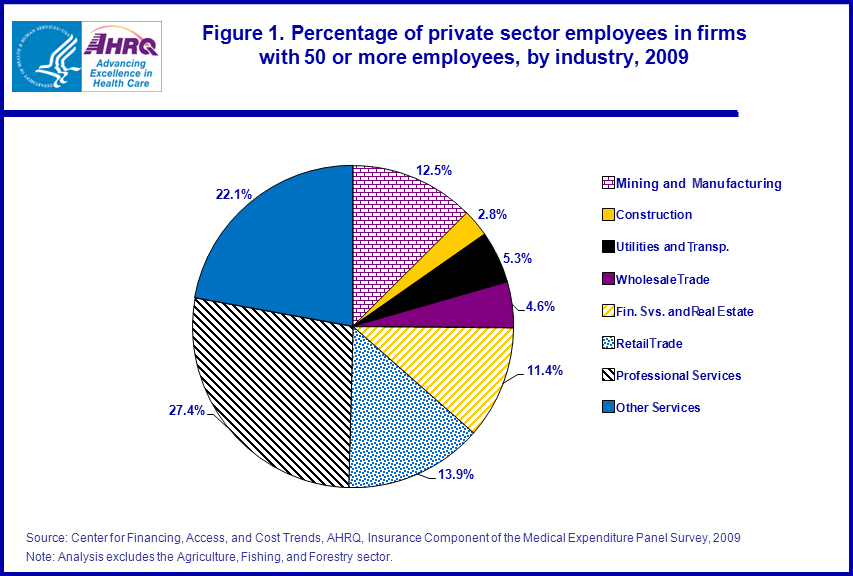
Employer-sponsored health insurance for current workers is one of the primary sources of health insurance coverage in the United States. According to data from the Insurance Component of the 2009 Medical Expenditure Panel Survey (MEPS-IC), approximately 96.8 million of the 110.5 million private sector employees worked in firms where the employer offered health insurance. Of those employees, approximately 59.1 million enrolled in a health insurance plan. About 80.7 million employees (73 percent) worked for large private sector employers in 2009 across eight industry classifications (figure 1) and approximately 48.6 million of them were enrolled.This Statistical Brief presents estimates, by industry classification, on the percentage of employees who worked for large private employers (firms with 50 or more employees) who offered health insurance and of employees working in such firms who enrolled in offered health insurance plans. The Brief also provides estimates on average premiums and the average employee contributions towards premiums for single coverage and for family coverage. Only those estimates that had a statistically significant difference from the national average at the 0.05 percent significance level are noted in the text.
Findings
Among the 80.7 million employees who worked for large private sector employers in 2009 (estimate not shown), 97.9 percent worked where the employer offered health insurance (figure 2). While all industries shown had offer rates for large firms that exceeded 90 percent, some differed significantly from the national average. Mining and Manufacturing, Financial Services and Real Estate, Retail Trade, and Professional Services were above average, with about 99 percent or more of employees in firms that offered health insurance. Other Services was below average, with 94.6 percent of employees in firms that offered health insurance. Among employees of large employers who worked where health insurance was offered, 61.5 percent enrolled (figure 3). The enrollment rates among large employers ranged from 38.8 percent for employees in the Other Services industry to 81.4 percent for the Mining and Manufacturing industry. In addition to Mining and Manufacturing, Wholesale Trade, Financial Services and Real Estate, Utilities and Transportation, and Professional Services had higher than average enrollment rates for large employers (78.1 percent, 74.0 percent, 72.7 percent, and 67.0 percent, respectively). Retail Trade (46.1 percent) was the only industry besides Other Services with lower than average enrollment rates among large employers.Average employee contributions towards premiums for large private sector employers in 2009 were $989 for single coverage (figure 6) and $3,445 for a family of four (figure 7). Average premium contributions by employees in large firms in the Other Services sector were the highest and higher than the national average for both single ($1,154) and family coverage ($4,437).
Employees working for large employers in the Professional Services sector made lower than average single premium contributions of $907. Contributions for family coverage were below average in Mining and Manufacturing ($2,927), relative to the U.S.
Data Source
This Statistical Brief summarizes data from the 2009 MEPS-IC. The data are available on the MEPS Web site at http://www.meps.ahrq.gov/mepsweb/survey_comp/Insurance.jsp or have been produced using special computation runs on the confidential MEPS-IC data available at the U.S. Census Bureau.Definitions
In this Brief, an employer is defined as a private sector firm. A firm is defined as a business entity that controls one or more business establishments or locations. Consequently, an employer can have multiple work locations. Only large employers with 50 or more employees across all their locations were included in this analysis. The classification by industry is based upon the North American Industrial Classification System, available at http://www.census.gov/eos/www/naics/. Estimates for the Agriculture, Fishing, and Forestry sector have been excluded from this analysis.About MEPS-IC
MEPS-IC is a survey of business establishments and governments that collects information on employer-sponsored health insurance, such as whether insurance is offered, enrollments, types of plans, and premiums. The survey is conducted annually by the U.S. Census Bureau under the sponsorship of the Agency of Healthcare Research and Quality. The yearly response rate has averaged 78 percent for in-scope sample units. Approximately 4 percent of the original sample has been out of scope in a typical year. A total sample of 42,000 establishments was selected for the 2009 survey, prior to accounting for losses due to nonresponse and out-of-scope cases. For more information on this survey, see MEPS Methodology Reports 6, 8, 10, 14, 17, and 18 under MEPS publications at http://www.meps.ahrq.gov/mepsweb/data_stats/publications.jsp and the MEPS Insurance/Employer Component Survey Basics at http://www.meps.ahrq.gov/mepsweb/survey_comp/Insurance.jsp.Suggested Citation
Davis, K. and Branscome, J. Employer-Sponsored Health Insurance for Large Employers in the Private Sector, by Industry Classification, 2009. Statistical Brief #322. April 2011. Agency for Healthcare Research and Quality, Rockville, MD. http://www.meps.ahrq.gov/mepsweb/data_files/publications/st322/stat322.shtmlAHRQ welcomes questions and comments from readers of this publication who are interested in obtaining more information about access, cost, use, financing, and quality of health care in the United States. We also invite you to tell us how you are using this Statistical Brief and other MEPS data and tools and to share suggestions on how MEPS products might be enhanced to further meet your needs. Please e-mail us at mepspd@ahrq.gov or send a letter to the address below:
Steve B. Cohen, PhD, Director
Center for Financing, Access, and Cost Trends
Agency for Healthcare Research and Quality
540 Gaither Road
Rockville, MD 20850
 |
||||||||||||||||||||||||||||||||||||
|
||||||||||||||||||||||||||||||||||||
|
|
||||||||||||||||||||||||||||||||||||
 |
||||||||||||||||||||||||||||||||||||
|
||||||||||||||||||||||||||||||||||||
|
|
||||||||||||||||||||||||||||||||||||
 |
||||||||||||||||||||||||||||||||||||
|
||||||||||||||||||||||||||||||||||||
|
|
||||||||||||||||||||||||||||||||||||
 |
||||||||||||||||||||||||||||||||||||
|
||||||||||||||||||||||||||||||||||||
|
|
||||||||||||||||||||||||||||||||||||
 |
||||||||||||||||||||||||||||||||||||
|
||||||||||||||||||||||||||||||||||||
|
|
||||||||||||||||||||||||||||||||||||
 |
||||||||||||||||||||||||||||||||||||
|
||||||||||||||||||||||||||||||||||||
|
|
||||||||||||||||||||||||||||||||||||
 |
||||||||||||||||||||||||||||||||||||
|
||||||||||||||||||||||||||||||||||||
|
|
||||||||||||||||||||||||||||||||||||