
|
|
|
Font Size:
|
||||
|
|
|
|
||||
STATISTICAL BRIEF #337:
Expenditures for Treatment of Hypertension among Adults Age 18 and Older, 2008: Estimates for the U.S. Civilian Noninstitutionalized Population
Highlights
- In 2008, about 55.1 million or 23.9 percent of adults age 18 and older had some health care expenses for hypertension.
- Direct medical spending to treat hypertension totaled $47.3 billion in 2008, with almost half ($21.3 billion) in the form of prescription medications.
- Annual expenditures for hypertension among those with an expense related to hypertension averaged $860 per adult in 2008.
- The mean expenditure per person for the treatment of hypertension was highest for Hispanics at $1,272.
Introduction
Hypertension, commonly known as high blood pressure, is the most common cardiovascular disease. It is the leading cause of stroke and kidney failure, and a major cause of heart attack.This Statistical Brief presents estimates based on the Household Component of the Medical Expenditure Panel Survey (MEPS-HC) on the use of and expenditures for all medical care, ambulatory care (office-based provider and hospital outpatient visits), and prescribed medicines to treat hypertension among the U.S. civilian noninstitutionalized population. Annual estimates for 2008 are shown by type of service and source of payment. All differences between estimates noted in the text are statistically significant at the 0.05 level or better.
Findings
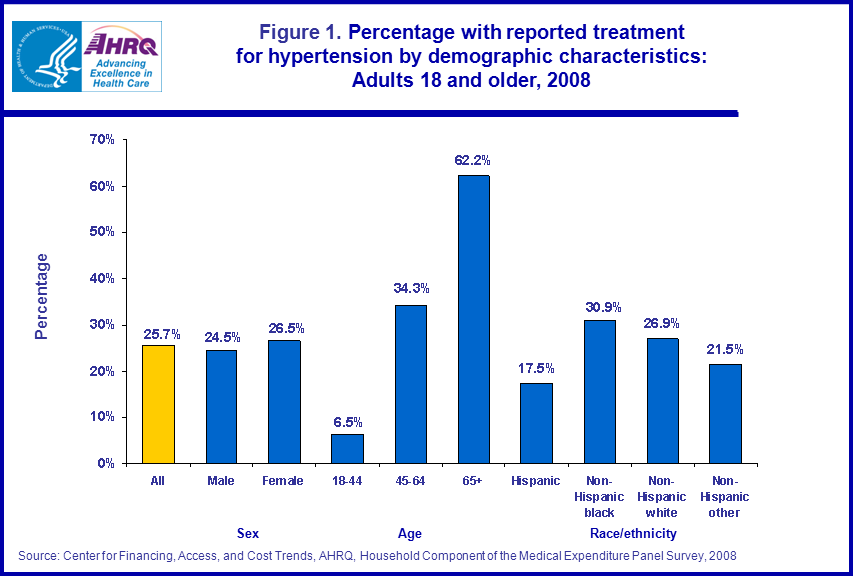
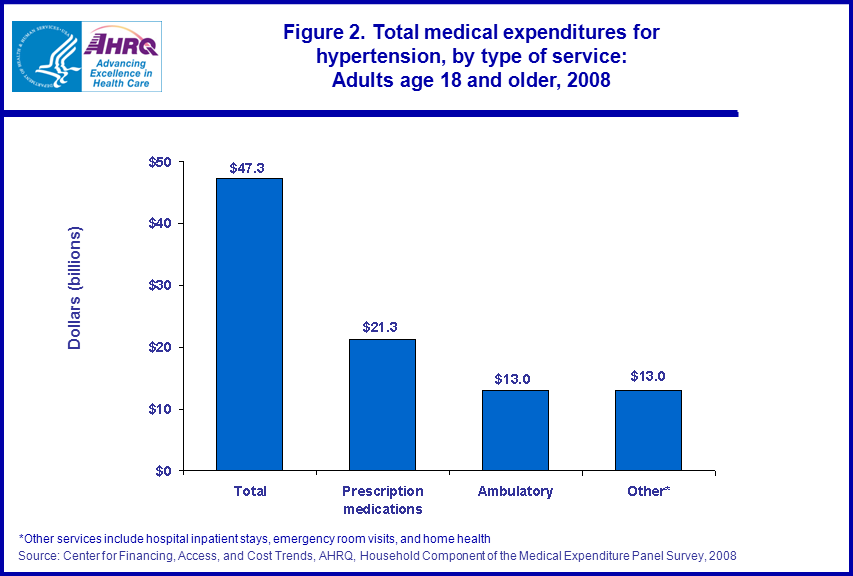
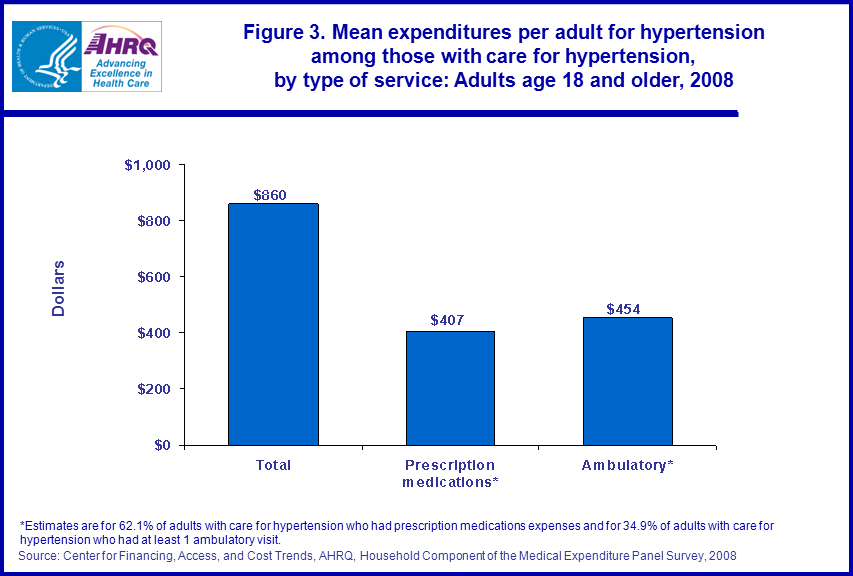
In 2008, 55.1 million or 23.9 percent of U.S. adults age 18 and older received treatment for hypertension (figure 1). The percentage with reported treatment for hypertension was higher for adults age 65 years and older (59.9 percent) than those in the younger age groups, 45–64 years (31.9 percent) and 18–44 years (5.3 percent). A higher percentage of non-Hispanic blacks were treated for hypertension than those who were non-Hispanic white, non-Hispanic other, or Hispanic (29.1 percent versus 25.2 percent, 19.9 percent, and 15.3 percent, respectively). Slightly more women received treatment for hypertension (24.9 percent) than men (22.9 percent).In 2008, a total of $47.3 billion was spent on treatment of hypertension on adults for all medical services. Almost 45 percent of expenditures for hypertension were spent on prescription medicines ($21.3 billion) compared to 27 percent on both ambulatory visits ($13.0 billion) and other services ($13.0 billion) (figure 2). For adults age 18 and older, the mean expenditure per person for the treatment of hypertension among those with an expense for hypertension was $860 in 2008. The mean expense per adult for ambulatory visits was $454, and $407 for prescription medications (figure 3).
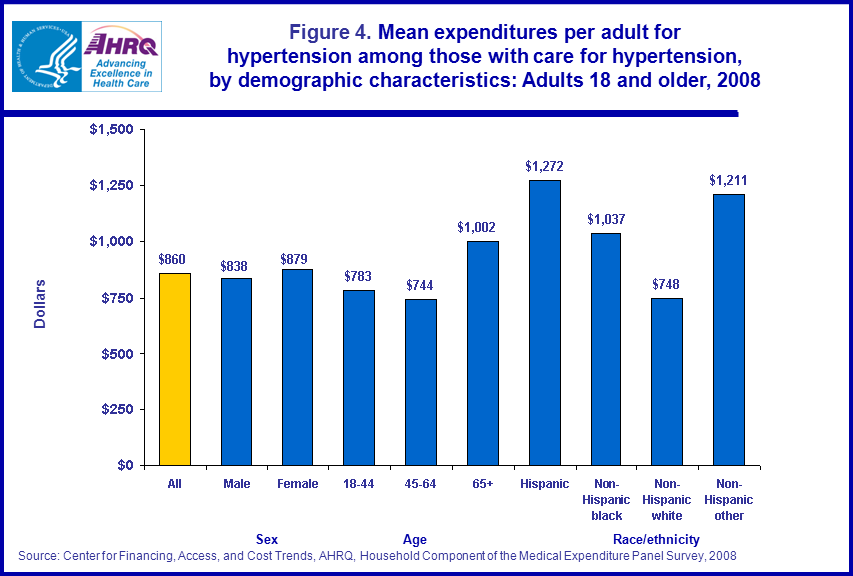
In 2008, the mean expenditure per person for the treatment of hypertension was higher for adults age 65 and older ($1,002) than for adults ages 45–64 ($744) or ages 18–44 ($783) (figure 4).
The mean expenditure per person for the treatment of hypertension was higher for Hispanics, non-Hispanic others, and non-Hispanic blacks ($1,272, $1,211 and $1,037, respectively) than for non-Hispanic whites ($748).
There was no significant difference in the mean expenditure per person for men ($838) or women ($879) for treatment for hypertension.
Distribution of average annual health care expenditures for hypertension, by source of payment and type of service
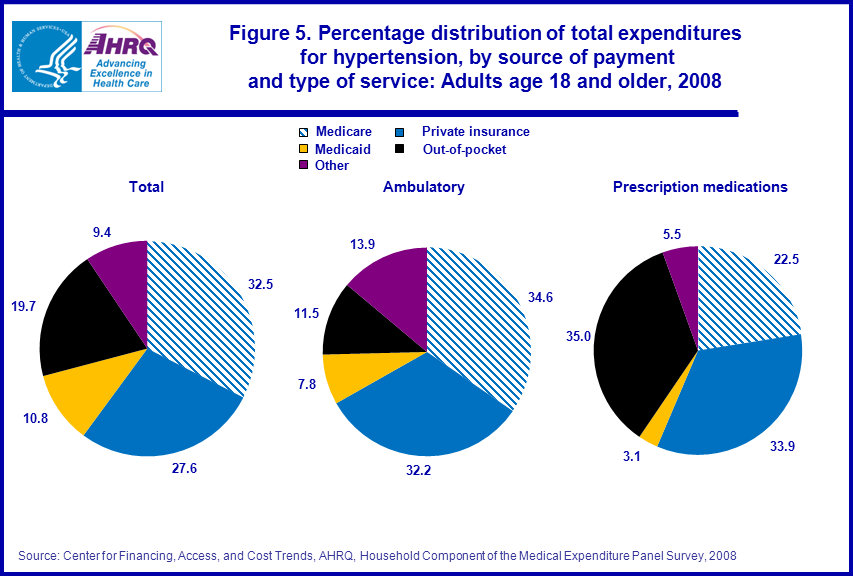
About one-third (32.5 percent) of the expenditures for the treatment of hypertension for adults in 2008 were paid by Medicare, with private insurance paying 27.6 percent, out-of-pocket payments accounting for about one-fifth (19.7 percent), and Medicaid accounting for 10.8 percent (figure 5).
More than one-third (35 percent) of the expenses for prescription medicines and 11.5 percent of the expenses for ambulatory visits were paid out of pocket. About one-third of the expenditures for prescription medications and ambulatory care were paid by private insurance (33.9 percent and 32.2 percent, respectively).
Distribution of average annual health care expenditures for hypertension, by source of payment and age
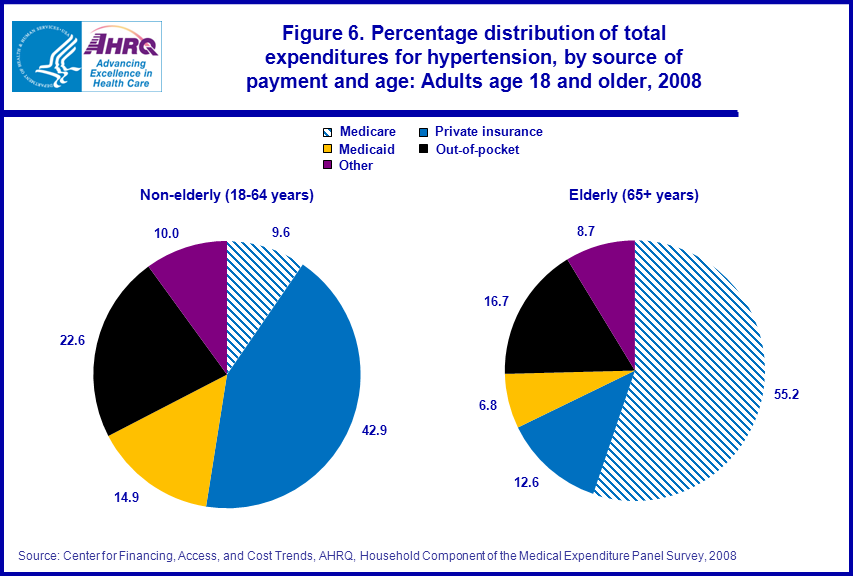
Among adults ages 18–64, 42.9 percent of the expenditures for the treatment of hypertension were paid by private insurance, with out-of-pocket payments accounting for 22.6 percent. Medicaid and Medicare accounted for 14.9 percent and 9.6 percent, respectively (figure 6).
Medicare paid 55.2 percent of the expenditures for the treatment of hypertension for elderly adults age 65 and older, with out-of-pocket payments accounting for 16.7 percent, and private insurance paying 12.6 percent. Medicaid accounted for 6.8 percent of expenses.
Data Source
The estimates shown in this Statistical Brief are based on data from the MEPS 2008 Full Year Consolidated Data File (HC-121); 2008 Medical Conditions File (HC-120); 2008 Prescribed Medicines File (HC-118A); 2008 Hospital Inpatient Stays File (HC-118D); 2008 Emergency Room Visits File (HC-118E); 2008 Outpatient Visits File (HC-118F); 2008 Office-Based Medical Provider Visits File (HC-118G); and 2008 Home Health File (HC-118H).Definitions
HypertensionThis Brief analyzes adults age 18 and older with hypertension in connection with health care utilization. The conditions reported by respondents were recorded by interviewers as verbatim text which was then coded by professional coders to fully specified ICD-9-CM codes. These codes were regrouped in clinically homogenous categories known as CCS codes. Conditions with CCS codes 98 and 99 (hypertension) were used for this Brief. A crosswalk of ICD-9 codes and CCS codes is available in the documentation file of the Medical Conditions File for 2008 (HC-120). For additional information on crosswalk between ICD-9 codes and CCS codes, please visit: http://www.hcup-us.ahrq.gov/toolssoftware/ccs/ccs.jsp.
Ambulatory
Any visit to a hospital outpatient department, private doctor’s office, group practice, health clinic, walk-in surgi-clinic/center, walk-in urgi-care center, company or school clinic, infirmary, neighborhood health clinic, family planning center, or mental health facility.
Expenditures
Expenditures in MEPS are defined as payments from all sources for hospital inpatient care, ambulatory care provided in offices and hospital outpatient departments, care provided in emergency departments, paid care provided in the patient’s home (home health), and the purchase of prescribed medications. Sources include direct payments from individuals, private insurance, Medicare, Medicaid, Workers’ Compensation, and miscellaneous other sources. Payments for over-the-counter drugs are not included in MEPS total expenditures. Indirect payments not related to specific medical events, such as Medicaid Disproportionate Share and Medicare Direct Medical Education subsidies, are also excluded.
Expenditures were classified as being associated with hypertension if a visit, stay, or medication purchase was cited as being related to hypertension. Expenditures may be associated with more than one condition and therefore may include some for conditions other than hypertension. Total spending does not include amounts for other medical expenses, such as durable and nondurable supplies, medical equipment, eyeglasses, ambulance services, and dental expenses, because these items could not be linked to specific conditions.
Racial and ethnic classifications
Classification by race and ethnicity was based on information reported for each family member. Respondents were asked if each family member was Hispanic or Latino. Respondents were also asked which race or races best described each family member. Race categories included white, black/African American, American Indian or Alaska Native, Asian, Native Hawaiian or other Pacific Islander, and other. Based on these questions, sample persons were classified into the following race/ethnicity categories: Hispanic, black non-Hispanic single race, white non-Hispanic single race, and other (Asian non-Hispanic single race, Hawaiian/Pacific Islander non-Hispanic, American Indian/Alaska Native non-Hispanic, and multiple races non-Hispanic).
Sources of payment
- Private insurance: This category includes payments made by insurance plans covering hospital and other medical care (excluding payments from Medicare, Medicaid, and other public sources), Medigap plans, and TRICARE (Armed Forces-related coverage).
- Medicare: Medicare is a federally financed health insurance plan for the elderly, persons receiving Social Security disability payments, and persons with end-stage renal disease. Medicare Part A, which provides hospital insurance, is automatically given to those who are eligible for Social Security. Medicare Part B provides supplementary medical insurance that pays for medical expenses and can be purchased for a monthly premium. Medicare Part D, which started in 2006, covers prescription drug expenses.
- Medicaid/CHIP: This category includes payments made by the Medicaid and CHIP programs which are means-tested government programs financed jointly by federal and state funds that provide health care to those who are eligible. Medicaid is designed to provide health coverage to families and individuals who are unable to afford necessary medical care while CHIP provides coverage to additional low income children not eligible for Medicaid. Eligibility criteria for both programs vary significantly by state.
- Out of pocket: This category includes expenses paid by the user or other family member.
- Other sources: This category includes payments from other federal sources such as Indian Health Service, military treatment facilities, and other care provided by the federal government; various state and local sources (community and neighborhood clinics, state and local health departments, and state programs other than Medicaid/CHIP); various unclassified sources (e.g., automobile, homeowner’s, or other liability insurance, and other miscellaneous or unknown sources); Medicaid/CHIP payments reported for persons who were not reported as enrolled in the Medicaid or CHIP programs at any time during the year; and private insurance payments reported for persons without any reported private health insurance coverage during the year.
About MEPS-HC
MEPS-HC is a nationally representative longitudinal survey that collects detailed information on health care utilization and expenditures, health insurance, and health status, as well as a wide variety of social, demographic, and economic characteristics for the U.S. civilian noninstitutionalized population. It is cosponsored by the Agency for Healthcare Research and Quality and the National Center for Health Statistics.For more information about MEPS, call the MEPS information coordinator at AHRQ (301-427-1406) or visit the MEPS Web site at http://www.meps.ahrq.gov/.
References
For a detailed description of the MEPS survey design, sample design, and methods used to minimize sources of nonsampling errors, see the following publications:Cohen, J. Design and Methods of the Medical Expenditure Panel Survey Household Component. MEPS Methodology Report No. 1. AHCPR Pub. No. 97-0026. Rockville, MD. Agency for Health Care Policy and Research, 1997. http://www.meps.ahrq.gov/mepsweb/data_files/publications/mr1/mr1.shtml
Cohen, S. Sample Design of the 1996 Medical Expenditure Panel Survey Household Component. MEPS Methodology Report No. 2. AHCPR Pub. No. 97-0027. Rockville, MD. Agency for Health Care Policy and Research, 1997. http://www.meps.ahrq.gov/mepsweb/data_files/publications/mr2/mr2.shtml
Cohen, S. Design Strategies and Innovations in the Medical Expenditure Panel Survey. Medical Care, July 2003: 41(7) Supplement: III-5–III-12.
Ezzati-Rice, T.M., Rohde, F., Greenblatt, J. Sample Design of the Medical Expenditure Panel Survey Household Component, 1998–2007. Methodology Report No. 22. March 2008. Agency for Healthcare Research and Quality, Rockville, MD. http://www.meps.ahrq.gov/mepsweb/data_files/publications/mr22/mr22.shtml
For more information about hypertension, see the following:
American Society of Hypertension: http://www.ash-us.org
Hypertension Fact Sheet: http://www.cdc.gov/nchs/fastats/hyprtens.htm
Suggested Citation
Davis, K. Expenditures for Treatment of Hypertension among Adults 18 and Older, 2008: Estimates for the U.S. Civilian Noninstitutionalized Population. Statistical Brief #337. September 2011. Agency for Healthcare Research and Quality, Rockville, MD http://www.meps.ahrq.gov/mepsweb/data_files/publications/st337/stat337.shtmlAHRQ welcomes questions and comments from readers of this publication who are interested in obtaining more information about access, cost, use, financing, and quality of health care in the United States. We also invite you to tell us how you are using this Statistical Brief and other MEPS data and tools and to share suggestions on how MEPS products might be enhanced to further meet your needs. Please e-mail us at MEPSProjectDirector@ahrq.hhs.gov or send a letter to the address below:
Steve B. Cohen, PhD, Director
Center for Financing, Access, and Cost Trends
Agency for Healthcare Research and Quality
540 Gaither Road
Rockville, MD 20850
 |
||||||||||||||||||||||||||||||||
|
||||||||||||||||||||||||||||||||
|
|
||||||||||||||||||||||||||||||||
 |
||||||||||||||||||||||||||||||||
|
||||||||||||||||||||||||||||||||
|
|
||||||||||||||||||||||||||||||||
 |
||||||||||||||||||||||||||||||||
|
||||||||||||||||||||||||||||||||
|
|
||||||||||||||||||||||||||||||||
 |
||||||||||||||||||||||||||||||||
|
||||||||||||||||||||||||||||||||
|
|
||||||||||||||||||||||||||||||||
 |
||||||||||||||||||||||||||||||||
|
||||||||||||||||||||||||||||||||
|
|
||||||||||||||||||||||||||||||||
 |
||||||||||||||||||||||||||||||||
|
||||||||||||||||||||||||||||||||
|
|
||||||||||||||||||||||||||||||||