|
|
Font Size:
|
||||
|
|
|
|
||||
STATISTICAL BRIEF #35:
Trends in Antibiotic Use among U.S. Children Aged 0 to 4 Years, 1996-2000
Highlights
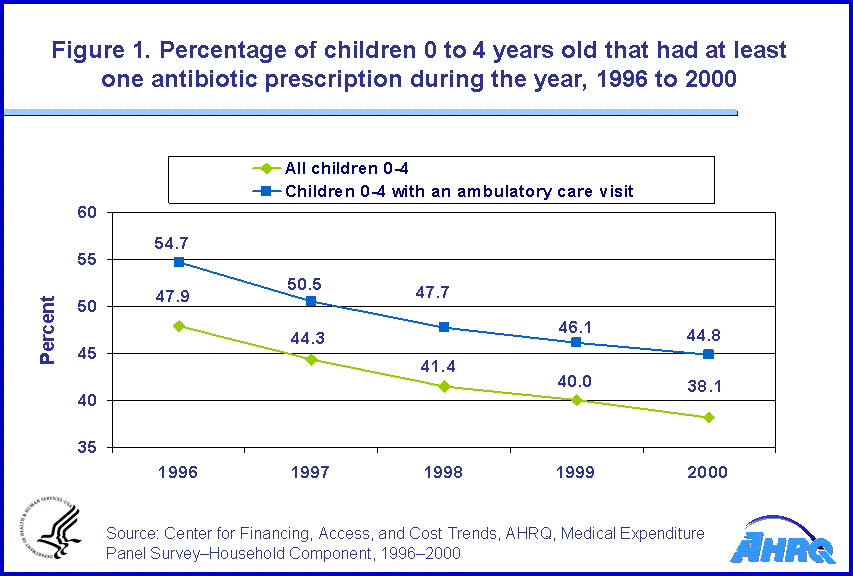
- The proportion of children aged 0 to 4 years that used at least one antibiotic during the year decreased from 47.9 percent in 1996 to 38.1 percent in 2000.
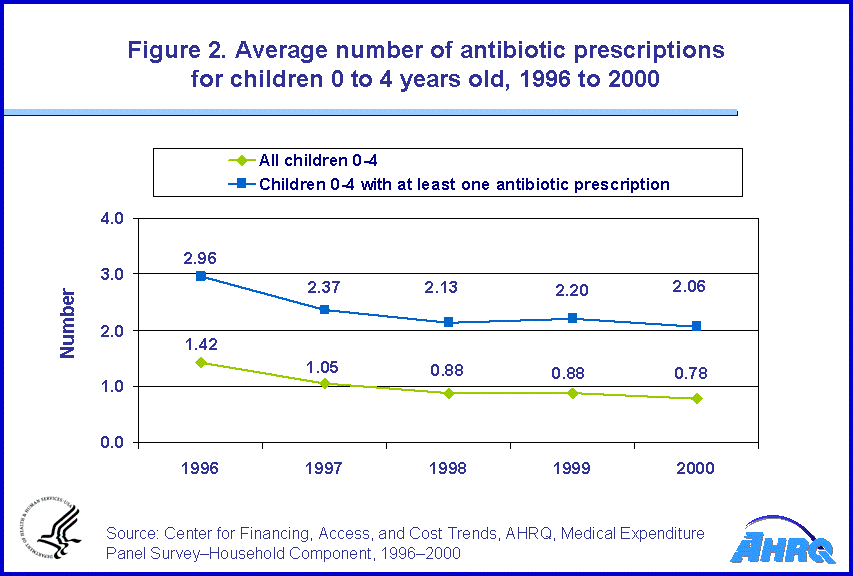
- The average number of antibiotic prescriptions decreased from 1.42 prescriptions per child in 1996 to 0.78 prescriptions per child in 2000.
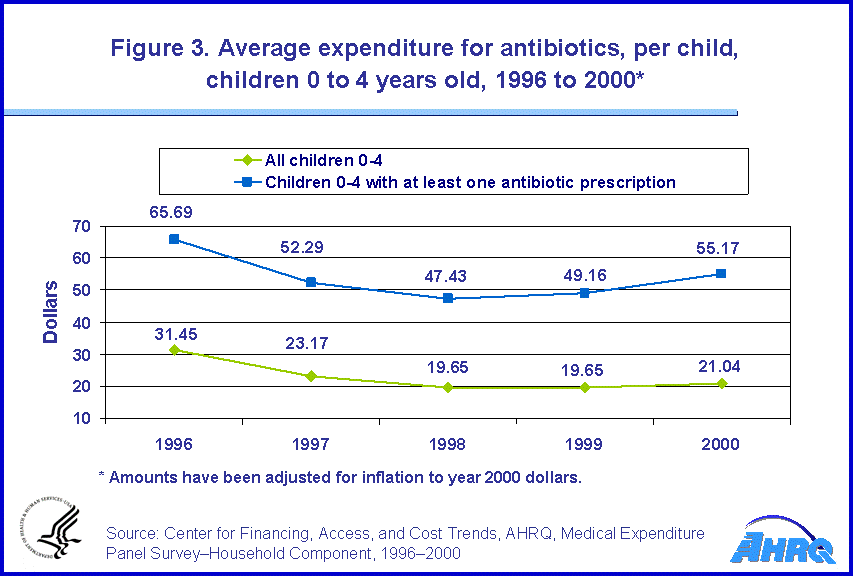
- The average expenditure for antibiotics decreased from $31.45 per child in 1996 (in Consumer Price Index-adjusted 2000 U.S. dollars) to $21.04 per child in 2000.4
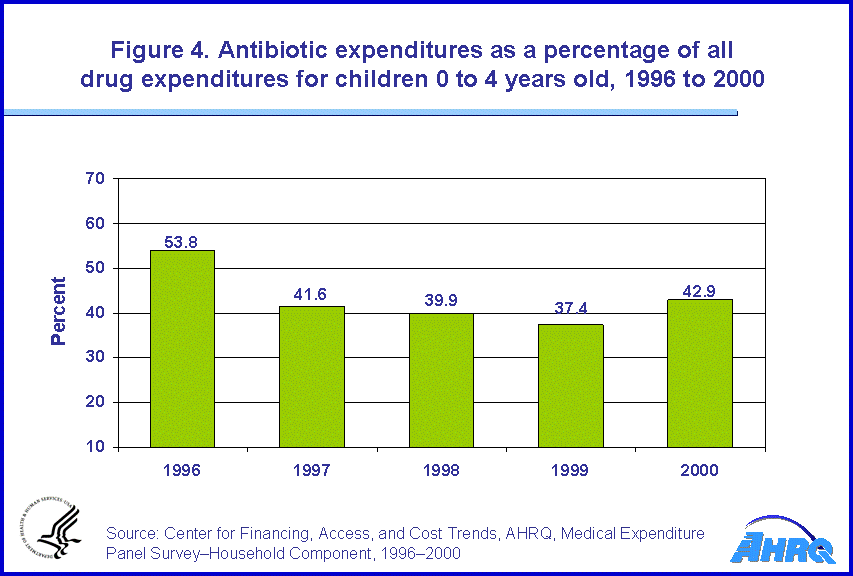
- Aggregate expenditures for antibiotics accounted for 53.8 percent of total drug spending by children in 1996 but accounted for 42.9 percent in 2000.
Introduction
In 1995, concerns about the overuse of antibiotics and the increasing prevalence of antibiotic resistant bacterial infections prompted the Centers for Disease Control and Prevention (CDC) to launch a national campaign to promote the appropriate use of antibiotics.1 The majority of outpatient antibiotics in the United States are prescribed for respiratory tract infections, such as otitis media, bronchitis, and sinusitis, which are common ailments of young children. It is not surprising, therefore, that rates of antibiotic drug use are higher for young children than for any other age group2 and that trends in antibiotic use among young children are a major public health concern.
This Statistical Brief presents data from the Medical Expenditure Panel Survey--Household Component (MEPS-HC) on antibiotic drug use by children aged 0 to 4 years for the calendar years 1996 through 2000. The definition of antibiotics includes all major classes of oral antibiotics but excludes topical antibiotics.3 All differences discussed in the text are statistically significant at the 0.05 level.
Findings
In 1996, 47.9 percent of the approximately 19 million children aged 0 to 4 years had at least one prescription for an oral antibiotic during the year. By 2000, the proportion of young children using an antibiotic had fallen to 38.1 percent (figure 1). The downward trend in antibiotic use among children with an ambulatory care visit was similar to this trend for all children. In 1996, 54.7 percent of children with an ambulatory care visit had at least one antibiotic. By 2000, the rate of use in this group had fallen to 44.8 percent.
The average number of antibiotic prescriptions also declined from 1.42 prescriptions per child in 1996 to 0.78 prescriptions per child in 2000 (figure 2). This decline resulted both because of a lower percentage of children with any antibiotic use and because children who used antibiotics had fewer prescriptions. Among children who used at least one antibiotic, the average number of prescriptions fell from 2.96 prescriptions per child in 1996 to 2.06 prescriptions per child by 2000.
Per capita expenditures for antibiotics among young children are shown in figure 3. Expenditures are expressed in constant dollars by inflating all expenditures up to 2000 U.S. dollars using the Consumer Price Index for All Urban Consumers (CPI-U) for all items averaged across all U.S. cities. In 1996, the average expenditure per child (in 2000 US dollars) was $31.45. By 2000, the average expenditure had fallen by 33 percent to $21.04 per child. Among children who used at least one antibiotic, the average expenditure fell from $65.69 per child in 1996 to $55.17 per child by 2000.
Figure 4 shows aggregate expenditures for antibiotics as a percentage of all drug spending for children 0 to 4 years old. In 1996, expenditures for antibiotics accounted for 53.8 percent of all young children's drug expenditures. By 2000, antibiotics accounted for 42.9 percent of all drug expenditures for young children in the United States.
Data Source
The estimates presented in this Statistical Brief come from the MEPS Full-Year Files 1996-2000 (HC-012, HC-020, HC-028, HC-038, and HC-050) and MEPS Prescribed Medicines Files (PMED) 1996-2000 (HC-010A, HC-016A, HC-026A, HC-033A, and HC-051A). Each drug that was listed as purchased or otherwise obtained in the PMED files was assigned to a major therapeutic class and subclass by linking the PMED files to the Multum Lexicon database, a product of Cerner Multum, Inc. Antibiotics were identified with an algorithm that used Multum therapeutic classification variables.
About MEPS-HC
MEPS-HC is a nationally representative longitudinal survey that collects detailed information on health care utilization and expenditures, health insurance, and health status, as well as a wide variety of social, demographic, and economic characteristics for the civilian noninstitutionalized population. It is cosponsored by the Agency for Healthcare Research and Quality (AHRQ) and the National Center for Health Statistics (NCHS).
For a detailed description of the MEPS-HC survey design, sample design, and methods used to minimize sources on nonsampling error, see the following publications:
Cohen, J. Design and Methods of the Medical Expenditure Panel Survey Household Component. MEPS Methodology Report No. 1. AHCPR Pub. No. 97-0026. Rockville, Md.: Agency for Health Care Policy and Research, 1997.
Cohen, S. Sample Design of the 1996 Medical Expenditure Panel Survey Household Component. MEPS Methodology Report No. 2. AHCPR Pub. No. 97-0027. Rockville, Md.: Agency for Health Care Policy and Research, 1997.
These publications and more information about MEPS are available on the MEPS Web site: http://www.meps.ahrq.gov/.
Footnotes
1 http://www.cdc.gov/drugresistance/community/
2 Authors' calculations using MEPS data.
3 Several subclasses of anti-infectives, including antifungals and antivirals, were also excluded.
4 Expenditures are expressed in constant dollars by inflating all expenditures up to 2000 U.S. dollars using the Consumer Price Index for All Urban Consumers (CPI-U) for all items averaged across all U.S. cities.
 |
||||||||||||||||||||||||||||||
|
||||||||||||||||||||||||||||||
|
|
||||||||||||||||||||||||||||||
 |
||||||||||||||||||||||||||||||
|
||||||||||||||||||||||||||||||
|
|
||||||||||||||||||||||||||||||
 |
||||||||||||||||||||||||||||||
|
||||||||||||||||||||||||||||||
|
|
||||||||||||||||||||||||||||||
 |
||||||||||||||||||||||||||||||
|
||||||||||||||||||||||||||||||
|
|
||||||||||||||||||||||||||||||


