|
|
Font Size:
|
||||
|
|
|
|
||||
STATISTICAL BRIEF #38:
Health Care Expenditures and Percentage Uninsured in 10 Large Metropolitan Areas, 2000
Highlights
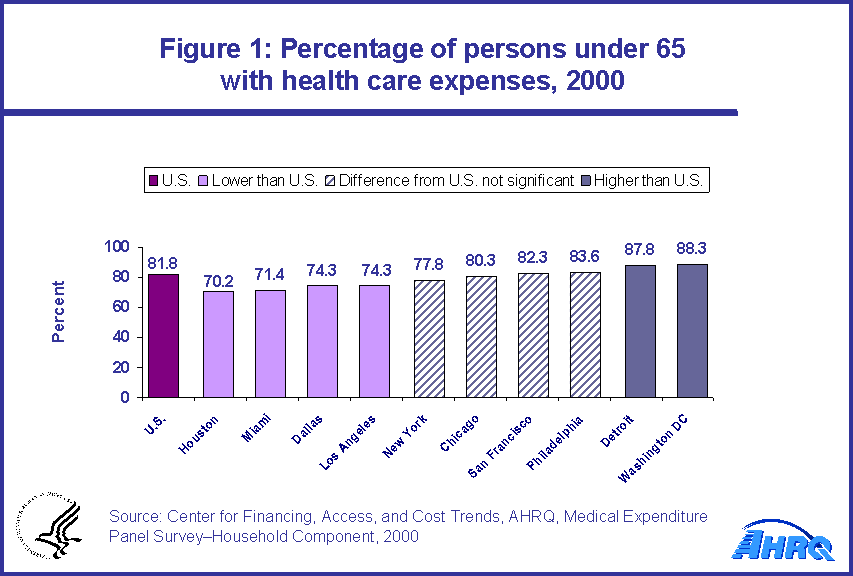
- In comparison to the national average, the proportion of persons under 65 years of age that incurred some health care expenses in 2000 was lower in Houston, Miami, Los Angeles, and Dallas, but higher in Detroit and Washington, D.C.
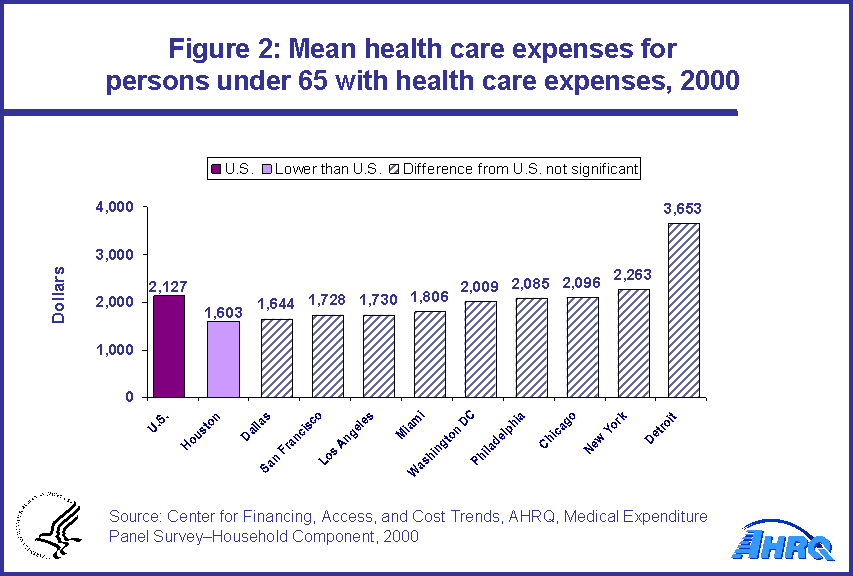
- For the majority of the 10 MSAs examined, differences from national averages in average expenses and uninsured rates for the population less than 65 years of age were not statistically significant.
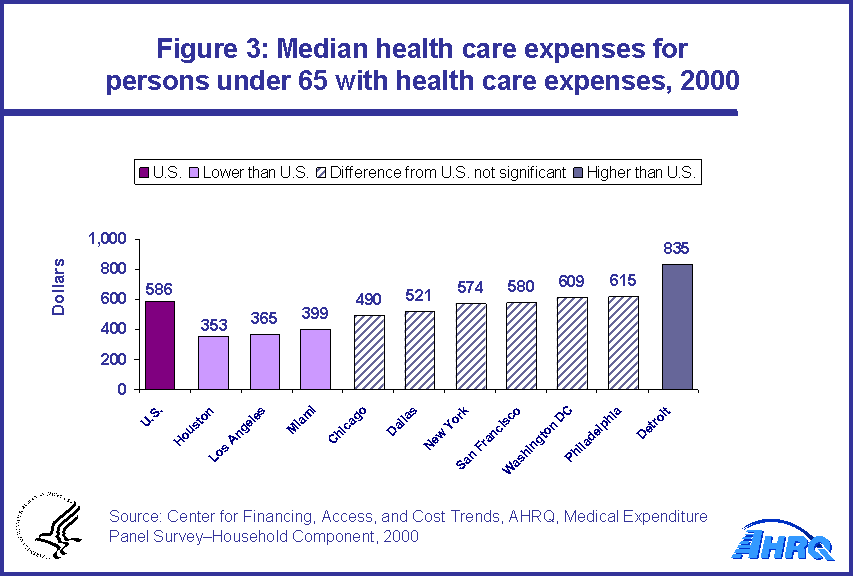
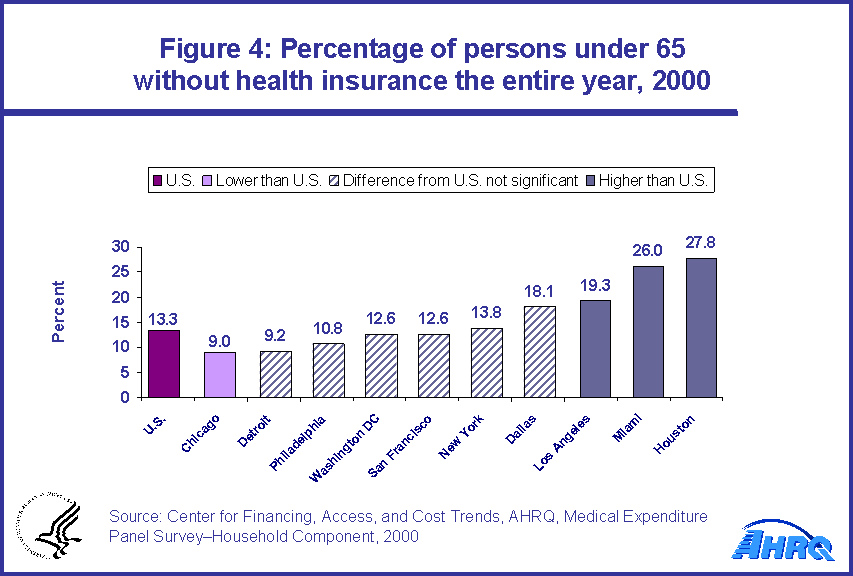
- The populations under 65 years of age in the Houston, Miami, and Los Angeles metropolitan areas were more likely to be uninsured throughout the year in 2000 and also had lower median expenses (among those with expenses) relative to the national average.
- Median expenses in Detroit were higher than the national average, while the uninsured rate in Chicago was lower than the national average.
Introduction
The Medical Expenditure Panel Survey--Household Component (MEPS-HC) is designed to produce estimates of the health care use, expenditures, sources of payment, and insurance coverage among the U.S. civilian noninstitutionalized (community) population. While MEPS was designed to ensure reliable estimates at the national and regional level for a large variety of population subgroups, estimates with acceptable precision can also be produced for several large metropolitan areas.
Many factors can influence the level of health care expenses in a particular area, including the demographic, socioeconomic, and health status characteristics of the population. Further, the extent to which persons in an area have health insurance coverage can impact both access to care and the average level of expenditures.
Based on data from the 2000 MEPS-HC, this report compares estimates of health care expenses and uninsured rates for the community population under 65 years of age in 10 large metropolitan areas to national averages. These 10 areas are defined by metropolitan statistical areas (MSA) and include Chicago, Dallas, Detroit, Houston, Los Angeles, Miami, New York City, Philadelphia, San Francisco, and Washington, D.C. All differences discussed in this Statistical Brief are statistically significant at the 0.05 level, and standard errors associated with the estimates are available at http://www.meps.ahrq.gov/mepsweb/survey_comp/standard_errors.jsp.
Findings
An estimated 81.8 percent of persons under 65 years of age in the U.S. community population had some expenses for health care in 2000. The proportion with health care expenses was somewhat lower in four MSAs--Houston (70.2 percent), Miami (71.4 percent), Los Angeles (74.3 percent), and Dallas (74.3 percent)--when compared to the national estimate (figure 1). In contrast, the proportion of non-elderly with health care expenses was higher than the national average in the Detroit (87.8 percent) and Washington, D.C. (88.3 percent) metropolitan areas.
Among persons under 65 in the U.S. community population with some health care expenses in 2000, the estimated mean expense per person was $2,127 (figure 2). Mean expenses per person only differed from the national average for the Houston metropolitan area, where the estimated mean was about 25 percent lower ($1,603). While the estimate for Detroit ($3,653) appears high relative to the national average, the difference was not statistically significant.
Median health care expenses tend to be substantially lower than mean expenses because a small percentage of people incur a disproportionately large share of total medical expenses. The median expense for the overall U.S. civilian noninstitutionalized population under 65 years of age was $586 (figure 3), about one-fourth the mean expenditure level of $2,127 (as shown in figure 2). Median expenses were lower than the national average in three large MSAs--Houston ($352), Los Angeles ($365), and Miami ($399). In contrast, the estimated median expense per person in Detroit ($835) was higher than the national average.
Houston, Miami, and Los Angeles, the three MSAs with lower median expenses than the national average for the population under 65 years of age (as shown in figure 3), also had higher proportions that were uninsured for the full year (figure 4). The uninsured rates for persons under 65 in these MSAs were 27.8, 26.0, and 19.3 percent, respectively, compared to a national rate of 13.3 percent. Among the other MSAs, only Chicago had a lower uninsured rate (9.0 percent) than the national average.
Definitions
Metropolitan statistical area: Areas designated by the U.S. Office of Management and Budget that are composed of a large population nucleus combined with adjacent communities that have a high degree of economic and social integration with the nucleus. Each MSA has one or more central counties containing the area's main population concentration.
Expenditures: Total payments from all sources to hospitals, physicians, other health care providers (including dental care), and pharmacies for services reported by respondents in the MEPS-HC. Sources include direct payments from individuals, private insurance, Medicare, Medicaid, and miscellaneous other sources.
Uninsured: Persons not covered by Medicare, Tricare, Medicaid, other public hospital/physician programs, or private hospital/physician insurance at any time during the year or period of eligibility for the survey. Individuals covered only by noncomprehensive State-specific programs (e.g., Maryland Kidney Disease Program, Colorado Child Health Plan) or private single-service plans (e.g., coverage for dental or vision care only, coverage for accidents or specific diseases) are not considered to be insured.
About MEPS-HC
MEPS-HC is a nationally representative longitudinal survey that collects detailed information on health care utilization and expenditures, health insurance, and health status, as well as a wide variety of social, demographic, and economic characteristics for the civilian noninstitutionalized population. It is cosponsored by the Agency for Healthcare Research and Quality and the National Center for Health Statistics.
References
For a detailed description of the MEPS-HC survey design, sample design, and methods used to minimize sources on nonsampling error, see the following publications:
Cohen, J. Design and Methods of the Medical Expenditure Panel Survey Household Component. MEPS Methodology Report No. 1. AHCPR Pub. No. 97-0026. Rockville, Md.: Agency for Health Care Policy and Research, 1997.
Cohen, S. Sample Design of the 1996 Medical Expenditure Panel Survey Household Component. MEPS Methodology Report No. 2. AHCPR Pub. No. 97-0027. Rockville, Md.: Agency for Health Care Policy and Research, 1997.
More information about MEPS is available on the MEPS Web site: http://www.meps.ahrq.gov/.
 |
||||||||||||||||||||||||||||||||||||||||||||||||||||||||||||
|
||||||||||||||||||||||||||||||||||||||||||||||||||||||||||||
|
|
||||||||||||||||||||||||||||||||||||||||||||||||||||||||||||
 |
||||||||||||||||||||||||||||||||||||||||||||||||||||||||||||
|
||||||||||||||||||||||||||||||||||||||||||||||||||||||||||||
|
|
||||||||||||||||||||||||||||||||||||||||||||||||||||||||||||
 |
||||||||||||||||||||||||||||||||||||||||||||||||||||||||||||
|
||||||||||||||||||||||||||||||||||||||||||||||||||||||||||||
|
|
||||||||||||||||||||||||||||||||||||||||||||||||||||||||||||
 |
||||||||||||||||||||||||||||||||||||||||||||||||||||||||||||
|
||||||||||||||||||||||||||||||||||||||||||||||||||||||||||||
|
|
||||||||||||||||||||||||||||||||||||||||||||||||||||||||||||


