
|
|
Font Size:
|
||||
|
|
|
|
||||
STATISTICAL BRIEF #422:
The Uninsured in America, First Part of 2012: Estimates for the U.S. Civilian Noninstitutionalized Population under Age 65
Highlights
- During the first part of 2012, 21.6 percent of the U.S. civilian noninstitutionalized population under age 65 was uninsured.
- More than one-third of adults ages 19 to 29 lacked health insurance in the first part of 2012.
- Hispanics accounted for 18.5 percent of the nonelderly population but 30.2 percent of the nonelderly uninsured in the first part of 2012.
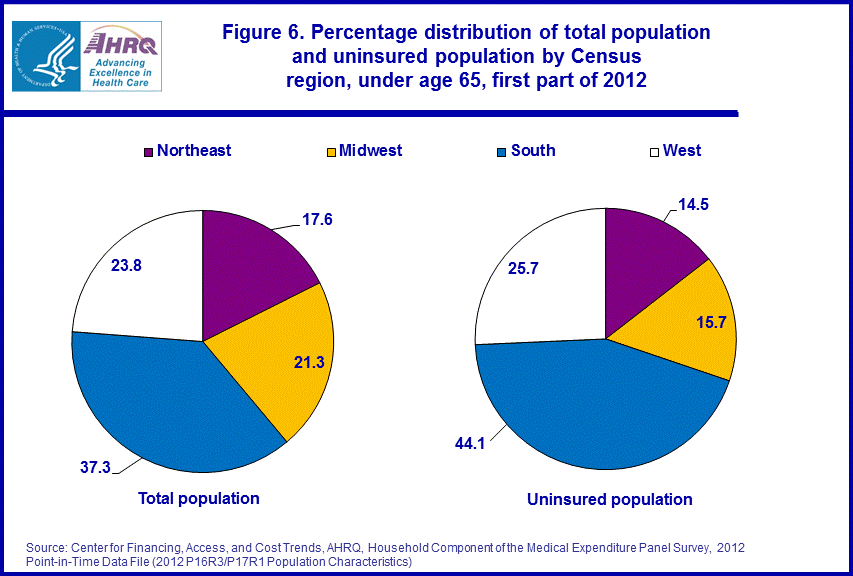
- People living in the South accounted for 37.3 percent of the nonelderly population but 44.1 percent of the nonelderly uninsured in the first part of 2012.
Introduction
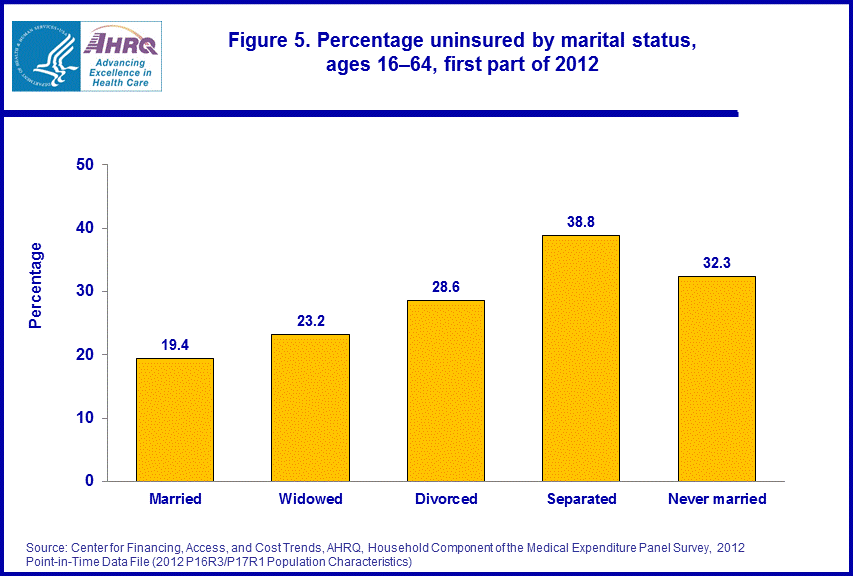
This Statistical Brief provides descriptive statistics on the U.S. civilian noninstitutionalized population under age 65 that was uninsured throughout the first part of 2012. The estimates are derived from the Household Component of the 2012 Medical Expenditure Panel Survey (MEPS-HC). Nearly all persons (99.1 percent) age 65 and older in the U.S. had some type of public or private health insurance coverage, but a notable percentage of people under age 65 did not. The data show that health insurance status varies by demographic characteristics such as age, race and ethnicity, sex, marital status, and Census region. All differences between estimates discussed in the text are statistically significant at the 0.05 level.Findings
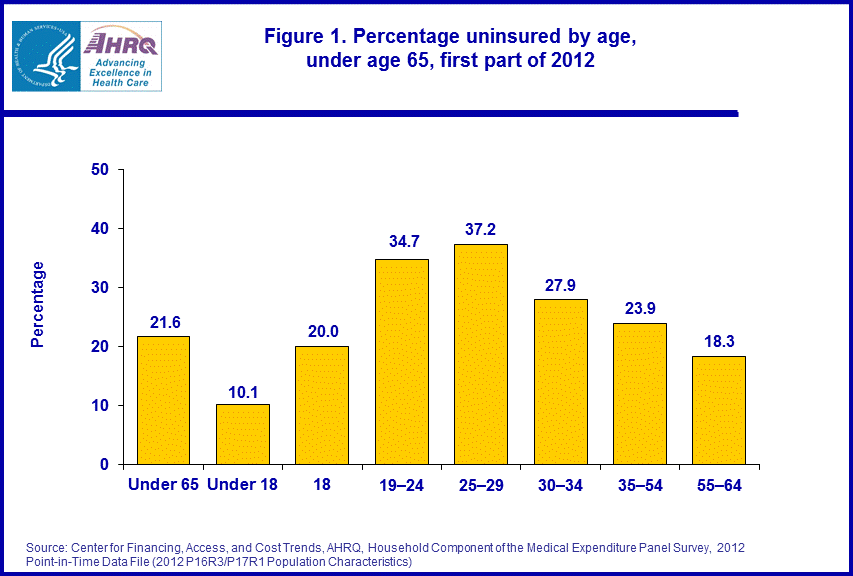
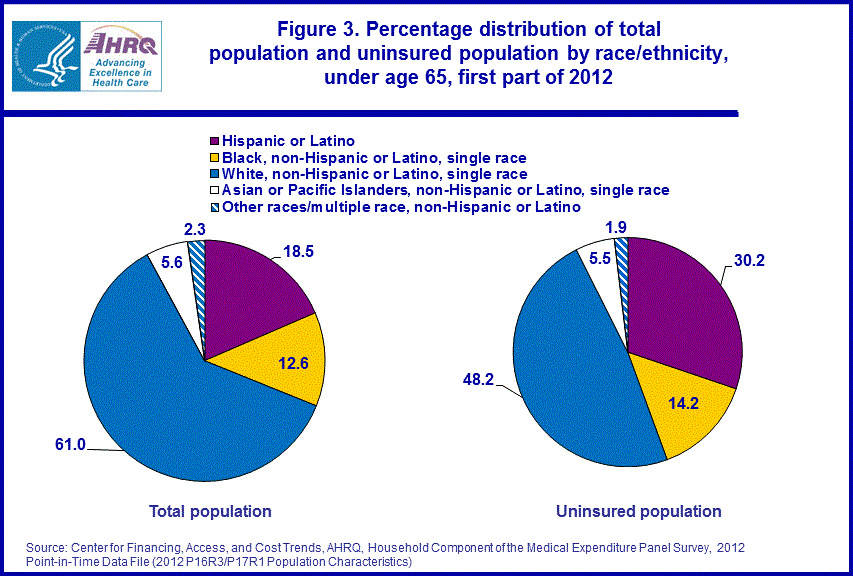
During the first part of 2012, 21.6 percent of persons under age 65 were uninsured (figure 1). This estimate does not differ significantly from 2011. Age is strongly associated with health insurance coverage. Young adults in the 19 to 24 and 25 to 29 age groups had the greatest likelihood of being uninsured, with at least a third lacking health insurance—34.7 percent and 37.2 percent, respectively. Children (under age 18) were much less likely to be uninsured (10.1 percent).Hispanics were substantially more likely than other groups to lack health insurance. Among Hispanics under age 65, 35.2 percent were uninsured during the first part of 2012, while among non-Hispanics, 24.3 percent of blacks, 21.3 percent of Asian or Pacific Islanders, 17.4 percent of other non-Hispanics, and 17.0 percent of whites lacked insurance (figure 2). Consequently, Hispanics were disproportionately represented among the uninsured. Although they comprised 18.5 percent of the non-elderly population, they accounted for 30.2 percent of non-elderly uninsured persons (figure 3).
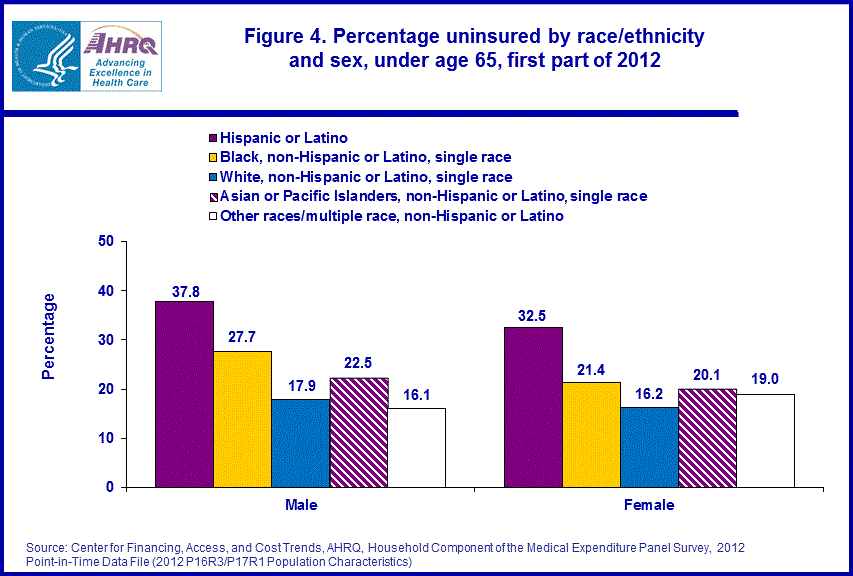
Among males under age 65, Hispanics (37.8 percent) were more likely to be uninsured than non-Hispanic blacks (27.7 percent), Asian or Pacific Islanders (22.5 percent), whites (17.9 percent), or other non-Hispanics (16.1 percent) (figure 4). Similarly, among females under age 65, being uninsured was more likely among Hispanics (32.5 percent) than among non-Hispanic blacks (21.4 percent), Asian or Pacific Islanders (20.1 percent), whites (16.2 percent), or other non-Hispanics (19.0 percent) (figure 4).
Rates of uninsurance vary by region also. People in the South were disproportionately represented among the uninsured. While they made up 37.3 percent of the total population under 65, they comprised 44.1 percent of the uninsured. In contrast, people in the Northeast and Midwest had a lower representation among the uninsured than among the total population under 65. Northeasterners accounted for 17.6 percent of the nonelderly population and 14.5 percent of the uninsured. Midwesterners comprised 21.3 percent of the population and 15.7 percent of the uninsured (figure 6).
Data Source
The estimates shown in this Statistical Brief are drawn from analyses conducted by the MEPS staff from the public use file 2012 Point-in-Time Panel 16 Round 3/Panel 17 Round 1 Population Characteristics File, and from the 2012 Household Component Health Insurance Summary Data Tables 1 through 5.Table 1. Health insurance coverage of the civilian noninstitutionalized population: Percent by type of coverage and selected population characteristics, United States, first part of 2012; http://www.meps.ahrq.gov/mepsweb/data_stats/summ_tables/hc/hlth_insr/2012/t1_a12.htm
Table 4. Total population and uninsured persons under age 65: Percent by selected population characteristics, United States, first part of 2012; http://www.meps.ahrq.gov/mepsweb/data_stats/summ_tables/hc/hlth_insr/2012/t4_d12.htm
Table 5. Health insurance coverage of the civilian noninstitutionalized population: Population estimates by type of coverage and selected population characteristics, United States, first part of 2011; http://www.meps.ahrq.gov/mepsweb/data_stats/summ_tables/hc/hlth_insr/2011/t5_e11.htm
Definitions
First part of yearThe reference period for this Statistical Brief is characterized as the first part of 2012. Respondents in Panel 16 Round 1 were interviewed between February and July 2012 and those in Panel 15 Round 3 were interviewed between January and June 2012. The reference period of the interview spans January 1 through the date of interview, and averages about two months but ranges from 1 to 6 months.
Uninsured The uninsured were defined as people not covered by Medicare, TRICARE (Armed Forces-related coverage), Medicaid, other public hospital/physician programs, or private hospital/physician insurance (including Medigap coverage) from January 2012 through the MEPS-HC interview date. People covered only by non-comprehensive State-specific programs (e.g., Maryland Kidney Disease Program) or private single service plans such as coverage for dental or vision care only, or coverage for accidents or specific diseases, were considered uninsured.
Marital status Marital status was collected in Rounds 1 and 3 for individuals age 16 and older.
About MEPS-HC
MEPS-HC is a nationally representative longitudinal survey that collects detailed information on health care utilization and expenditures, health insurance, and health status, as well as a wide variety of social, demographic, and economic characteristics for the U.S. civilian noninstitutionalized population. It is cosponsored by the Agency for Healthcare Research and Quality and the National Center for Health Statistics. For more information about MEPS, call the MEPS information coordinator at AHRQ (301-427-1656) or visit the MEPS Web site at http://www.meps.ahrq.gov/.References
For a detailed description of the MEPS-HC survey design, sample design, and methods used to minimize sources of nonsampling error, see the following publications:Cohen, J. Design and Methods of the Medical Expenditure Panel Survey Household Component. MEPS Methodology Report No. 1. AHCPR Pub. No. 97-0026. Rockville, MD. Agency for Health Care Policy and Research, 1997. http://www.meps.ahrq.gov/mepsweb/data_files/publications/mr1/mr1.shtml
Cohen, S. Sample Design of the 1996 Medical Expenditure Panel Survey Household Component. MEPS Methodology Report No. 2. AHCPR Pub. No. 97-0027. Rockville, MD. Agency for Health Care Policy and Research, 1997. http://www.meps.ahrq.gov/mepsweb/data_files/publications/mr2/mr2.shtml
Cohen, S. Design Strategies and Innovations in the Medical Expenditure Panel Survey. Medical Care. July 2003: 41(7) Supplement: III-5–III-12.
Ezzati-Rice, T.M., Rohde, F., Greenblatt, J. Sample Design of the Medical Expenditure Panel Survey Household Component, 1998–2007. Methodology Report No. 22. March 2008. Agency for Healthcare Research and Quality, Rockville, MD. http://www.meps.ahrq.gov/mepsweb/data_files/publications/mr22/mr22.shtml
Suggested Citation
Roemer, M. The Uninsured in America, First Half of 2012: Estimates for the U.S. Civilian Noninstitutionalized Population under Age 65. Statistical Brief #422. September 2013. Agency for Healthcare Research and Quality, Rockville, MD. http://www.meps.ahrq.gov/mepsweb/data_files/publications/st422/stat422.shtmlAHRQ welcomes questions and comments from readers of this publication who are interested in obtaining more information about access, cost, use, financing, and quality of health care in the United States. We also invite you to tell us how you are using this Statistical Brief and other MEPS data and tools and to share suggestions on how MEPS products might be enhanced to further meet your needs. Please email us at MEPSProjectDirector@ahrq.hhs.gov or send a letter to the address below:
Steven B. Cohen, PhD, Director
Center for Financing, Access, and Cost Trends
Agency for Healthcare Research and Quality
540 Gaither Road
Rockville, MD 20850
 |
|||||||||||||||||||||||||||
|
|||||||||||||||||||||||||||
|
|
|||||||||||||||||||||||||||
 |
|||||||||||||||||||||||||||
|
|||||||||||||||||||||||||||
|
|
|||||||||||||||||||||||||||
 |
|||||||||||||||||||||||||||
|
|||||||||||||||||||||||||||
|
|
|||||||||||||||||||||||||||
 |
|||||||||||||||||||||||||||
|
|||||||||||||||||||||||||||
|
|
|||||||||||||||||||||||||||
 |
|||||||||||||||||||||||||||
|
|||||||||||||||||||||||||||
|
|
|||||||||||||||||||||||||||
 |
|||||||||||||||||||||||||||
|
|||||||||||||||||||||||||||
|
|
|||||||||||||||||||||||||||


