
|
|
Font Size:
|
||||
|
|
|
|
||||
STATISTICAL BRIEF #453:
Employer-Sponsored Health Insurance for Retirees in the Private Sector, 2003 to 2013
Highlights
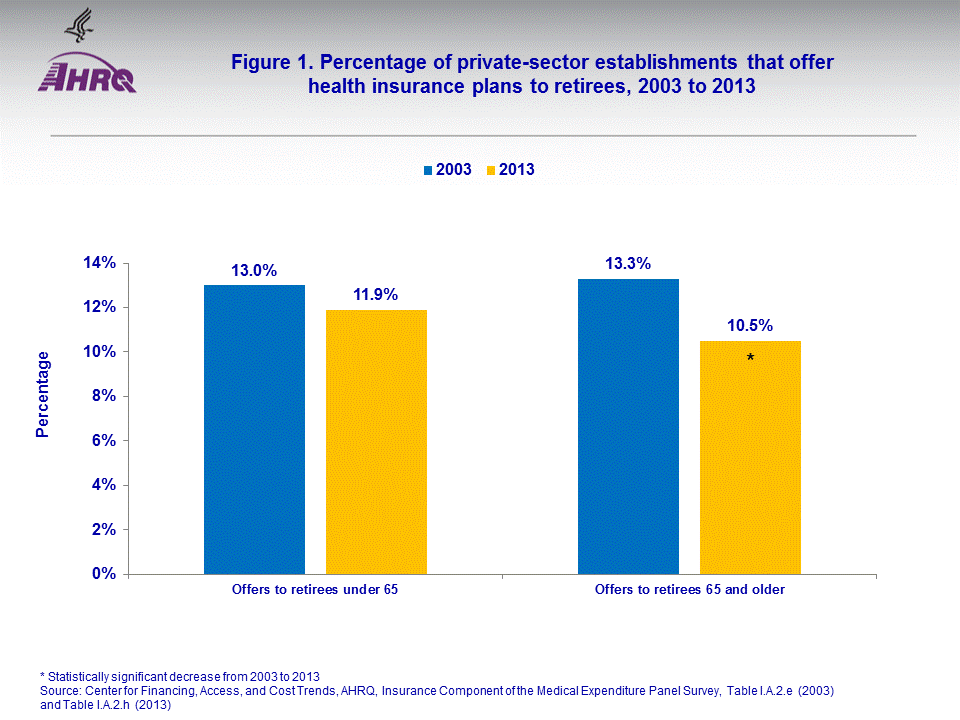
- The percentage of private-sector establishments offering employer-sponsored health insurance to retirees 65 years old and older was 2.8 percentage points lower in 2013 than in 2003 (10.5 versus 13.3 percent).
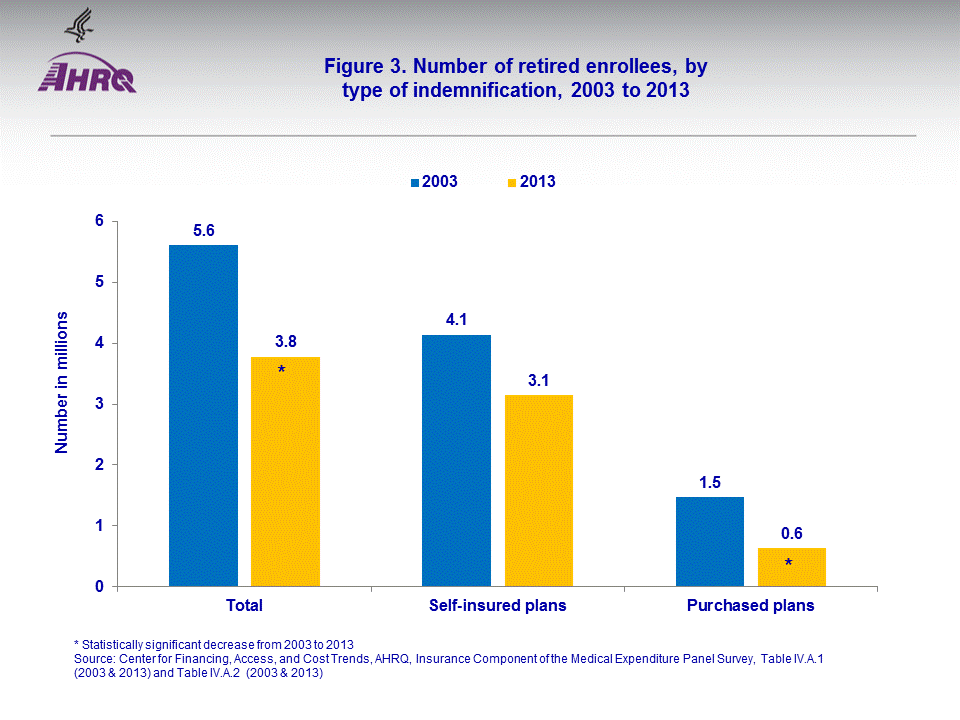
- The total number of retirees enrolled in employer-sponsored health insurance declined by 1.83 million, from 5.61 million enrollees in 2003 to 3.78 million in 2013.
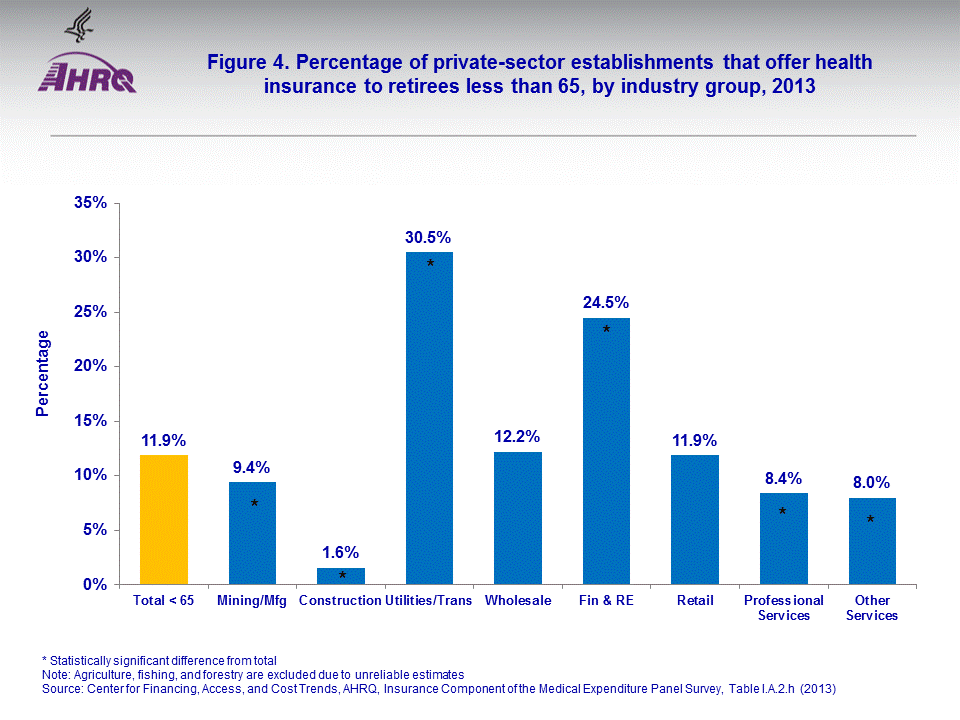
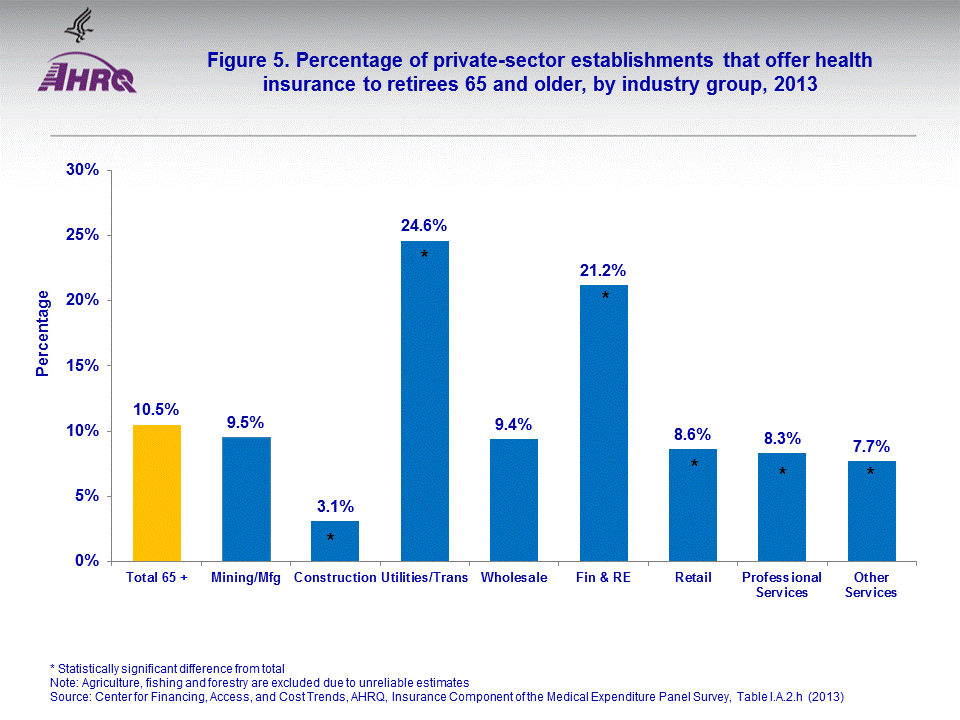
- In 2013, establishments in utilities and transportation, and financial services and real estate offered health insurance to retirees at rates above the national average.
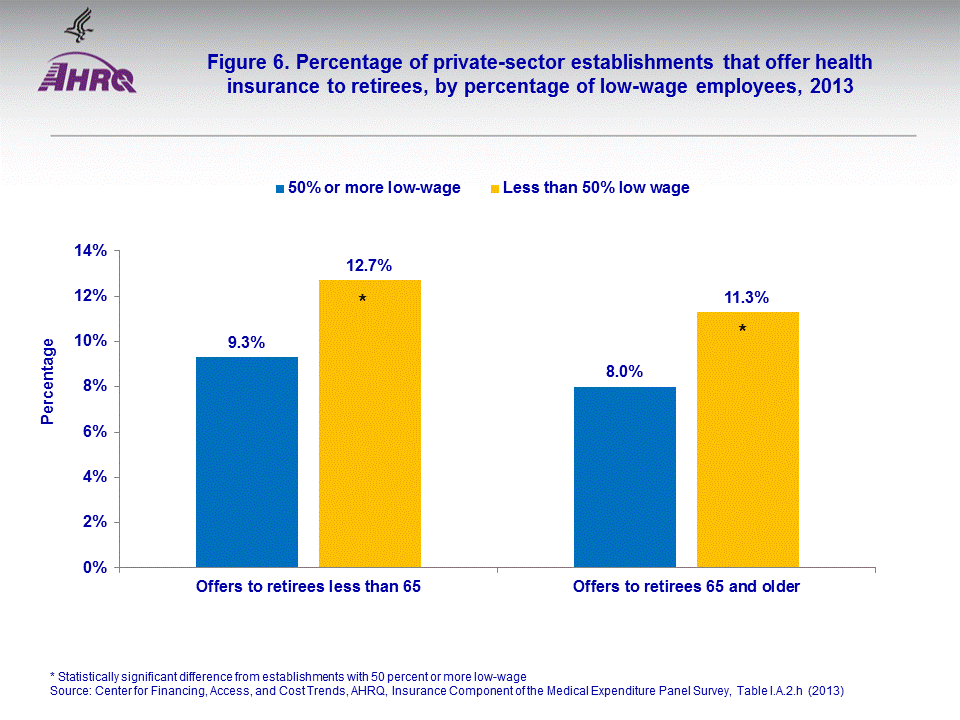
- Also in 2013, establishments with half or more of their employees classified as low-wage were less likely to offer health insurance to retirees than establishments with less than half of their employees classified as low-wage.
Introduction
Employer-sponsored health insurance for retirees is a valuable employment benefit, especially for those retirees less than 65 years old and therefore not eligible for Medicare. Using data from the 2003 and 2013 Medical Expenditure Panel Survey Insurance Component (MEPS-IC), this Statistical Brief examines trends and variation among establishments in availability of employer-sponsored health insurance for retirees in the private sector by firm size, type of indemnification, industry, percentage low-wage employees, and retiree age (less than 65 versus 65 and older). While decisions on offering insurance to retirees are generally made at the firm level, MEPS-IC collects data for individual establishments, not firms. A firm may consist of one establishment (a single physical location) or multiple establishments.Only differences between estimates at the 0.05 percent significance level are noted in the text.
Note that the data contained in this Brief come from only those establishments in the survey that offered health insurance to their active employees; establishments that offer health insurance to retirees but not to active employees are not included in the estimates presented in this Brief.
Findings
Comparing 2003 to 2013The percentage of private-sector establishments offering health insurance to retirees 65 years old and older declined 2.8 percentage points, from 13.3 percent in 2003 to 10.5 percent in 2013 (figure 1). There was not a significant change in the percentage of establishments that offered health insurance to retirees less than 65 years old. However, in 2013 a higher proportion of establishments offered health insurance to retirees less than 65 years old than to retirees 65 and older (11.9 percent versus 10.5 percent, respectively).
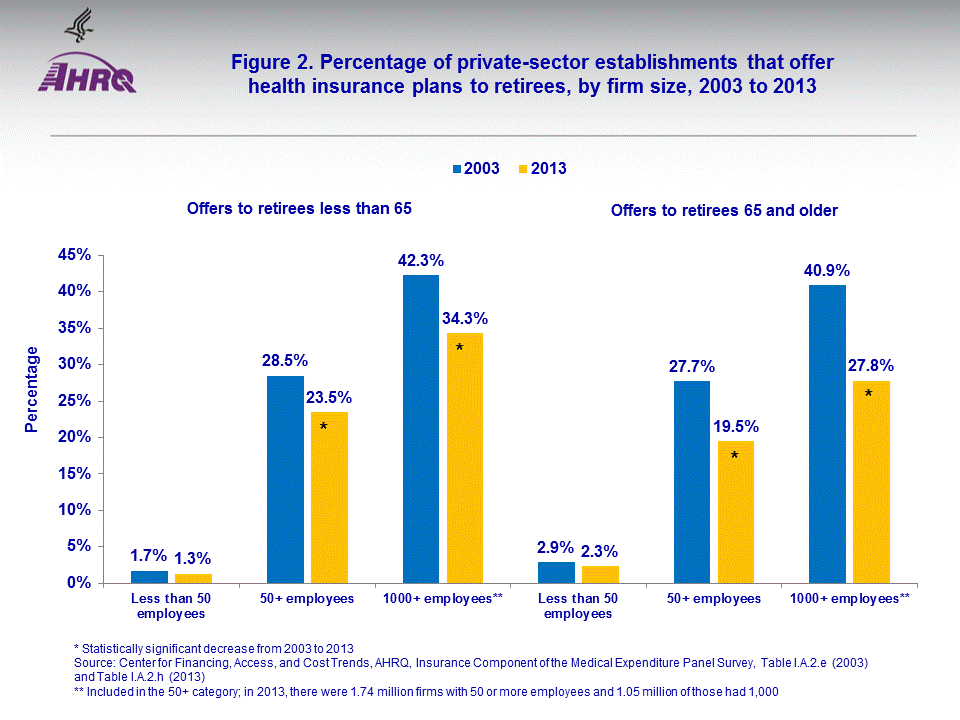
Establishments in firms with 50 or more employees, and establishments in firms with 1,000 or more employees (included in the 50 or more category), had significant declines in the percentage that offered retirees employer-sponsored health insurance, regardless of retiree age (figure 2). For establishments in firms with 50 or more employees the percentage offering health insurance to retirees less than 65 years old declined from 28.5 percent in 2003 to 23.5 percent in 2013, and the percentage offering health insurance to retirees 65 and older declined from 27.7 percent to 19.5 percent. For establishments in firms with 1,000 or more employees, the percentage offering health insurance to retirees less than 65 years old declined from 42.3 percent in 2003 to 34.3 percent in 2013, and the percentage offering health insurance to retirees 65 and older declined from 40.9 percent to 27.8 percent. Establishments in firms with less than 50 employees had no significant change in the percentage that offered retirees health insurance; however, such establishments were much less likely to offer health insurance to retirees than establishments in larger firms.
2013 results
In 2013, the percentage of establishments in firms that offered health insurance to retirees varied by industry group, as shown in figures 4 and 5. Compared to the national proportion of establishments in firms that offered insurance to retirees less than 65 years old (11.9 percent), establishments in mining and manufacturing, construction, professional services, and other services were below average (9.4 percent, 1.6 percent, 8.4 percent, and 8.0 percent, respectively). Establishments in utilities and transportation, and financial services and real estate were above average (30.5 percent and 24.5 percent, respectively) (figure 4). Compared to the national average for establishments in firms that offered insurance to retirees 65 and older (10.5 percent), establishments in construction, retail, professional services, and other services were below average (3.1 percent, 8.6 percent, 8.3 percent, and 7.7 percent, respectively). Establishments in utilities and transportation, and financial services and real estate were above average (24.6 percent and 21.2 percent, respectively) (figure 5).
Also in 2013, among establishments that offer health insurance, establishments with 50 percent or more of their employees classified as low-wage (less than $11.50 per hour) were less likely to offer health insurance to retirees, regardless of retiree age (figure 6). Only 9.3 percent of "low-wage" establishments offered insurance to retirees less than 65 years old, compared to 12.7 percent of "high-wage" establishments, and 8.0 percent of "low-wage" establishments offered insurance to retirees 65 and older, compared to 11.3 percent of "high-wage" establishments.
Data Source
This Statistical Brief summarizes data from the 2003 and 2013 MEPS-IC. The data are available on the MEPS Web site at http://www.meps.ahrq.gov/mepsweb/survey_comp/Insurance.jsp.Definitions
EmployeeA person on the actual payroll. Excludes temporary and contract workers but includes the owner or manager if that person works at the firm.
Enrollee
An employee that is enrolled in a health insurance plan offered by the employer. Enrollees do NOT include any dependents covered by the plan.
Establishment
A particular workplace or physical location where business is conducted or services or industrial operations are performed. Also known as a site. The sample is chosen at the establishment level, and the MEPS-IC data are collected at the establishment level whenever possible.
Firm
A business entity consisting of one or more establishments under common ownership or control. Also known as an enterprise. A firm represents the entire organization, including the company headquarters and all divisions, subsidiaries, and branches. A firm may consist of a single-location establishment or multiple establishments. In the case of a single-location firm, the firm and establishment are identical. Firm size is the total number of employees for the entire firm as reported on the sample frame.
Health insurance
An insurance contract that provides hospital and/or physician coverage to an employee or retiree for an agreed-upon fee (premium) for a defined benefit period.
Industry group
The classification by industry is based upon the North American Industrial Classification System, available at http://www.census.gov/eos/www/naics/. Estimates for the Agriculture, Fishing, and Forestry sector have been excluded from this analysis.
Low-wage employee
Those employees earning at or below the 25th percentile for all hourly wages in the United States based on data from the Bureau of Labor Statistics. That wage level was $11.50 in 2013.
Self-insured plan
A plan offered by employers where the financial risk for the enrollee's medical claims is assumed partially or entirely by the employer offering the plan.
About MEPS-IC
The MEPS-IC is a survey of business establishments and governments that collects information on employer-sponsored health insurance, such as whether insurance is offered, enrollments, types of plans, and premiums. The survey is conducted annually by the U.S. Census Bureau under the sponsorship of the Agency for Healthcare Research and Quality. A total sample of approximately 42,000 private-sector establishments was selected for the 2013 survey, with 6.7 percent of the sample determined to be out-of-scope during the data collection process. The response rate for the private sector was 74.6 percent of the remaining in-scope sample units.For more information on this survey, see MEPS Methodology Reports 6, 8, 10, 14, 17, 18, 27, and 28 on the MEPS Web site at http://www.meps.ahrq.gov/mepsweb/data_stats/Pub_ProdLookup_Results.jsp?ProductType=Methodology%20Report&Comp=Insurance and Insurance Component Survey Basics at http://www.meps.ahrq.gov/mepsweb/survey_comp/Insurance.jsp.
Suggested Citation
Carroll, W.A. Employer-Sponsored Health Insurance for Retirees in the Private Sector, 2003 to 2013. Statistical Brief #453. October 2014. Agency for Healthcare Research and Quality, Rockville, MD. http://www.meps.ahrq.gov/mepsweb/data_files/publications/st453/stat453.shtmlAHRQ welcomes questions and comments from readers of this publication who are interested in obtaining more information about access, cost, use, financing, and quality of health care in the United States. We also invite you to tell us how you are using this Statistical Brief and other MEPS data and tools and to share suggestions on how MEPS products might be enhanced to further meet your needs. Please email us at MEPSProjectDirector@ahrq.hhs.gov or send a letter to the address below:
Steve B. Cohen, PhD, Director
Center for Financing, Access, and Cost Trends
Agency for Healthcare Research and Quality
540 Gaither Road
Rockville, MD 20850
 |
||||||||||||||||||||||||||||
|
||||||||||||||||||||||||||||
|
|
||||||||||||||||||||||||||||
 |
||||||||||||||||||||||||||||
|
||||||||||||||||||||||||||||
|
|
||||||||||||||||||||||||||||
 |
||||||||||||||||||||||||||||
|
||||||||||||||||||||||||||||
|
|
||||||||||||||||||||||||||||
 |
||||||||||||||||||||||||||||
|
||||||||||||||||||||||||||||
|
|
||||||||||||||||||||||||||||
 |
||||||||||||||||||||||||||||
|
||||||||||||||||||||||||||||
|
|
||||||||||||||||||||||||||||
 |
||||||||||||||||||||||||||||
|
||||||||||||||||||||||||||||
|
|
||||||||||||||||||||||||||||


