|
|
Font Size:
|
||||
|
|
|
|
||||
STATISTICAL BRIEF #461:
Access to Health Care of Adult Men and Women, Ages 18-64, 2012
Highlights
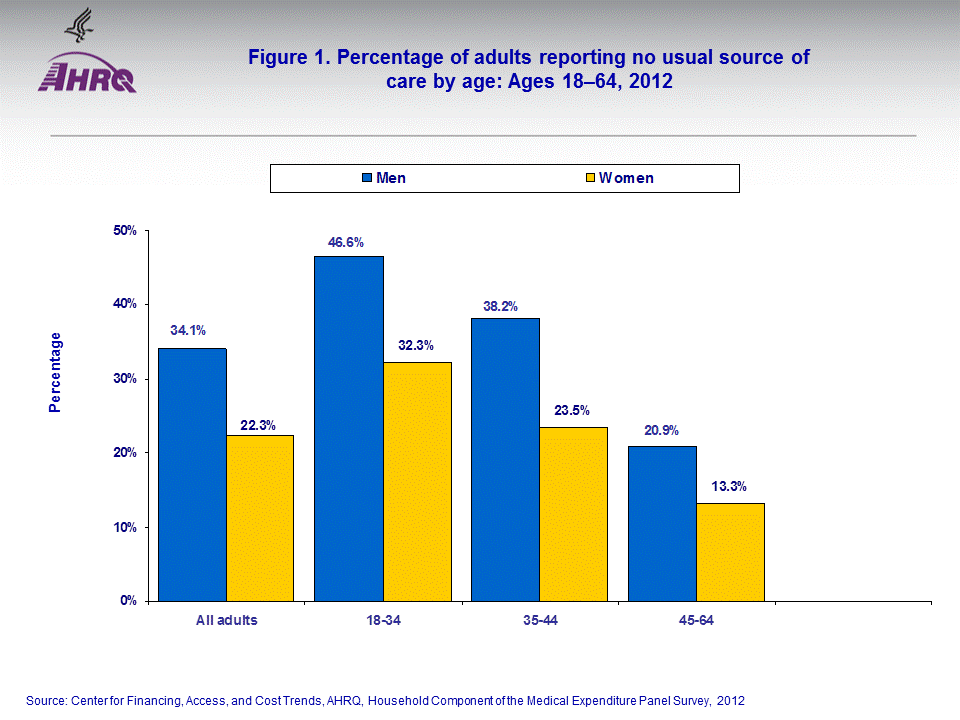
- Among nonelderly adults in 2012, men and women ages 18-34 were most likely to report having no usual source of care, at 46.6 percent and 32.3 percent, respectively.
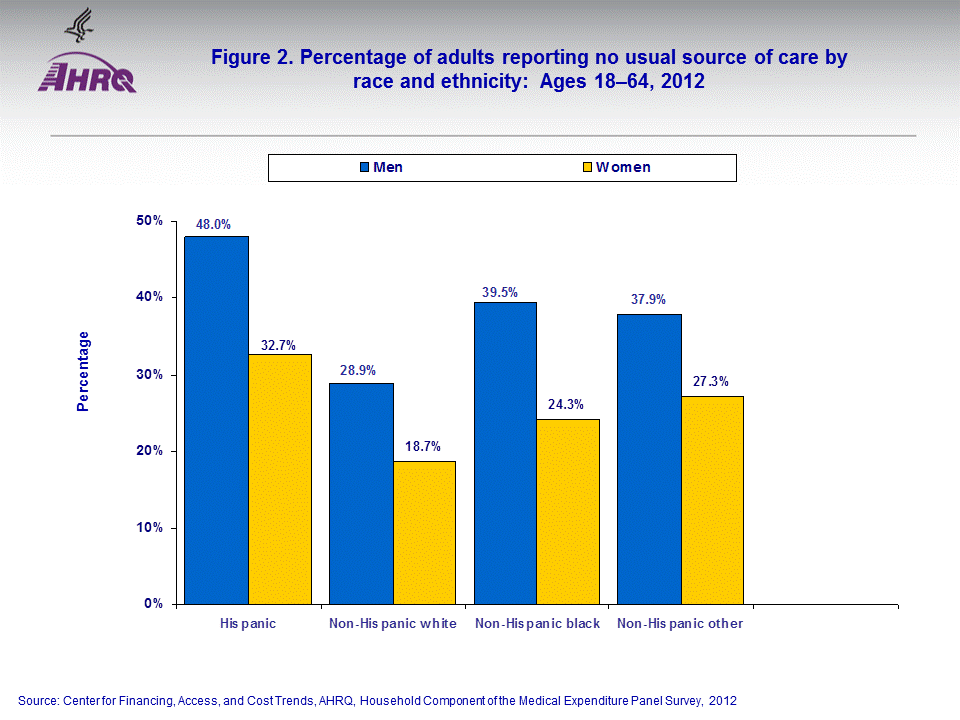
- Hispanic adults ages 18-64 were the most likely to lack a usual source of care in comparison to other race and ethnic groups in 2012 (men 48.0 percent and women 32.7 percent).
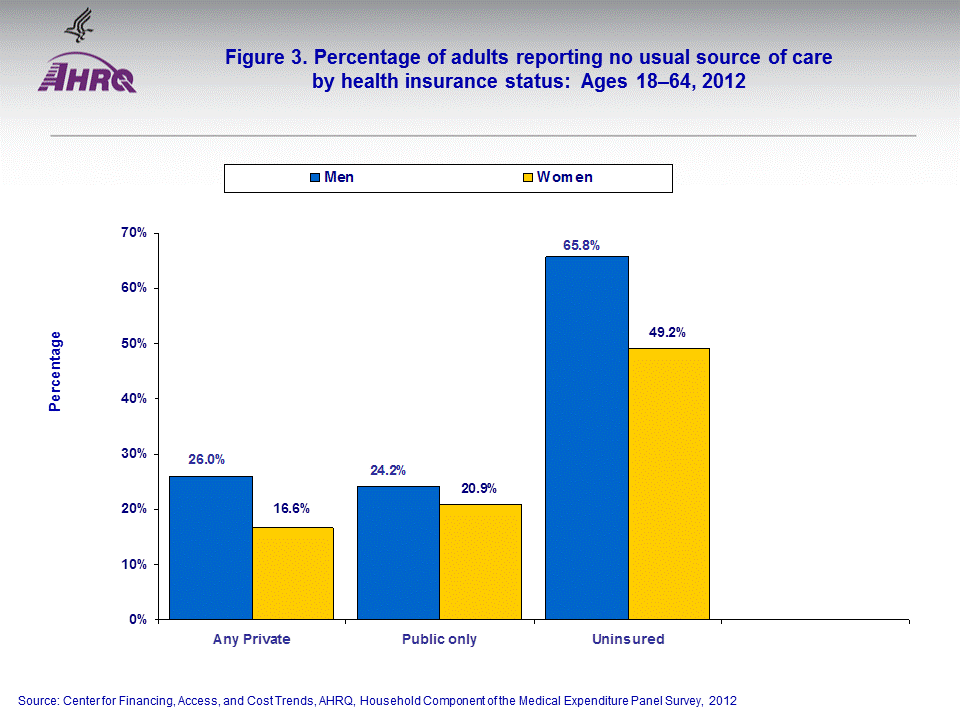
- Based on health insurance status, uninsured men and women ages 18-64 were most likely to report having no usual source of care in 2012, at 65.8 percent and 49.2 percent, respectively.
Introduction
Access to health care services is an important issue for policymakers and others affecting the U.S. health care system. One widely accepted measure of access is whether or not an individual has a usual source of care.This Statistical Brief presents estimates based on the Household Component of the Medical Expenditure Panel Survey (MEPS-HC) of the percentage of adult men and women, ages 18–64, who report no usual source of care (USC) in the U.S. civilian noninstitutionalized population. Annual estimates for 2012 are shown by type of service and health insurance coverage status. All differences between estimates noted in the text are statistically significant at the 0.05 level or better.
Findings
In 2012, about 53.4 million persons or 28.1 percent of U.S. adults under age 65 reported having no USC (data not shown in figure). Men ages 18 to 64 were more likely to report having no USC in comparison to women: 34.1 percent of men reported no USC while 22.3 percent of women reported no USC (figure 1). Men and women ages 18–34 were the most likely to lack a USC, at 46.6 percent and 32.3 percent, respectively. For adults ages 35–44, 38.2 percent of men and 23.5 percent of women lacked a USC. Women ages 45–64 were least likely to lack a USC in 2012 (13.3 percent).Hispanic adults ages 18 to 64 were most likely to report having no USC in comparison to other race and ethnic groups: 48.0 percent of Hispanic men and 32.7 percent of Hispanic women reported no USC in 2012 (figure 2). Among non-Hispanic black adults, 39.5 percent of men and 24.3 percent of women lacked a USC. In 2012, 37.9 percent of non-Hispanic other men and 27.3 percent of non-Hispanic other women reported no USC. Non-Hispanic white women were least likely to lack a USC in 2012 (18.7 percent).
Based on health insurance status, uninsured men and women ages 18–64 were most likely to report having no USC in 2012, at 65.8 percent and 49.2 percent, respectively (figure 3). Women ages 18 to 64 who had private health insurance were the least likely to lack a USC (16.6 percent).
Data Source
The estimates shown in this Statistical Brief are based on data from the 2012 Full Year Consolidated file (HC-155).Definitions
Usual source of careFor each individual family member, MEPS ascertains whether there is a particular doctor's office, clinic, health center, or other place that the individual usually goes to if he/she is sick or needs advice about his/her health.
Racial and ethnic classifications
Classification by race and ethnicity was based on information reported for each family member. Respondents were asked if each family member was Hispanic or Latino. Respondents were also asked which race or races best described each family member. Race categories included white, black/African American, American Indian or Alaska Native, Asian, Native Hawaiian or other Pacific Islander, and other. Based on these questions, sample persons were classified into the following race/ethnicity categories: Hispanic, black non-Hispanic single race, white non-Hispanic single race, and other (Asian non-Hispanic single race, Hawaiian/Pacific Islander non-Hispanic, American Indian/Alaska Native non-Hispanic, and multiple races non-Hispanic).
Health insurance status
Individuals under age 65 were classified in the following three insurance categories, based on household responses to health insurance status questions:
- Any private health insurance: Individuals who, at any time during the year, had insurance that provides coverage for hospital and physician care (other than Medicare, Medicaid/CHIP, or other public hospital/physician coverage) were classified as having private insurance. Coverage by TRICARE (Armed Forces-related coverage) was also included as private health insurance. Insurance that provides coverage for a single service only, such as dental or vision coverage, was not considered private coverage.
- Public coverage only: Individuals were considered to have public coverage only if they met both of the following criteria: 1) they were not covered by private insurance at any time during the year; and 2) they were covered by any of the following public programs at any point during the year: Medicare, Medicaid/CHIP, or other public hospital/physician coverage.
- Uninsured: The uninsured were defined as people not covered by private hospital/physician insurance, Medicare, TRICARE, Medicaid/CHIP, or other public hospital/physician programs at any time during the entire year or period of eligibility for the survey.
About MEPS-HC
MEPS-HC is a nationally representative longitudinal survey that collects detailed information on health care utilization and expenditures, health insurance, and health status, as well as a wide variety of social, demographic, and economic characteristics for the U.S. civilian noninstitutionalized population. It is cosponsored by the Agency for Healthcare Research and Quality and the National Center for Health Statistics.For more information about MEPS, call the MEPS information coordinator at AHRQ (301-427-1406) or visit the MEPS Web site at http://www.meps.ahrq.gov/.
References
For a detailed description of the MEPS survey design, sample design, and methods used to minimize sources of nonsampling errors, see the following publications:Cohen, J. Design and Methods of the Medical Expenditure Panel Survey Household Component. MEPS Methodology Report No. 1. AHCPR Pub. No. 97-0026. Rockville, MD. Agency for Health Care Policy and Research, 1997. http://www.meps.ahrq.gov/mepsweb/data_files/publications/mr1/mr1.shtml.
Cohen, S. Sample Design of the 1996 Medical Expenditure Panel Survey Household Component. MEPS Methodology Report No. 2. AHCPR Pub. No. 97-0027. Rockville, MD. Agency for Health Care Policy and Research, 1997. http://www.meps.ahrq.gov/mepsweb/data_files/publications/mr2/mr2.shtml.
Cohen, S. Design Strategies and Innovations in the Medical Expenditure Panel Survey. Medical Care, July 2003: 41(7) Supplement: III-5–III-12.
Ezzati-Rice, T.M., Rohde, F., Greenblatt, J. Sample Design of the Medical Expenditure Panel Survey Household Component, 1998–2007. Methodology Report No. 22. March 2008. Agency for Healthcare Research and Quality, Rockville, MD. http://www.meps.ahrq.gov/mepsweb/data_files/publications/mr22/mr22.shtml.
Suggested Citation
Davis, K. Access to Health Care of Adult Men and Women, Ages 18–64, 2012. Statistical Brief #461. November 2014. Agency for Healthcare Research and Quality, Rockville, MD http://www.meps.ahrq.gov/mepsweb/data_files/publications/st461/st461.shtmlAHRQ welcomes questions and comments from readers of this publication who are interested in obtaining more information about access, cost, use, financing, and quality of health care in the United States. We also invite you to tell us how you are using this Statistical Brief and other MEPS data and tools and to share suggestions on how MEPS products might be enhanced to further meet your needs. Please email us at MEPSProjectDirector@ahrq.hhs.gov or send a letter to the address below:
Steven B. Cohen, PhD, Director
Center for Financing, Access, and Cost Trends
Agency for Healthcare Research and Quality
540 Gaither Road
Rockville, MD 20850
 |
||||||||||||||||||||
|
||||||||||||||||||||
|
|
||||||||||||||||||||
 |
||||||||||||||||||||
|
||||||||||||||||||||
|
|
||||||||||||||||||||
 |
||||||||||||||||||||
|
||||||||||||||||||||
|
|
||||||||||||||||||||


