|
|
Font Size:
|
||||
|
|
|
|
||||
STATISTICAL BRIEF #470:
Trends in the Five Most Costly Conditions among the U.S. Civilian Noninstitutionalized Population, 2002 and 2012
Highlights
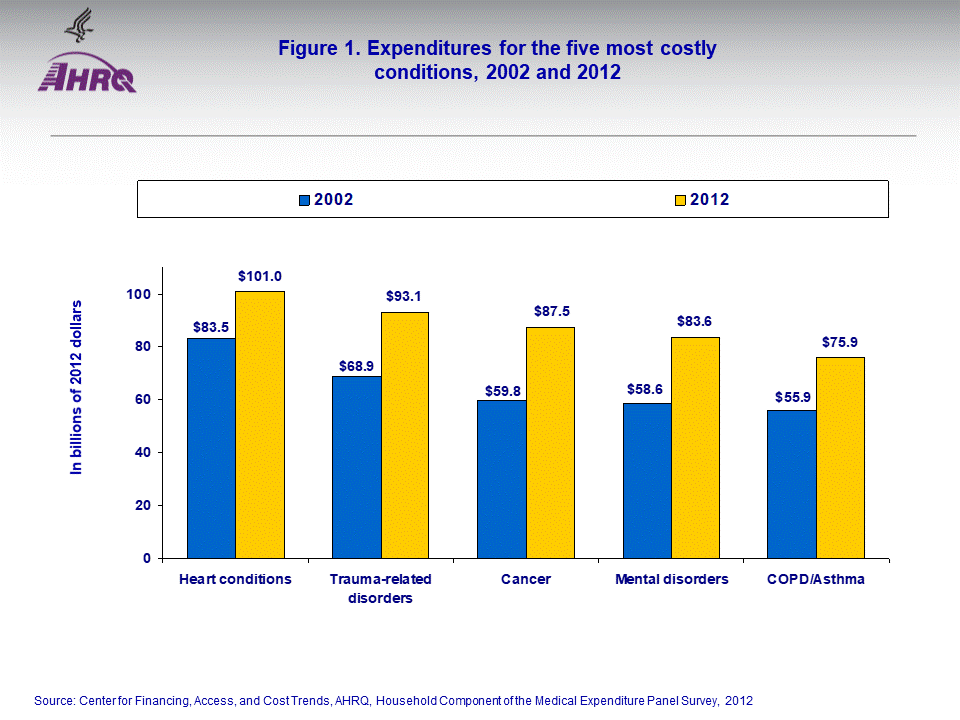
- The same five medical conditions—heart conditions, cancer, trauma-related disorders, mental disorders, and chronic obstructive pulmonary disease (COPD) and asthma—were ranked highest for medical spending in both 2002 and 2012.
- Heart conditions accounted for the highest total spending in both 2002 and 2012.
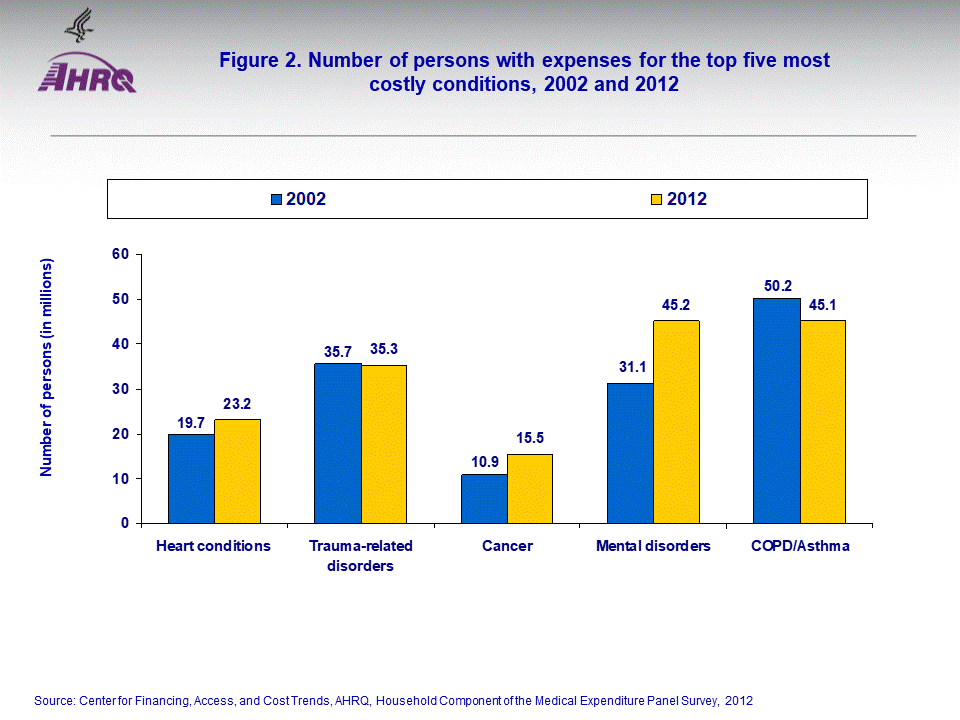
- The number of people with expenses for mental disorders increased from 31 million in 2002 to 45 million in 2012.
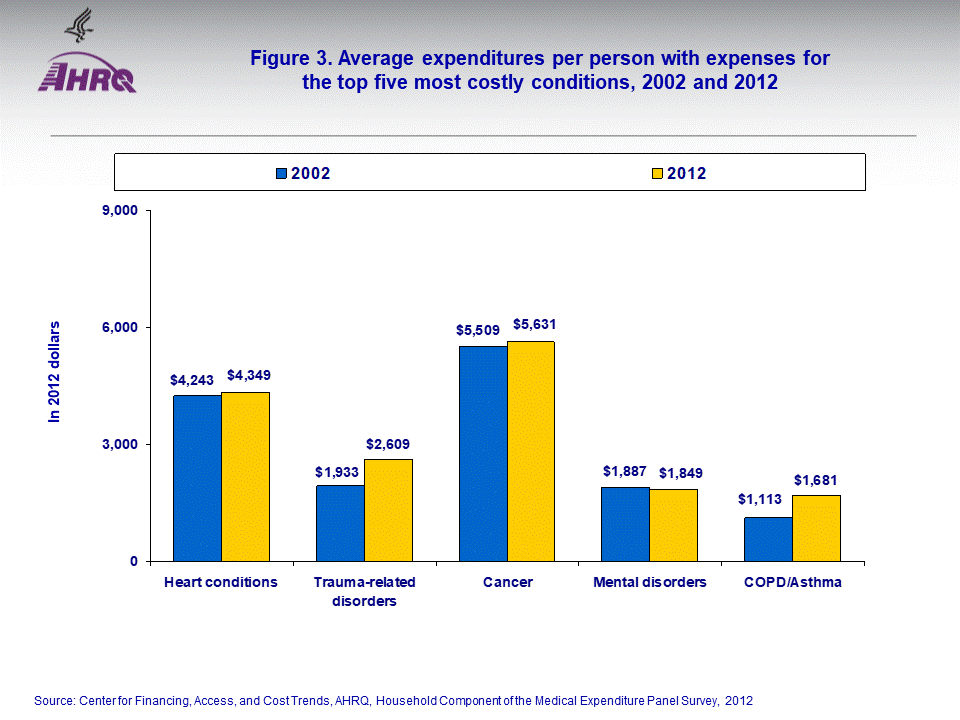
- Among these five medical conditions, mean expenditures per person were highest for cancer and heart conditions in both 2002 and 2012.
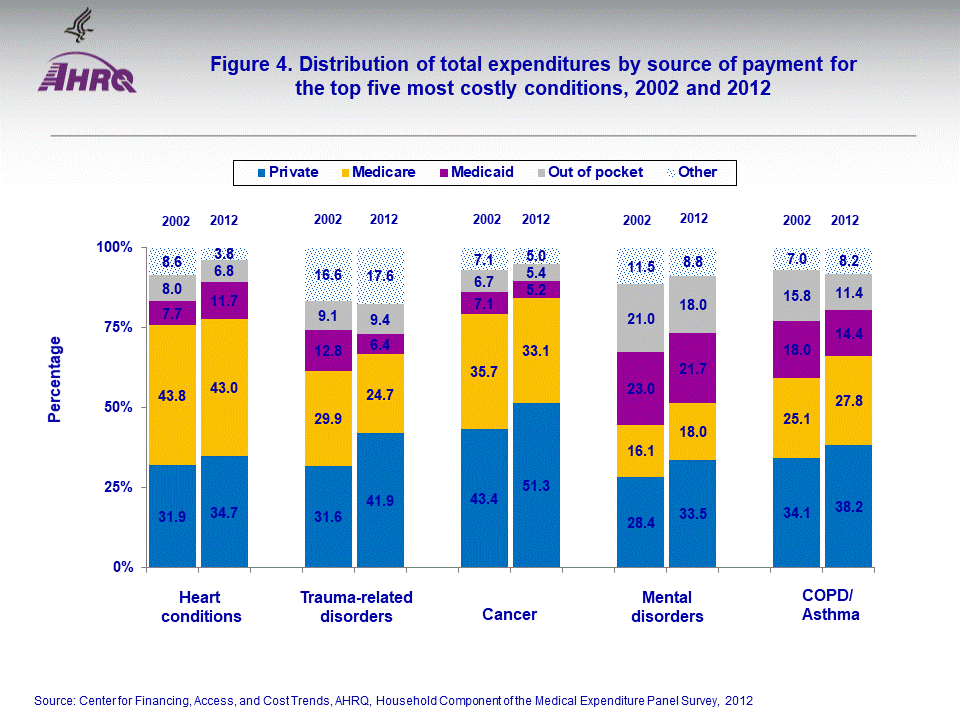
- The percentage of out-of-pocket expenses was highest for the treatment of mental disorders in both 2002 and 2012 among the top five most expensive conditions.
Introduction
This Statistical Brief presents data from the Household Component of the Medical Expenditure Panel Survey (MEPS-HC) regarding medical expenditures associated with the top five most costly conditions in 2002 and 2012. The top five conditions were determined by totaling and ranking the expenses for the medical care delivered for the diagnosis and treatment of acute and chronic conditions. Expenditures may be associated with more than one condition and are not unduplicated in the condition totals. Only differences between estimates that are statistically significant at the 0.05 level are discussed in the text. Dollar values are adjusted for inflation by using the gross domestic product (GDP) implicit price deflator.Findings
In terms of health care expenditures, the same five conditions were ranked among the five most costly conditions in 2002 and 2012. There was an increase in the expenditures for each of these conditions when comparing both years. The five most costly conditions were: heart conditions, trauma-related disorders, cancer, chronic obstructive pulmonary disease (COPD) and asthma, and mental disorders. During this period, the largest increase in expenditures was for cancer. The expenditures for cancer rose from $59.8 billion in 2002 (in 2012 dollars) to $87.5 billion in 2012. Medical expenditures on chronic obstructive pulmonary disease (COPD) and asthma also increased substantially from $55.9 billion in 2002 (in 2012 dollars) to $75.9 billion in 2012 (figure 1).The number of people with expenditures associated with these conditions increased from 2002 to 2012 for three of the five conditions. The biggest increase in number of people with expenditures was for mental disorders (31.1 million to 45.2 million) (figure 2).
The percentage of expenses paid out of pocket (OOP) was highest for the treatment of mental disorders in both 2002 and 2012 (21.0 percent and 18.0 percent, respectively) among the top five conditions. Medicare paid a similar percentage of expenses for the treatment of heart conditions in both of these years (43.8 percent in 2002 and 43.0 percent in 2012) (figure 4). This trend was repeated for expenditures on cancer treatment. Medicare paid about one-third of cancer treatment expenses in both years (35.7 percent in 2002 and 33.1 percent in 2012).
Data Source
The estimates shown in this Statistical Brief are based on data from the MEPS 2002 and 2012 Full Year Consolidated Data File (HC-070 and HC-155), Medical Conditions File (HC-069 and HC-154), Office-Based Medical Provider Visits File (HC-067G and HC-152G), Outpatient Visits File (HC-067F and HC-152F), Hospital Inpatient Stays File (HC-067D and HC-152D), Home Health File (HC-067H and HC-152H), Emergency Room Visits File (HC-067E and HC-152E), and Prescribed Medicines File (HC-067A and HC-152A).Definitions
Medical conditionsCondition data were collected from household respondents during each round as verbatim text and coded by professional coders using the International Classification of Diseases, Ninth Revision (ICD-9). ICD-9-CM condition codes were then aggregated into clinically meaningful categories that group similar conditions using the Clinical Classification System (CCS) software. Categories were collapsed when appropriate. The reported ICD-9-CM condition code values were mapped to the appropriate clinical classification category prior to being collapsed to 3-digit ICD-9-CM condition codes. The result is that every record which has an ICD-9-CM diagnosis code also has a clinical classification code.
Expenditures
Expenditures in MEPS are defined as payments from all sources for hospital inpatient care, ambulatory care provided in offices and hospital outpatient departments, care provided in emergency departments, paid care provided in the patient's home (home health), and the purchase of prescribed medicines. Sources include direct payments from individuals, private insurance, Medicare, Medicaid, Workers' Compensation, and miscellaneous other sources. Payments for over-the-counter drugs are not included in MEPS total expenditures. Indirect payments not related to specific medical events, such as Medicaid Disproportionate Share and Medicare Direct Medical Education subsidies, are also excluded.
Expenditures were classified as being associated with a condition if a visit, stay, or medication purchase was cited as being related to the specific condition. Expenditures may be associated with more than one condition and are not unduplicated in the condition totals; summing over conditions would double-count some expenses. Total spending does not include amounts for other medical expenses, such as durable and nondurable supplies, medical equipment, eyeglasses, ambulance services, and dental expenses, because these items could not be linked to specific conditions.
Sources of payment
- Private insurance: This category includes payments made by insurance plans covering hospital and other medical care (excluding payments from Medicare, Medicaid, and other public sources), Medigap plans, and TRICARE (Armed Forces-related coverage).
- Medicare: Medicare is a federally financed health insurance plan for the elderly, persons receiving Social Security disability payments, and persons with end-stage renal disease. Medicare Part A, which provides hospital insurance, is automatically given to those who are eligible for Social Security. Medicare Part B provides supplementary medical insurance that pays for medical expenses and can be purchased for a monthly premium. Medicare Part D, which started in 2006, covers prescription drug expenses.
- Medicaid/CHIP: This category includes payments made by the Medicaid and CHIP programs which are means-tested government programs financed jointly by federal and state funds that provide health care to those who are eligible. Medicaid is designed to provide health coverage to families and individuals who are unable to afford necessary medical care while CHIP provides coverage to additional low-income children not eligible for Medicaid. Eligibility criteria for both programs vary significantly by state.
- Out of pocket: This category includes expenses paid by the user or other family member.
- Other sources: This category includes payments from other federal sources such as Indian Health Service, military treatment facilities, and other care provided by the federal government; various state and local sources (community and neighborhood clinics, state and local health departments, and state programs other than Medicaid/CHIP); various unclassified sources (e.g., automobile, homeowner's, or other liability insurance, and other miscellaneous or unknown sources); Medicaid/CHIP payments reported for persons who were not reported as enrolled in the Medicaid or CHIP programs at any time during the year; and private insurance payments reported for persons without any reported private health insurance coverage during the year.
About MEPS-HC
MEPS-HC is a nationally representative longitudinal survey that collects detailed information on health care utilization and expenditures, health insurance, and health status, as well as a wide variety of social, demographic, and economic characteristics for the U.S. civilian noninstitutionalized population. It is cosponsored by the Agency for Healthcare Research and Quality and the National Center for Health Statistics.References
For a detailed description of the MEPS-HC survey design, sample design, and methods used to minimize sources on non-sampling errors, see the following publications:Cohen, J. Design and Methods of the Medical Expenditure Panel Survey Household Component. MEPS Methodology Report No. 1. AHCPR Pub. No. 97-0026. Rockville, MD: Agency for Health Care Policy and Research, 1997. http://www.meps.ahrq.gov/mepsweb/data_files/publications/mr1/mr1.shtml
Cohen, S. Sample Design of the 1996 Medical Expenditure Panel Survey Household Component. MEPS Methodology Report No. 2. AHCPR Pub. No. 97-0027. Rockville, MD: Agency for Health Care Policy and Research, 1997. http://www.meps.ahrq.gov/mepsweb/data_files/publications/mr2/mr2.shtml
Cohen, S. Design Strategies and Innovations in the Medical Expenditure Panel Survey. Medical Care, July 2003: 41(7) Supplement: III-5–III-12.
Cohen, J. and Krauss, N. Spending and Service Use among People with the Fifteen Most Costly Medical Conditions, 1997. Health Affairs; 22(2):129–138, 2003.
Suggested Citation
Soni, A. Trends in the Five Most Costly Conditions among the U.S. Civilian Noninstitutionalized Population, 2002 and 2012. Statistical Brief #470. April 2015. Agency for Healthcare Research and Quality, Rockville, MD. http://www.meps.ahrq.gov/mepsweb/data_files/publications/st470/stat470.shtmlAHRQ welcomes questions and comments from readers of this publication who are interested in obtaining more information about access, cost, use, financing, and quality of health care in the United States. We also invite you to tell us how you are using this Statistical Brief and other MEPS data and tools and to share suggestions on how MEPS products might be enhanced to further meet your needs. Please email us at MEPSProjectDirector@ahrq.hhs.gov or send a letter to the address below:
Steven B. Cohen, PhD, Director
Center for Financing, Access, and Cost Trends
Agency for Healthcare Research and Quality
540 Gaither Road
Rockville, MD 20850
 |
||||||||||||||||||||||||||||||||||||||||||||||||||||||||||||||||||||||||||||||||||||||||
|
||||||||||||||||||||||||||||||||||||||||||||||||||||||||||||||||||||||||||||||||||||||||
|
|
||||||||||||||||||||||||||||||||||||||||||||||||||||||||||||||||||||||||||||||||||||||||
 |
||||||||||||||||||||||||||||||||||||||||||||||||||||||||||||||||||||||||||||||||||||||||
|
||||||||||||||||||||||||||||||||||||||||||||||||||||||||||||||||||||||||||||||||||||||||
|
|
||||||||||||||||||||||||||||||||||||||||||||||||||||||||||||||||||||||||||||||||||||||||
 |
||||||||||||||||||||||||||||||||||||||||||||||||||||||||||||||||||||||||||||||||||||||||
|
||||||||||||||||||||||||||||||||||||||||||||||||||||||||||||||||||||||||||||||||||||||||
|
|
||||||||||||||||||||||||||||||||||||||||||||||||||||||||||||||||||||||||||||||||||||||||
 |
||||||||||||||||||||||||||||||||||||||||||||||||||||||||||||||||||||||||||||||||||||||||
|
||||||||||||||||||||||||||||||||||||||||||||||||||||||||||||||||||||||||||||||||||||||||
|
|
||||||||||||||||||||||||||||||||||||||||||||||||||||||||||||||||||||||||||||||||||||||||


