Skip to main content

|
|||||||||||||||
|
|
|||||||||||||||
STATISTICAL BRIEF #510:
|
|||||||||||||||
| April 2018 | |||||||||||||||
|
Jessica Vistnes, PhD and Joel Cohen, PhD |
|||||||||||||||
Highlights
|
|||||||||||||||
IntroductionUnderstanding the dynamics of health insurance coverage is important for evaluating the effects of changes to the U.S. health insurance market. While previous research has examined the prior health insurance coverage of individuals who enrolled in newly available Marketplace plans in 2014 (Vistnes and Cohen, 2016; Carman, Eibner, and Paddock, 2014; Graves and Nikpay, 2017), until recently, survey data has not been available to examine the stability of Marketplace coverage after individuals enrolled.In this Statistical Brief, we examine transitions in coverage for Marketplace enrollees by utilizing the longitudinal dimension of the Medical Expenditure Panel Survey Household Component (MEPS-HC). We also compare rates of retaining Marketplace coverage with rates of retaining other types of health coverage between 2014 and 2015. For these analyses, we include adults that began participating in the MEPS-HC in either 2013 or 2014, were in the survey for the entire two years, and were between the ages of 18 and 64 for the entire two-year period. When examining the prior coverage status of Marketplace enrollees, we categorize their insurance status from January of the year before their first Marketplace enrollment (either 2014 or 2015) up until the month prior to that enrollment. We also examine the December 2015 insurance status of the 5.6 million adults estimated to have Marketplace coverage in the MEPS-HC in December 2014. All differences between estimates discussed in the text are statistically significant at the 0.05 level or better, using a two-tailed test unless otherwise noted. |
|||||||||||||||
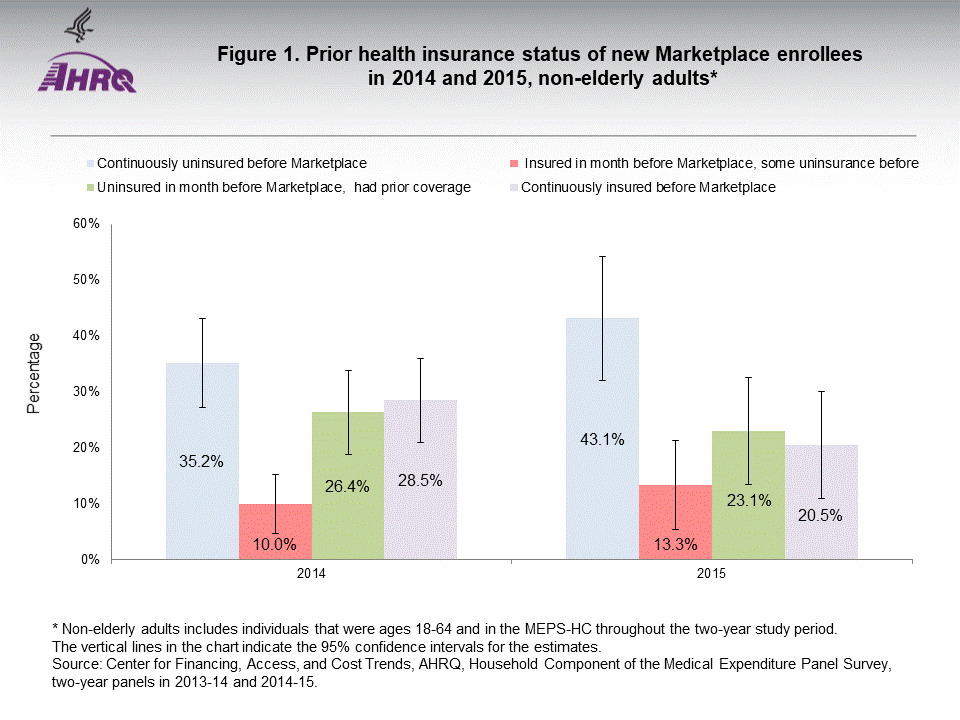
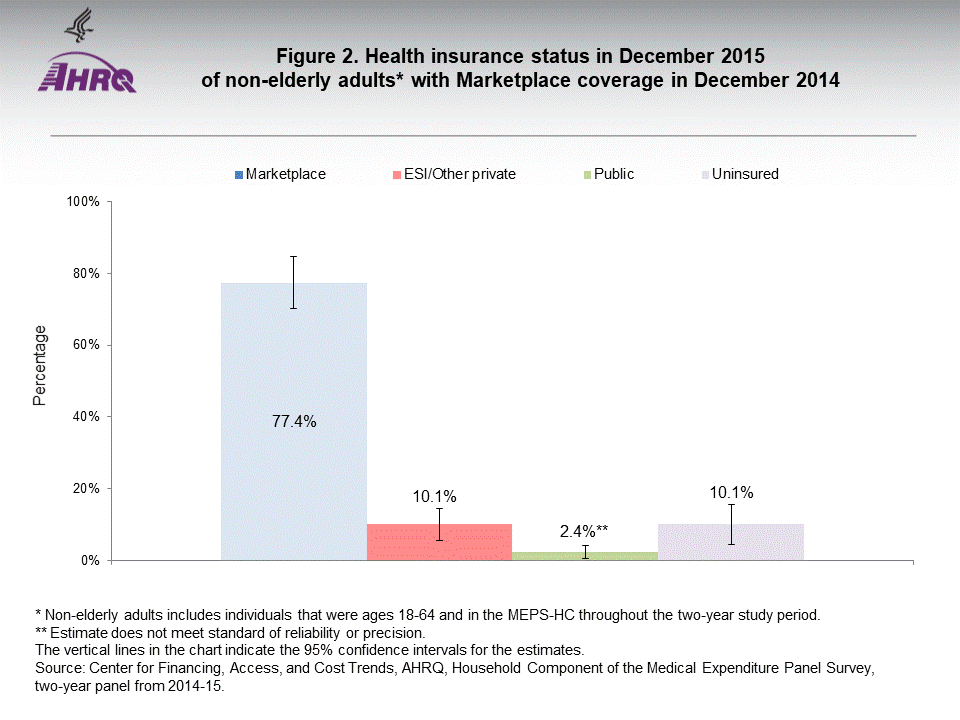
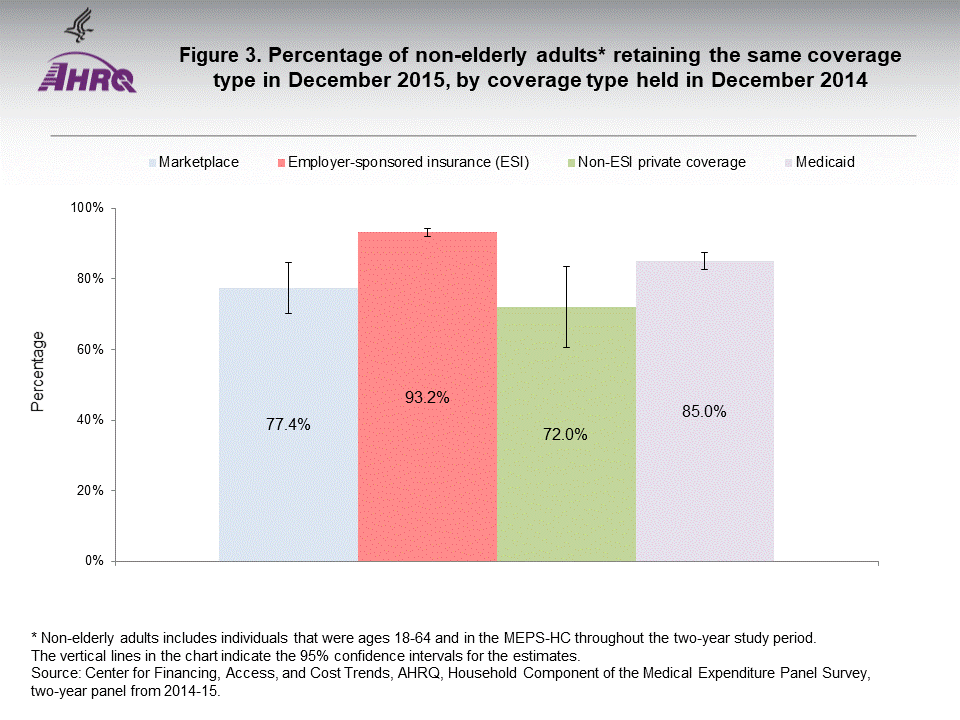
FindingsFigure 1 shows the patterns of prior insurance coverage of adults who were newly enrolled in Marketplace coverage in either 2014 or 2015. We find no statistically significant differences in the patterns of prior coverage between new Marketplace enrollees in the two years. As shown in figure 1, 35.2 percent and 43.1 percent of new Marketplace enrollees in 2014 and 2015, respectively, were continuously uninsured prior to obtaining Marketplace coverage. An additional 10.0 percent and 13.3 percent, respectively, had insurance in the month prior to their Marketplace coverage but had some prior experience with being uninsured. Another 26.4 percent and 23.1 percent of new 2014 and 2015 Marketplace enrollees, respectively, lost prior coverage held earlier in the period and were uninsured in the month before they enrolled. Finally, 28.5 percent and 20.5 percent of Marketplace enrollees had continuous coverage prior to their Marketplace enrollment.Figure 2 focuses on non-elderly adults with Marketplace coverage in December 2014, and shows their insurance status a year later. In December 2015, the vast majority, 77.4 percent, retained their Marketplace coverage, 10.1 percent transitioned to employer-sponsored insurance (ESI) or other non-Marketplace private coverage, and 10.1 percent were uninsured. The remainder transitioned to public coverage. Comparing rates of retaining Marketplace coverage to rates for other types of coverage (figure 3), we do not find a significant difference between rates of retaining Marketplace or non-ESI private coverage in this time period (77.4 percent for Marketplace and 72.0 percent for non-ESI private coverage), but Marketplace enrollees were less likely to retain their coverage than either ESI (93.2 percent) or Medicaid (85.0 percent, p < 0.10) enrollees. |
|||||||||||||||
Data SourceThe estimates shown in this Statistical Brief are drawn from analyses conducted by the MEPS staff using variables from the following MEPS public use files: HC-163, HC-171, and HC-181. The panel-specific weights used in the analyses are from MEPS files HC-172 and HC-183. |
|||||||||||||||
DefinitionsUninsuredThe uninsured were defined as people not covered by Medicaid, Medicare, TRICARE (Armed Forces-related coverage), other public hospital/physician programs, private hospital/physician insurance (including Medigap coverage), or insurance purchased through health insurance Marketplaces established in accordance with the Affordable Care Act. People covered by only non-comprehensive State-specific programs (e.g., Maryland Kidney Disease Program) or private single service plans such as coverage for dental or vision care only, or coverage for accidents or specific diseases, were considered uninsured. Coverage type in December For the estimates in figures 2 and 3, individuals were placed into hierarchical insurance categories in the following order: Marketplace coverage, employer-sponsored insurance (ESI), non-ESI private coverage, Medicaid, and other public coverage. In figure 2, the categories for ESI and non-ESI private coverage were combined and the categories for Medicaid and other public coverage were combined. Population covered Persons included in this analysis were in the survey for the entire two-year period of eligibility and were ages 1864 for the entire two-year period of eligibility. This restriction excludes individuals who were institutionalized, left the country or died during the two-year period and those who joined the household after January of the first year of the two-year period. |
|||||||||||||||
About MEPS-HCMEPS-HC is a nationally representative longitudinal survey that collects detailed information on health care utilization and expenditures, health insurance, and health status, as well as a wide variety of social, demographic, and economic characteristics for the U.S. civilian noninstitutionalized population. It is cosponsored by the Agency for Healthcare Research and Quality and the National Center for Health Statistics.For more information about MEPS, call the MEPS information coordinator at AHRQ (3014271406) or visit the MEPS Web site at https://meps.ahrq.gov/mepsweb/index.jsp |
|||||||||||||||
ReferencesVistnes, J. and Cohen, J. Gaining Coverage in 2014: New Estimates of Marketplace and Medicaid Transitions. Health Affairs (Millwood), 2016: 35(10):18251829.Carman, K.G., Eibner, C., and Paddock, S.M. Trends in Health Insurance Enrollment, 201315. Health Affairs (Millwood), 2014: 34(6):10441048. Graves, J.A. and Nikpay S. The Changing Dynamics of US Health Insurance and Implications for the Future of the Affordable Care Act. Health Affairs (Millwood), 2017: 36(2):297305. |
|||||||||||||||
Suggested CitationVistnes, J. and Cohen, J. Transitions in Health Insurance Status: Longitudinal Data from the MEPS Household Component, 20132015. Statistical Brief #510. April 2018. Agency for Healthcare Research and Quality, Rockville, MD. http://www.meps.ahrq.gov/mepsweb/data_files/publications/st510/stat510.shtml |
|||||||||||||||
|
AHRQ welcomes questions and comments from readers of this publication who are interested in obtaining more information about access, cost, use, financing, and quality of health care in the United States. We also invite you to tell us how you are using this Statistical Brief and other MEPS data and tools and to share suggestions on how MEPS products might be enhanced to further meet your needs. Please email us at MEPSProjectDirector@ahrq.hhs.gov or send a letter to the address below: Joel Cohen, PhD, Director Center for Financing, Access, and Cost Trends Agency for Healthcare Research and Quality 5600 Fishers Lane, Mailstop 07W41A Rockville, MD 20857 |
|||||||||||||||
 |
|||||||||||||||
* Non-elderly adults includes individuals that were ages 18-64 and in the MEPS-HC throughout the two-year study period. |
|||||||||||||||
 |
|||||||||||||||
* Non-elderly adults includes individuals that were ages 18-64 and in the MEPS-HC throughout the two-year study period. |
|||||||||||||||
 |
|||||||||||||||
* Non-elderly adults includes individuals that were ages 18-64 and in the MEPS-HC throughout the two-year study period. |
|||||||||||||||
|
| |||||||||||||||