Skip to main content
|
|||||||||||||||||||||||||||||||||||||||||||||||||||||||||||||||||||||||||||||||||||||||||||||||||||||||||||||||||||||||||||||||||||||||||||||||||||||||||||||||||||||||||||||||||||||||||||||||||||||||||||||||||
|
|
|||||||||||||||||||||||||||||||||||||||||||||||||||||||||||||||||||||||||||||||||||||||||||||||||||||||||||||||||||||||||||||||||||||||||||||||||||||||||||||||||||||||||||||||||||||||||||||||||||||||||||||||||
STATISTICAL BRIEF #512:
|
|||||||||||||||||||||||||||||||||||||||||||||||||||||||||||||||||||||||||||||||||||||||||||||||||||||||||||||||||||||||||||||||||||||||||||||||||||||||||||||||||||||||||||||||||||||||||||||||||||||||||||||||||
| May 2018 | |||||||||||||||||||||||||||||||||||||||||||||||||||||||||||||||||||||||||||||||||||||||||||||||||||||||||||||||||||||||||||||||||||||||||||||||||||||||||||||||||||||||||||||||||||||||||||||||||||||||||||||||||
|
James B. Kirby, PhD and Pradip Muhuri, PhD |
|||||||||||||||||||||||||||||||||||||||||||||||||||||||||||||||||||||||||||||||||||||||||||||||||||||||||||||||||||||||||||||||||||||||||||||||||||||||||||||||||||||||||||||||||||||||||||||||||||||||||||||||||
Highlights
|
|||||||||||||||||||||||||||||||||||||||||||||||||||||||||||||||||||||||||||||||||||||||||||||||||||||||||||||||||||||||||||||||||||||||||||||||||||||||||||||||||||||||||||||||||||||||||||||||||||||||||||||||||
IntroductionBefore the early 20th century, people living in rural areas typically enjoyed better health than those in urban areas. Today, however, a distinct rural health disadvantage is well documented (Cosby et al. 2008; Cossman et al. 2010; James 2014). Explanations for this reversal in the rural-urban health gap vary, but differential access to medical care is often assumed as one possible causal mechanism. In this Statistical Brief, we used data from the Medical Expenditure Panel Survey Household Component (MEPS-HC), pooled for the years 2014 and 2015, to examine three core measures of ambulatory care access across the Rural-Urban Continuum Codes developed by the United States Department of Agriculture (USDA): the percentage of people uninsured, the percentage without a usual source of care, and the percentage reporting unmet need for medical care, dental care, or prescription drugs. Unless otherwise noted, all differences discussed in the text are statistically significant at the 0.05 level or better.The Rural-Urban Continuum Codes divide counties into three metropolitan (metro) and six nonmetropolitan (non-metro) categories. In this Brief, metro counties are stratified into the three standard groups based on population of their metro areas (greater than 1 million, between 250,000 and 1 million, and less than 250,000). Non-metro counties are collapsed into four categories based on proximity to a metro county (i.e., "adjacent" versus "non-adjacent" counties1) and two urban population size groups (counties with urban populations of 20,000 people or more and those with fewer than 20,000). |
|||||||||||||||||||||||||||||||||||||||||||||||||||||||||||||||||||||||||||||||||||||||||||||||||||||||||||||||||||||||||||||||||||||||||||||||||||||||||||||||||||||||||||||||||||||||||||||||||||||||||||||||||
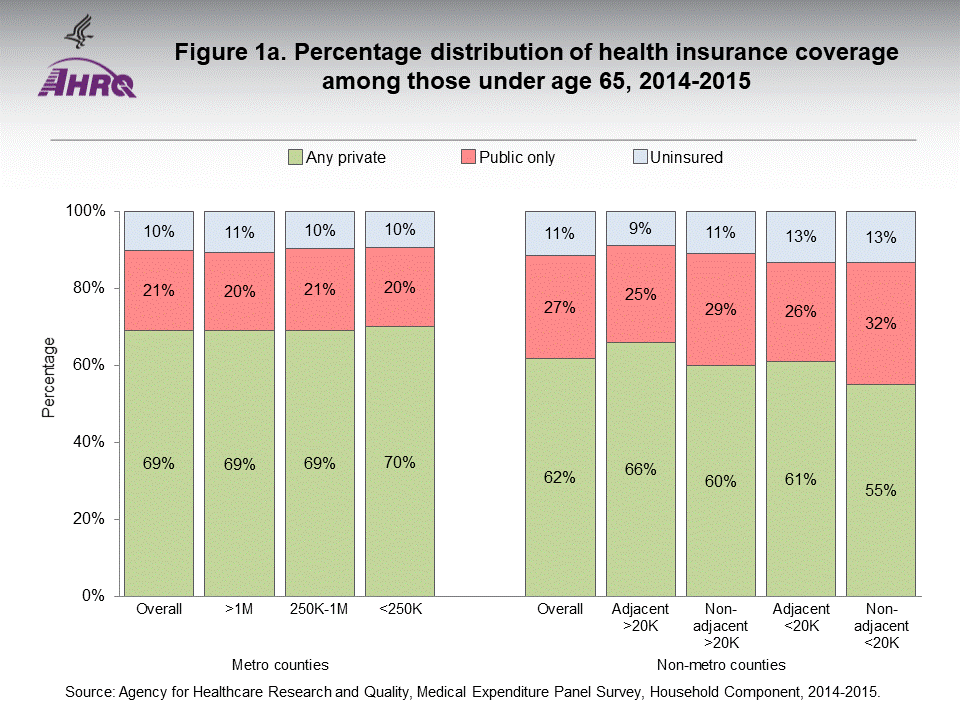
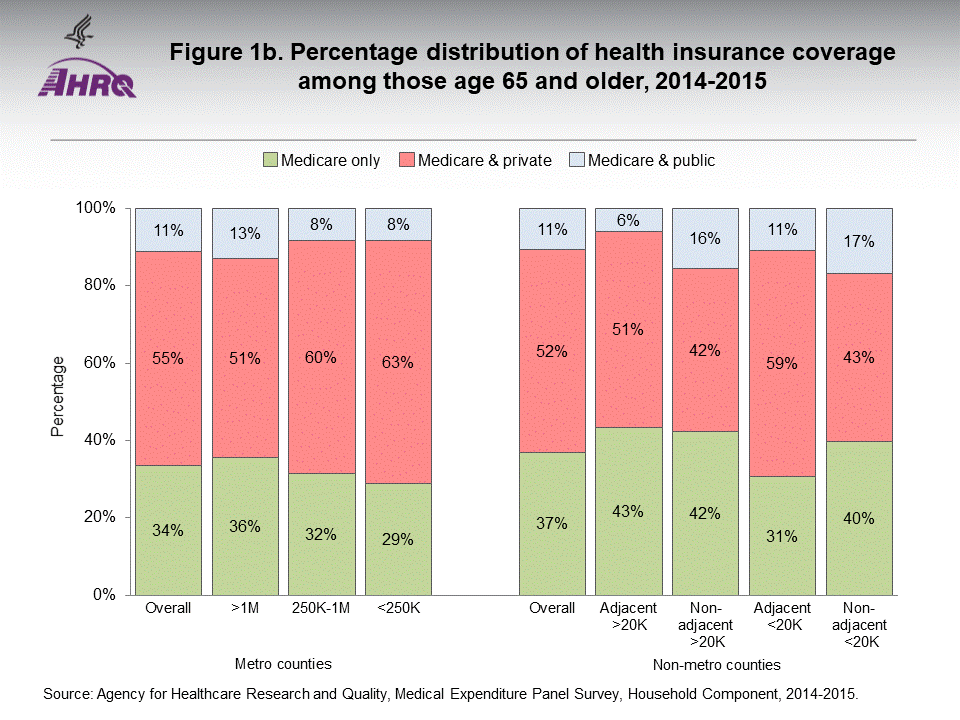
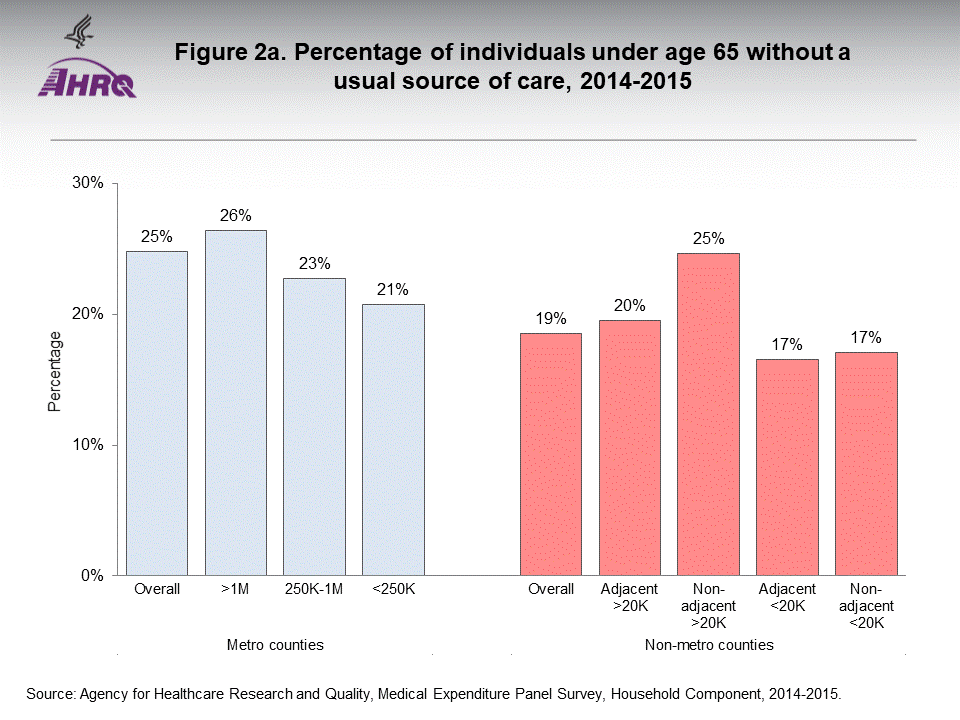
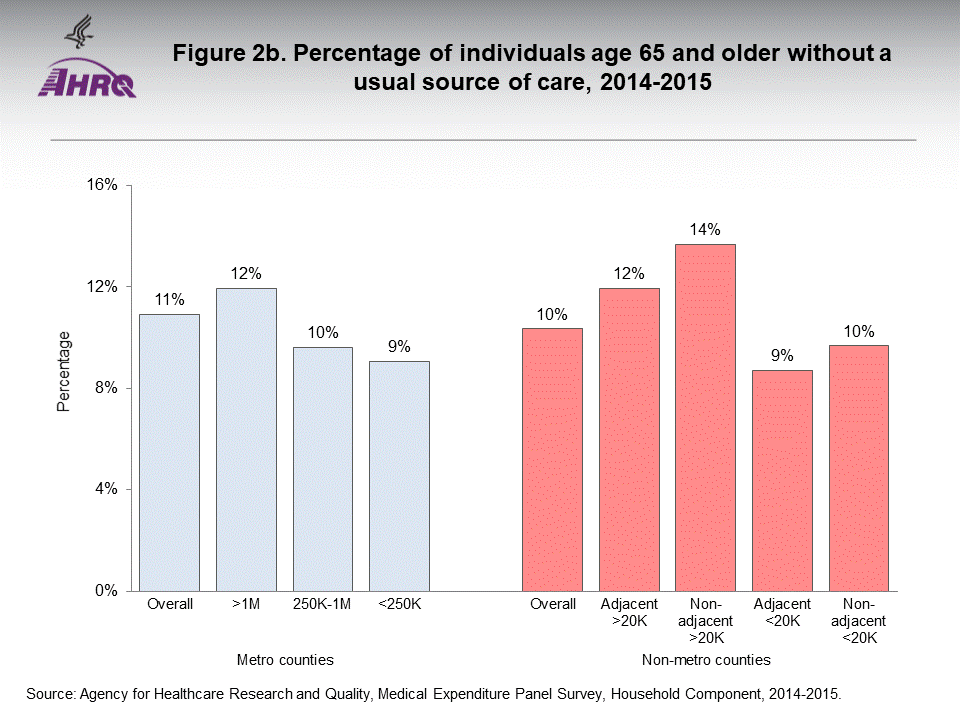
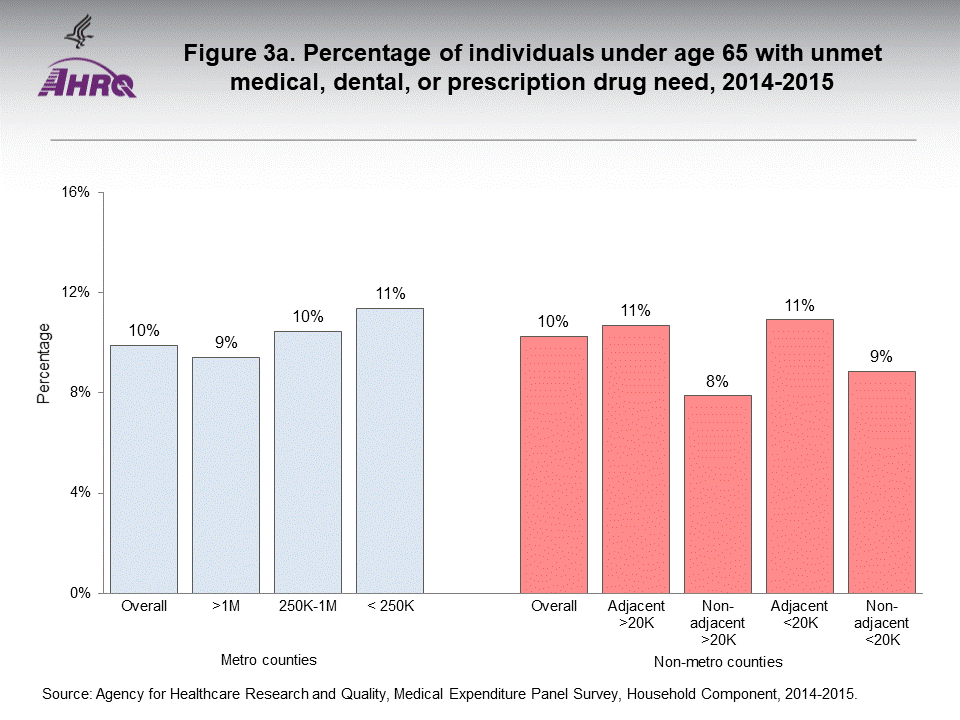
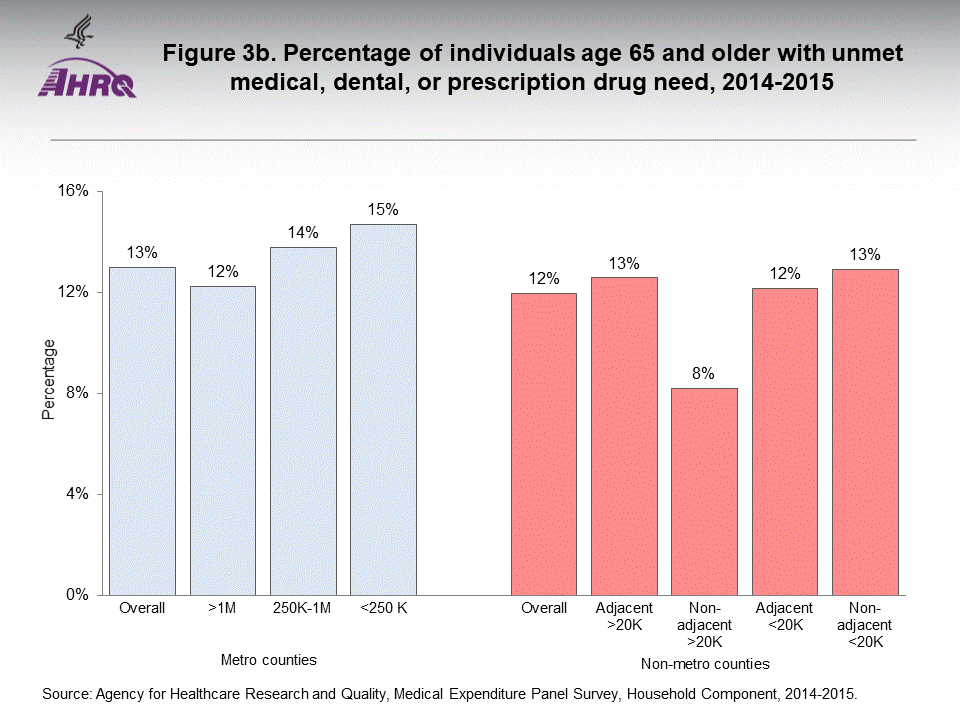
FindingsIn 2014-2015, among individuals under age 65, the overall proportion without health insurance coverage was similar for residents of metro and non-metro counties (figure 1a). The proportion with any private insurance or public insurance, however, differed between metro and non-metro residents. Overall, compared to metro residents, non-metro residents were less likely to have private insurance (62 versus 69 percent) and more likely to have public insurance (27 versus 21 percent). Residents of non-adjacent counties with urban populations less than 20,000 had the highest rate of public coverage (32 percent).Among individuals age 65 and older, there were no statistically significant differences between metro and non-metro residents in the percentage with Medicare coverage only, Medicare with private coverage, or Medicare with other public coverage (figure 1b). There were, however, several statistically significant differences across the rural-urban continuum categories. These indicate that, compared to residents of metro areas, a lower percentage of those in non-adjacent counties had private supplemental coverage in addition to Medicare. For example, 60 percent of individuals age 65 and older living in medium-sized metro counties (between 250,000 and 1 million residents) had private supplemental coverage, compared to only 42-43 percent of those living in non-adjacent counties. Metro residents under age 65 were more likely to lack a usual source of care than their non-metro counterparts (25 versus 19 percent) (figure 2a). Generally, the non-metro advantage holds across all pair-wise comparisons of the rural-urban continuum categories, with the exception of the large non-adjacent counties (25 percent). Among individuals age 65 and older, there were no statistically significant differences between metro and non-metro residents in the percentage without a usual source of care (figure 2b). Overall, non-metro residents under age 65 were about equally likely (10 percent) to report unmet need for medical care, dental care, or prescription drugs as their metro counterparts (figure 3a). There were few differences across the rural-urban continuum categories, with one exception: residents of small metro counties (under 250,000 population) were significantly more likely to report unmet need compared to residents of non-adjacent counties with urban populations greater than 20,000 (11 versus 8 percent). A similar pattern of unmet need is apparent among those age 65 and older (figure 3b). Overall, there was no statistically significant difference between metro and non-metro areas in the percentage of the elderly with unmet need, but residents living in non-adjacent counties with urban populations of more than 20,000 were significantly less likely to report unmet need than their counterparts in the two smallest metro counties (8 versus 15 and 14 percent). It is important to note that metro and non-metro residents differ across several socioeconomic and demographic characteristics (tables 1a and 1b) that are strongly associated with insurance coverage and access to care. Additionally, two of the core measures of ambulatory care access used in this Brief—having a usual source of care and reporting unmet medical, dental, or prescription drug need—may not be comparable across the entire rural-urban continuum. For example, in very rural counties, having a usual source of care may simply reflect an extremely limited supply of health care providers. Consequently, a person may answer in the affirmative when asked, "Do you have a particular person or place to go when you are ill or have a question about your health?" simply because they have only one option. The differences across the rural-urban continuum shown in this Statistical Brief should be interpreted with these limitations in mind. |
|||||||||||||||||||||||||||||||||||||||||||||||||||||||||||||||||||||||||||||||||||||||||||||||||||||||||||||||||||||||||||||||||||||||||||||||||||||||||||||||||||||||||||||||||||||||||||||||||||||||||||||||||
Data SourceThe estimates in this Statistical Brief are based on data from the 2014 and 2015 MEPS Full Year Consolidated Data Files (HC-171 and HC-181) (Cohen 1996, 1997). Estimates are weighted to represent the U.S. civilian noninstitutionalized population in 2014 and 2015. Estimates represent average annual proportions and/or percentages during the study period. Standard errors for all estimates are adjusted for complex survey design. |
|||||||||||||||||||||||||||||||||||||||||||||||||||||||||||||||||||||||||||||||||||||||||||||||||||||||||||||||||||||||||||||||||||||||||||||||||||||||||||||||||||||||||||||||||||||||||||||||||||||||||||||||||
DefinitionsInsurance coverageIndividuals were asked to report whether they had health insurance coverage and what type they had for every month during the year. Individuals were categorized using these monthly indicators: 1) at least one month with private health insurance coverage during the year; 2) only public insurance coverage during the year; or 3) uninsured all year. No usual source of care Individuals were asked whether they had a particular person or place to which they would go if they were ill or had a question about their health. Those who reported not having such a person or place were coded as not having a usual source of care. Unmet medical need Individuals were asked whether they needed medical care during the last 12 months and, if so, whether they were unable to obtain it or were delayed in obtaining it. Analogous questions were asked for dental care and prescription drugs. Individuals who reported having unmet need or delays with respect to medical care, dental care, or obtaining prescription drugs were coded as having unmet need. Rural-Urban Continuum Codes The 2013 Rural-Urban Continuum Codes are the most recent classification of counties released by the USDA. They distinguish metropolitan counties by the population of their metro area, resulting in three categories: more than 1 million residents, between 250,000 and 1 million residents, and fewer than 250,000 residents. They distinguish nonmetropolitan counties by degree of urbanization (more than 20,000 residents living in urban areas, between 2,500 and 20,000 residents living in urban areas, and less than 2,500 residents living in urban areas) and adjacency to a metro area (adjacent vs. not adjacent), resulting in six categories. In this Brief, because of small sample sizes, we distinguish only between counties with more than 20,000 urban residents and with 20,000 or fewer urbanized residents. Please see the USDA's technical documentation for more detail (U.S. Department of Agriculture 2017). Age Individuals were categorized as being under age 65 or age 65 and older. Income Income was classified based on the percentage of the federal poverty line for total family income, adjusted for family size and composition. We use five categories: poor (less than 100 percent), near poor (100 percent to less than 125 percent), low income (125 percent to less than 200 percent), middle income (200 percent to less than 400 percent), and high income (greater than or equal to 400 percent) in the year of the data collection. Health status Respondents were asked to report the health status of each member of the sample household relative to others as "poor," "fair," "good," "very good," or "excellent." |
|||||||||||||||||||||||||||||||||||||||||||||||||||||||||||||||||||||||||||||||||||||||||||||||||||||||||||||||||||||||||||||||||||||||||||||||||||||||||||||||||||||||||||||||||||||||||||||||||||||||||||||||||
About MEPS-HCMEPS-HC is a nationally representative longitudinal survey that collects detailed information on health care utilization and expenditures, health insurance, and health status, as well as a wide variety of social, demographic, and economic characteristics for the U.S. civilian noninstitutionalized population. It is cosponsored by the Agency for Healthcare Research and Quality and the National Center for Health Statistics. |
|||||||||||||||||||||||||||||||||||||||||||||||||||||||||||||||||||||||||||||||||||||||||||||||||||||||||||||||||||||||||||||||||||||||||||||||||||||||||||||||||||||||||||||||||||||||||||||||||||||||||||||||||
ReferencesCosby, A.G., T.T. Neaves, R.E. Cossman, J.S. Cossman, W.L. James, N. Feierabend, D.M. Mirvis, C.A. Jones, and T. Farrigan. 2008. "Preliminary evidence for an emerging nonmetropolitan mortality penalty in the United States." American Journal of Public Health 98(8): 1470-72.Cossman, J.S., W.L. James, A.G. Cosby, and R.E. Cossman. 2010. "Underlying causes of the emerging nonmetropolitan mortality penalty." American Journal of Public Health 100(8): 1417-19. James, W.L. 2014. "All rural places are not created equal: revisiting the rural mortality penalty in the United States." American Journal of Public Health 104(11): 2122-29. Cohen, J., A.C. Monheit, K.M. Beauregard, S.B. Cohen, D.C. Lefkowitz, D.E. Potter, J.P. Sommers, A.K. Taylor, R.H. Arnett 3rd. 1996. "The Medical Expenditure Panel Survey: A national health information resource." Inquiry 33(4): 373-89. Cohen, J. Design and Methods of the Medical Expenditure Panel Survey Household Component. MEPS Methodology Report No. 1. AHCPR Pub. No. 97-0026. Rockville, MD: Agency for Health Care Policy and Research, 1997. https://meps.ahrq.gov/data_files/publications/mr1/mr1.shtml. U.S. Department of Agriculture. 2017. "Rural-Urban Continuum Codes Documentation" [accessed December 2017]. Available at: https://www.ers.usda.gov/data-products/rural-urban-continuum-codes/documentation. |
|||||||||||||||||||||||||||||||||||||||||||||||||||||||||||||||||||||||||||||||||||||||||||||||||||||||||||||||||||||||||||||||||||||||||||||||||||||||||||||||||||||||||||||||||||||||||||||||||||||||||||||||||
Suggested CitationKirby, J.B. and Muhuri, P. Insurance and access to care in urban and rural areas, 2014-2015. May 2018. Statistical Brief #512. Agency for Healthcare Research and Quality, Rockville, MD. https://meps.ahrq.gov/mepsweb/data_files/publications/st512/stat512.shtml |
|||||||||||||||||||||||||||||||||||||||||||||||||||||||||||||||||||||||||||||||||||||||||||||||||||||||||||||||||||||||||||||||||||||||||||||||||||||||||||||||||||||||||||||||||||||||||||||||||||||||||||||||||
|
AHRQ welcomes questions and comments from readers of this publication who are interested in obtaining more information about access, cost, use, financing, and quality of health care in the United States. We also invite you to tell us how you are using this Statistical Brief and other MEPS data and tools and to share suggestions on how MEPS products might be enhanced to further meet your needs. Please email us at MEPSProjectDirector@ahrq.hhs.gov or send a letter to the address below: Joel Cohen, PhD, Director Center for Financing, Access, and Cost Trends Agency for Healthcare Research and Quality 5600 Fishers Lane, Mailstop 07W41A Rockville, MD 20857 |
|||||||||||||||||||||||||||||||||||||||||||||||||||||||||||||||||||||||||||||||||||||||||||||||||||||||||||||||||||||||||||||||||||||||||||||||||||||||||||||||||||||||||||||||||||||||||||||||||||||||||||||||||
|
1 A non-metro county is adjacent if it shares a border with a metro county and at least 2 percent of its employed labor force commutes to central metro counties. |
|||||||||||||||||||||||||||||||||||||||||||||||||||||||||||||||||||||||||||||||||||||||||||||||||||||||||||||||||||||||||||||||||||||||||||||||||||||||||||||||||||||||||||||||||||||||||||||||||||||||||||||||||
Note: USC refers to usual source of care; FPL refers to federal poverty line. |
|||||||||||||||||||||||||||||||||||||||||||||||||||||||||||||||||||||||||||||||||||||||||||||||||||||||||||||||||||||||||||||||||||||||||||||||||||||||||||||||||||||||||||||||||||||||||||||||||||||||||||||||||
Note: USC refers to usual source of care; FPL refers to federal poverty line. | |||||||||||||||||||||||||||||||||||||||||||||||||||||||||||||||||||||||||||||||||||||||||||||||||||||||||||||||||||||||||||||||||||||||||||||||||||||||||||||||||||||||||||||||||||||||||||||||||||||||||||||||||
 |
|||||||||||||||||||||||||||||||||||||||||||||||||||||||||||||||||||||||||||||||||||||||||||||||||||||||||||||||||||||||||||||||||||||||||||||||||||||||||||||||||||||||||||||||||||||||||||||||||||||||||||||||||
Source: Agency for Healthcare Research and Quality, Medical Expenditure Panel Survey, Household Component, 2014-2015. |
|||||||||||||||||||||||||||||||||||||||||||||||||||||||||||||||||||||||||||||||||||||||||||||||||||||||||||||||||||||||||||||||||||||||||||||||||||||||||||||||||||||||||||||||||||||||||||||||||||||||||||||||||
|
| |||||||||||||||||||||||||||||||||||||||||||||||||||||||||||||||||||||||||||||||||||||||||||||||||||||||||||||||||||||||||||||||||||||||||||||||||||||||||||||||||||||||||||||||||||||||||||||||||||||||||||||||||


