Skip to main content
|
|||||||||||||||||||||||||||||||||||||||||||||
|
|
|||||||||||||||||||||||||||||||||||||||||||||
STATISTICAL BRIEF #517:
|
|||||||||||||||||||||||||||||||||||||||||||||
| October 2018 | |||||||||||||||||||||||||||||||||||||||||||||
|
Steven R. Machlin, MS and Emily M. Mitchell, PhD |
|||||||||||||||||||||||||||||||||||||||||||||
Highlights
|
|||||||||||||||||||||||||||||||||||||||||||||
IntroductionPayments for care to physicians vary substantially by the specialty of the physician and by payer. Physician payment levels are influenced by factors such as complexity of services provided, length of visit, local market conditions and payment generosity of insurance plans. Understanding variation in physician payment has important implications for access, cost, and quality of care.Based on data from the Household Component of the Medical Expenditure Panel Survey (MEPS-HC), this Statistical Brief provides descriptive statistics for the U.S. civilian noninstitutionalized population illustrating variation in both total payments (expenses) and out-of-pocket payments per office-based physician visit across selected specialty types in 2016. In addition, variation within specialty type by insurance coverage is also presented. Estimates are shown for the eight physician specialties with the highest number of visits in an office-based setting and a ninth catchall category that encompasses all other physician specialty types. These categories are shown in the following table:
*Percentages do not add to exactly 100 due to rounding. |
|||||||||||||||||||||||||||||||||||||||||||||
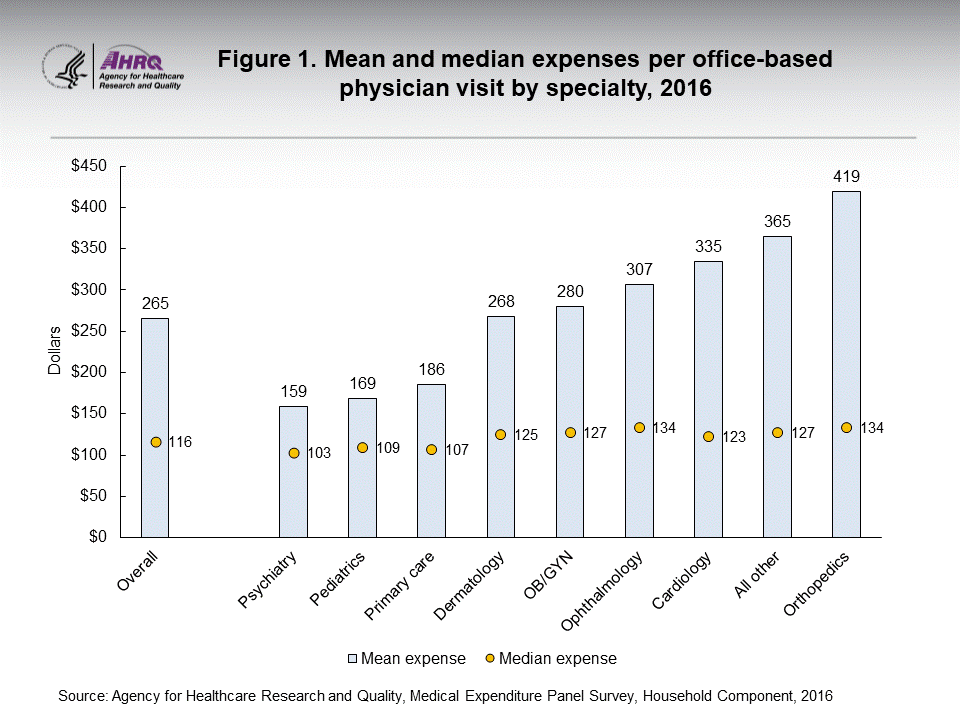
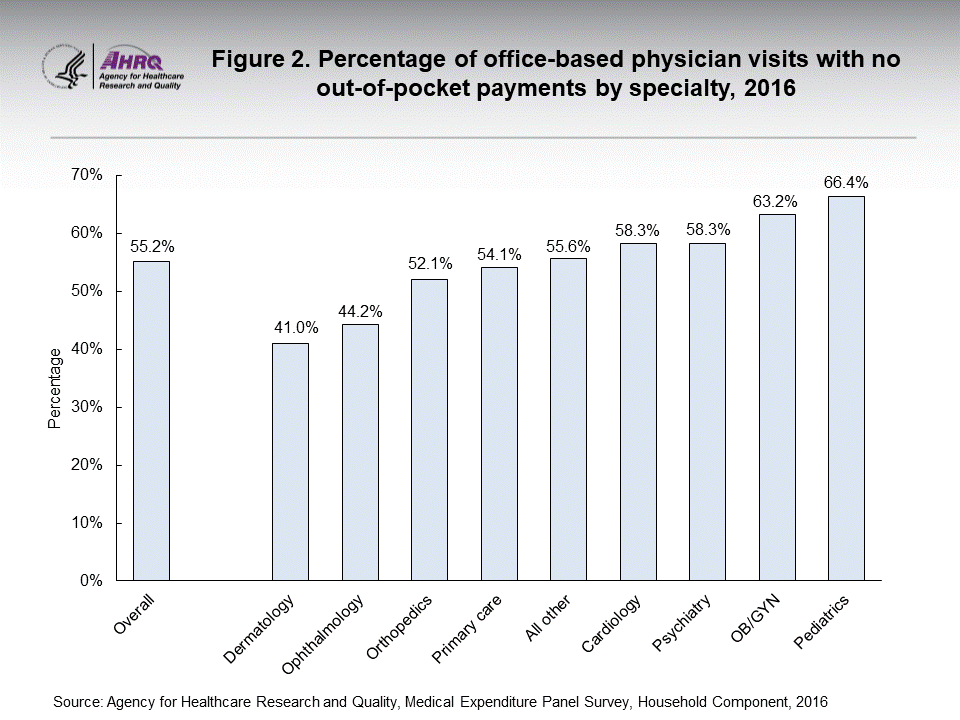
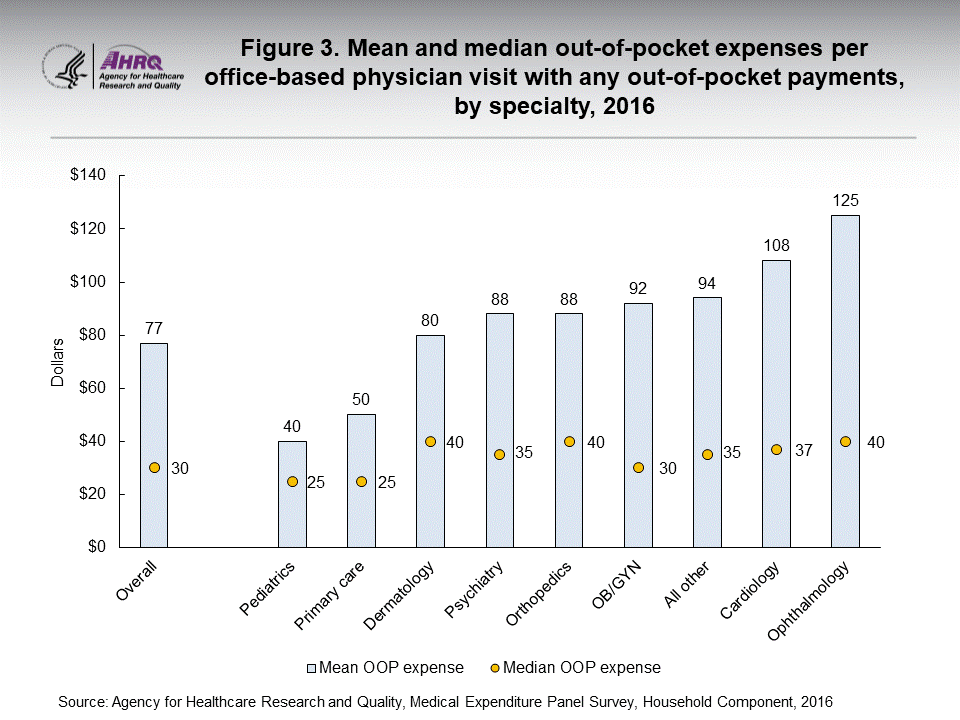
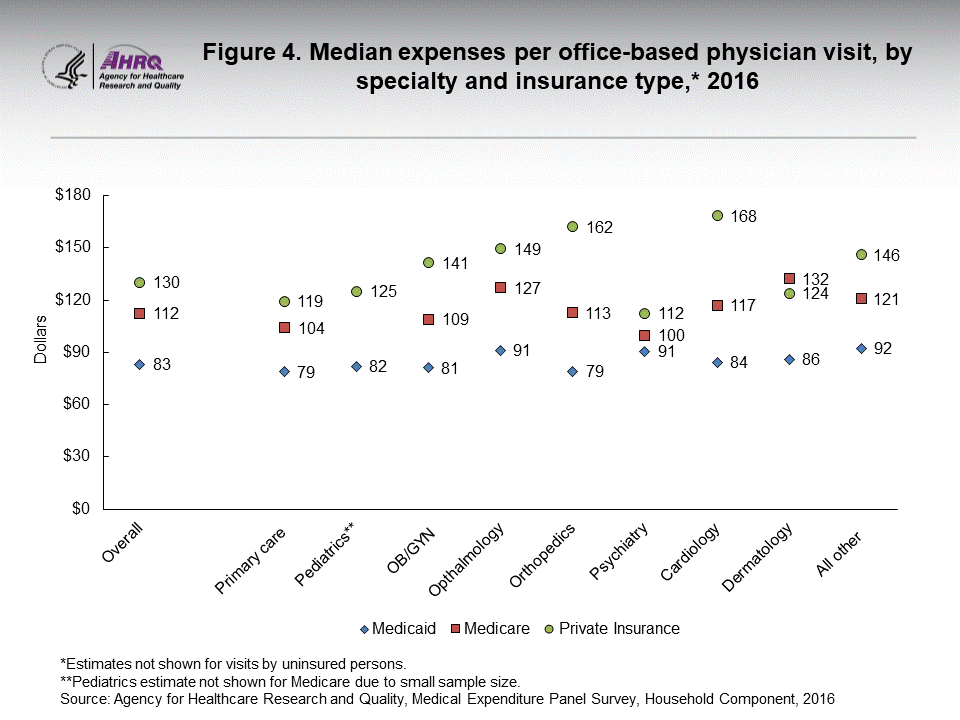
FindingsTotal expensesThe overall national mean expense for an office-based physician visit in 2016 was $265 (figure 1). However, means per visit varied substantially by physician specialty. For example, the means for primary care providers, pediatricians, and psychiatrists of $186, $169, and $159, respectively, were below the national mean of $265. Conversely, means for visits to orthopedists ($419), cardiologists ($335), and physicians in the “all other” category ($365) exceeded the mean. Overall, the median expense for an office-based visit to a physician in 2016 was $116, which was less than half the overall mean expense per physician visit of $265. Mean expenses were notably higher than medians for all physician office visits and for each specialty category, which is attributable to relatively small proportions of very expensive visits increasing the mean. Moreover, median expenses ranged less dramatically across specialty types (from $103 to $134) than did mean expenses ($159 to $419). Relative to other specialty types, means and medians were more similar for visits to psychiatrists, pediatricians, and primary care physicians which reflects less variability in payments for those visits. Out-of-pocket payments Not all office-based physician visits have out-of-pocket payments. This can occur due to full insurance coverage for services provided—such as for Medicaid visits or preventive services which typically do not require copayments. Additional reasons for no out-of-pocket payments include no charge for follow-up visits, charity care by the doctor, and bad debt from the patient. In 2016, slightly more than half (55.2 percent) of all office-based physician visits had no out-of-pocket payments (figure 2). Visits without out-of-pocket payments were more common for pediatricians (66.4 percent) and obstetricians/gynecologists (63.2 percent). Conversely, visits to ophthalmologists (44.2 percent) and dermatologists (41.0 percent) were less likely to have no out-of-pocket expenses. Among office-based physician visits in 2016 for which some out-of-pocket payments were made, the overall median out-of-pocket payment per visit was $30 (figure 3). However, median out-of-pocket payments ranged from $25 for visits to pediatricians and primary care doctors to $40 for visits to orthopedists, dermatologists, and ophthalmologists. Mean out-of-pocket payments, which ranged from $40 for pediatric visits to $125 for visits to ophthalmologists, were notably higher than median payments across all specialties. Insurance coverage type Among visits by persons with private or public (primarily Medicare and/or Medicaid) insurance coverage, the median expense per visit varied by type of coverage within specialty (figure 4). For most specialties, the median per-visit payment was highest for visits covered by private insurance, lowest for Medicaid visits, and in between for Medicare visits. However, median expenses for visits to dermatologists did not differ significantly between the private insurance and Medicare categories. In addition, the median expense per psychiatrist visit for persons on Medicare did not differ significantly from the median for either private insurance or Medicaid visits. |
|||||||||||||||||||||||||||||||||||||||||||||
Data SourceThe estimates in this Statistical Brief are based on data from the MEPS 2016 Office-Based Medical Provider Visits File (HC-188G) and 2016 Full Year Consolidated Data File (HC-192). |
|||||||||||||||||||||||||||||||||||||||||||||
DefinitionsExpenses/expendituresPayments from all sources for office-based physician visits are reported by respondents in the MEPS-HC. Sources include direct payments from individuals (out-of-pocket payments), private insurance, Medicare, Medicaid, Workers’ Compensation, and miscellaneous other sources. Out-of-pocket payments are typically comprised of deductibles or copayments for insured individuals as well as payments made for uncovered services and by persons without insurance. Type of specialist MEPS respondents who reported an office-based visit in which a medical doctor was seen were asked to identify the doctor’s specialty. (The questionnaire contains 34 response categories for coding the specialty type reported.) A small proportion of sample physician visit events in which a medical doctor was seen (1.9 percent) were excluded from the analysis because specialty type was not reported. In this Statistical Brief, the categories for general practice, family practice, and internal medicine (internist) were combined because it may be difficult for respondents to distinguish between these types of primary care physicians. (Pediatricians were kept as a separate category.) Multiple types of physician specialties were combined into the catchall “all other” category shown in this Brief, including allergy/immunology, anesthesiology, endocrinology/metabolism, gastroenterology, general surgery, geriatrics, hematology, hospital residence, nephrology, nuclear medicine, oncology, osteopathy, otorhinolaryngology (ear, nose, throat), pathology, physical medicine/rehab, plastic surgery, proctology, pulmonary, radiology, rheumatology, thoracic surgery, urology, and other doctor specialty. Though each of the specialist types within the “other” category comprised only a small proportion of all physician visits, they cumulatively comprised approximately one-quarter of all visits. Insurance coverage Based on survey data about insurance coverage for the person during the month of the visit, all reported physician visits were classified into one of the following four categories: Medicare, Private Insurance, Medicaid, and Uninsured. Then, to reflect the typical prioritization of payers for persons with multiple sources of coverage, visits for persons reported as covered by more than one source during the month were classified hierarchically in the order listed above (e.g., a visit was classified as Medicare if the person had both Medicare and supplemental private insurance coverage). The table below shows the weighted distribution of visits across these four categories. Visits classified as uninsured (about 5 percent of all visits) were excluded from figure 4.
|
|||||||||||||||||||||||||||||||||||||||||||||
About MEPS-HCThe Medical Expenditure Panel Survey Household Component (MEPS-HC) collects nationally representative data on health care use, expenditures, sources of payment, and insurance coverage for the U.S. civilian noninstitutionalized population. The MEPS-HC is cosponsored by the Agency for Healthcare Research and Quality (AHRQ) and the National Center for Health Statistics (NCHS). More information about the MEPS-HC can be found on the MEPS Web site at https://meps.ahrq.gov/. |
|||||||||||||||||||||||||||||||||||||||||||||
ReferencesFor a detailed description of the MEPS-HC survey design, sample design, and methods used to minimize sources of nonsampling error, see the following publications:Cohen, J. Design and Methods of the Medical Expenditure Panel Survey Household Component. MEPS Methodology Report No. 1. AHCPR Pub. No. 97-0026. Rockville, MD: Agency for Health Care Policy and Research, 1997. https://meps.ahrq.gov/data_files/publications/mr1/mr1.shtml. Cohen, S. Sample Design of the 1996 Medical Expenditure Panel Survey Household Component. MEPS Methodology Report No. 2. AHCPR Pub. No. 97-0027. Rockville, MD: Agency for Health Care Policy and Research, 1997. https://meps.ahrq.gov/data_files/publications/mr2/mr2.shtml. Cohen, S. Design Strategies and Innovations in the Medical Expenditure Panel Survey. Medical Care, July 2003: 41(7) Supplement: III-5–III-12. |
|||||||||||||||||||||||||||||||||||||||||||||
Suggested CitationMachlin, S.R. and Mitchell, E.M. Expenses for Office-Based Physician Visits by Specialty and Insurance Type, 2016. October 2018. Statistical Brief #517. Agency for Healthcare Research and Quality, Rockville, MD. https://meps.ahrq.gov/mepsweb/data_files/publications/st517/stat517.shtml |
|||||||||||||||||||||||||||||||||||||||||||||
|
AHRQ welcomes questions and comments from readers of this publication who are interested in obtaining more information about access, cost, use, financing, and quality of health care in the United States. We also invite you to tell us how you are using this Statistical Brief and other MEPS data and tools and to share suggestions on how MEPS products might be enhanced to further meet your needs. Please email us at MEPSProjectDirector@ahrq.hhs.gov or send a letter to the address below: Joel Cohen, PhD, Director Center for Financing, Access, and Cost Trends Agency for Healthcare Research and Quality 5600 Fishers Lane, Mailstop 07W41A Rockville, MD 20857 |
|||||||||||||||||||||||||||||||||||||||||||||
 |
|||||||||||||||||||||||||||||||||||||||||||||
|
|||||||||||||||||||||||||||||||||||||||||||||
 |
|||||||||||||||||||||||||||||||||||||||||||||
|
|||||||||||||||||||||||||||||||||||||||||||||
 |
|||||||||||||||||||||||||||||||||||||||||||||
|
|||||||||||||||||||||||||||||||||||||||||||||
 |
|||||||||||||||||||||||||||||||||||||||||||||
|
|||||||||||||||||||||||||||||||||||||||||||||
|
| |||||||||||||||||||||||||||||||||||||||||||||


