STATISTICAL BRIEF #526:
|
|||||||||||||||||||||||||
| October 2019 | |||||||||||||||||||||||||
|
Pradip K. Muhuri, PhD, Steven R. Machlin, MS, and Philippe Gwet, PhD
|
|||||||||||||||||||||||||
Highlights
|
|||||||||||||||||||||||||
IntroductionInfluenza, commonly known as flu, is a respiratory illness caused by influenza viruses. It can cause mild to severe illness, affecting both children and adults. Severe flu may result in hospitalizations and even death. The burden of flu-related illnesses in the United States can vary widely from season to season. According to the U.S. Centers for Disease Control and Prevention (CDC), over the six flu seasons from 2010–11 through 2015–16, influenza-associated illnesses ranged from a low of 9.2 million to a high of 35.6 million, and associated pneumonia and influenza deaths ranged from 4,000 to 12,000.1Based on pooled data from two years (2016 and 2017) of the Medical Expenditure Panel Survey - Household Component (MEPS-HC), this Statistical Brief presents average annual estimates of the percentage of the population treated for influenza (overall and by age group) and associated expenses (overall and by service type as well as out-of-pocket) for the U.S. civilian noninstitutionalized population. Persons are classified as treated for flu if the condition was associated with any of the medical event types for which condition information is collected in MEPS (see the flu treatment definition). However, this Brief focuses on three common categories of care for influenza: ambulatory visits (office-based and hospital outpatient visits), prescribed medicine fills, and emergency room visits.2 All estimates were weighted to account for the MEPS complex sample design and nonresponse. Only differences between estimates that are statistically significant at the 0.05 level are mentioned in the text. |
|||||||||||||||||||||||||
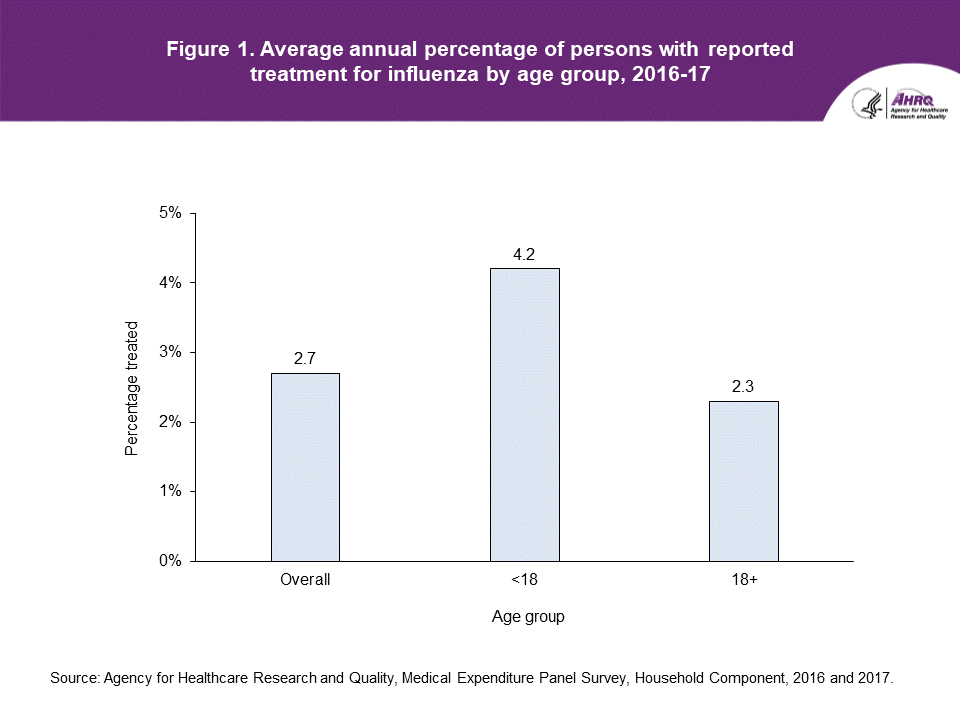
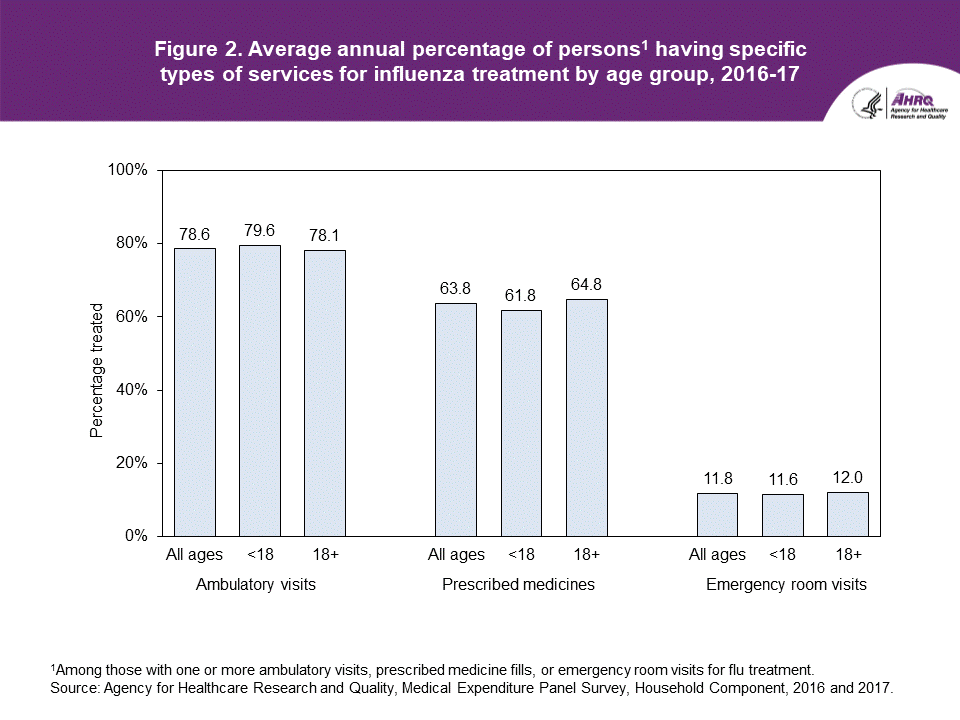
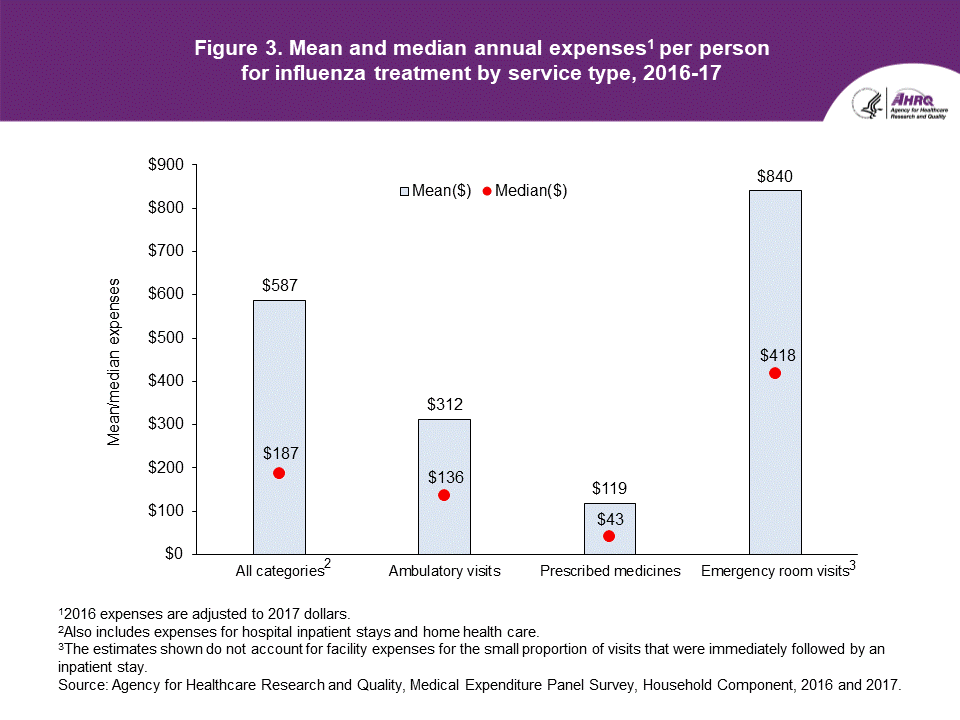
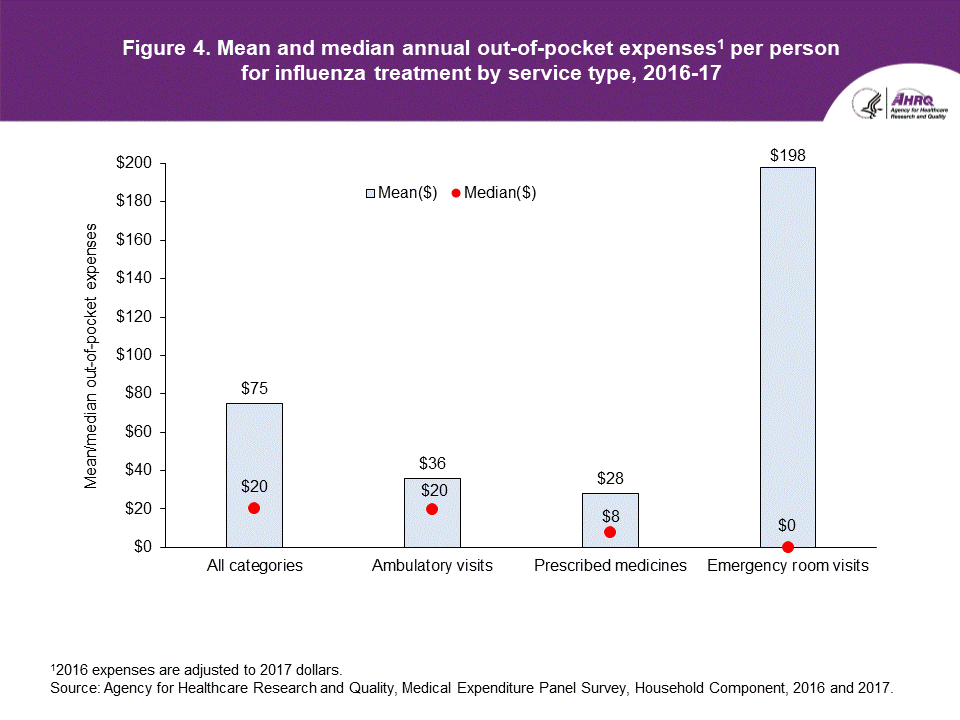
FindingsFlu treatment (figures 1 and 2)In 2016–17, an annual average of 2.7 percent of persons in the U.S. civilian noninstitutionalized population received some treatment for flu (figure 1). Flu treatment was more likely to be reported for children (4.2 percent of those under age 18) than adults (2.3 percent of those age 18 and older). There were approximately 3.1 million children and 5.7 million adults—a total of 8.8 million individuals of all ages—treated for flu on average per year during the two-year period (estimates not shown in figure). Among all persons treated for flu, an annual average of 78.6 percent had at least one ambulatory visit, 63.8 percent had at least one prescribed medicine fill, and 11.8 percent had at least one emergency room visit for the condition (figure 2). The differences shown in Figure 2 by age group are not statistically significant. Regardless of age, only a small percentage of individuals had at least one inpatient stay (2.0 percent overall) or home health care visit (0.3 percent overall) and most of these persons also had an ambulatory visit, emergency room visit, and/or a prescription filled for the condition (estimates not shown in figure). Health care expenditures for flu treatment (figure 3) In 2016–17, an annual average total of $5.2 billion (in 2017 dollars) was spent on treatment for flu for persons in the U.S. civilian noninstitutionalized population (estimate not shown in figure). Among those with reported flu treatment, the annual mean expenses per person to treat the condition was $312 for ambulatory visits (among those with one or more visits), $119 for prescribed medicines (among those with one or more fills), and $840 for emergency room visits (among those with one or more visits) (figure 3). The corresponding median expenses were $136, $43, and $418, respectively. The overall annual mean expense across all services, which includes the small proportion of persons with inpatient stays and/or home health care for the condition, was $587 per person while the overall median estimate was $187. However, if the small proportion (about 2 percent) of individuals who had inpatient stays associated with flu are excluded, the overall mean total expense drops to $411 but the median estimate stays about the same ($181) (estimates not shown in figure). Out-of-pocket expenses for flu treatment (figure 4) The overall annual mean amount paid out of pocket for influenza treatment was $75 while the overall median was $20. Service type-specific annual out-of-pocket mean expenses per user were $36 for ambulatory visits, $28 for prescribed medicines, and $198 for emergency room visits while the corresponding median estimates were $20, $8, and $0 per user, respectively (figure 4). |
|||||||||||||||||||||||||
Data SourcesThe estimates in this Statistical Brief are based on data from the MEPS 2016 and 2017 Medical Conditions files (HC-190 and HC-199), Office-Based Medical Provider Visits files (HC-188G and HC-197G), Outpatient Visits files (HC-188F and HC-197F), Emergency Room Visits files (HC-188E and HC-197E), Prescribed Medicines files (HC-188A and HC-197A), Hospital Inpatient Stays files (HC-188D and HC-197D), Home Health files (HC-188H and HC-197H), Condition-Event Link files (HC-188I and HC-197I), and Full-Year Consolidated Data files (HC-192 and HC-201). These data files are downloadable from: https://meps.ahrq.gov/data_stats/download_data_files.jsp. |
|||||||||||||||||||||||||
DefinitionsFlu treatmentA sample person is considered treated for flu if he or she had one or more reported events (i.e., office-based visits, hospital outpatient visits, emergency room visits, hospital inpatient stays, home health care visits, or prescribed medicine fills) associated with the condition of influenza (ICD10CDX=J11) based on linkages between MEPS event and medical conditions data files. A negligible proportion of office and outpatient visits associated with flu treatment (estimated at 2–3 percent) may have been for a flu shot rather than to receive treatment for the condition. Persons treated only with over-the-counter (OTC) medicines are not counted since data on OTC drug purchases are not collected in MEPS. Expenditures for flu treatment Expenditures include payments from all sources (private insurance, Medicare, Medicaid, out of pocket, and miscellaneous other less common sources) for flu-related care provided across all service types (i.e., office-based visits, hospital outpatient visits, prescribed medicine fills, emergency room visits, hospital inpatient stays, and home health care visits). In addition to total expenses across all event types, there are three service-type-specific expense variables shown: 1) ambulatory visits (office-based and hospital outpatient visits combined); 2) prescribed medicine fills; and 3) emergency room visits. In estimating expenses for flu treatment at the person level, ambulatory visits associated with flu that occurred by phone (about 1 percent of all ambulatory visits) are not included since expenditure data are not collected for those call-based events. The value for each expenditure variable was obtained by summing expenses for all event(s) associated with flu treatment during the year to the person level. In producing person-level average estimates for 2016–17 data combined, the 2016 expense data were adjusted to 2017 dollars using the Personal Health Care (Overall) Price Indices for the two years (https://meps.ahrq.gov/about_meps/Price_Index.shtml). A small proportion of events are associated with flu and another condition. For these events, all expenses are counted in this Brief as flu-related because it is not feasible to properly allocate expenses across multiple conditions. Out-of-pocket expenditures are typically comprised of deductibles or copayments for insured individuals as well as payments made for uncovered services and by persons without insurance. Age Individuals are classified into two age groups (under age 18, age 18 and older) based on their age at the last time they were eligible for data collection during the year (usually the end of the year). |
|||||||||||||||||||||||||
About MEPS-HCThe Medical Expenditure Panel Survey Household Component (MEPS-HC) collects nationally representative data on healthcare use, expenditures, sources of payment, and insurance coverage for the U.S. civilian noninstitutionalized population. The MEPS-HC is cosponsored by the Agency for Healthcare Research and Quality (AHRQ) and the National Center for Health Statistics (NCHS). More information about the MEPS-HC can be found on the MEPS website at https://meps.ahrq.gov/. |
|||||||||||||||||||||||||
ReferencesFor a detailed description of the MEPS-HC survey design, sample design, and methods used to minimize sources of nonsampling error, see the following publications:Cohen, J. Design and Methods of the Medical Expenditure Panel Survey Household Component. MEPS Methodology Report No. 1. AHCPR Pub. No. 97-0026. Rockville, MD. Agency for Health Care Policy and Research, 1997. https://meps.ahrq.gov/data_files/publications/mr1/mr1.shtml Chowdhury, S.R., Machlin, S.R., and Gwet K.L. Sample Designs of the Medical Expenditure Panel Survey Household Component, 1996–2006 and 2007–2016. Methodology Report #33. January 2019. Agency for Healthcare Research and Quality, Rockville, MD. https://meps.ahrq.gov/data_files/publications/mr33/mr33.shtml |
|||||||||||||||||||||||||
Suggested CitationMuhuri, P.K., Machlin, S.R., Gwet, P. Health Care Use and Expenditures for Influenza, 2016–17. Statistical Brief #526. October 2019. Agency for Healthcare Research and Quality, Rockville, MD. https://meps.ahrq.gov/mepsweb/data_files/publications/st526/stat526.shtml |
|||||||||||||||||||||||||
|
AHRQ welcomes questions and comments from readers of this publication who are interested in obtaining more information about access, cost, use, financing, and quality of healthcare in the United States. We also invite you to tell us how you are using this Statistical Brief and other MEPS data and tools and to share suggestions on how MEPS products might be enhanced to further meet your needs. Please email us at MEPSProjectDirector@ahrq.hhs.gov or send a letter to the address below: Joel W. Cohen, PhD, Director Center for Financing, Access, and Cost Trends Agency for Healthcare Research and Quality 5600 Fishers Lane, Mailstop 07W41A Rockville, MD 20857 |
|||||||||||||||||||||||||
|
1Rolfes, MA et al. Annual estimates of the burden of seasonal influenza in the United States: A tool for strengthening influenza surveillance and preparedness. Influenza Other Respir Viruses. 2018 Jan; 12(1): 132–137. Published online 2018 Feb 14. doi: 10.1111/irv.12486. 2Persons treated for flu only by over-the-counter (OTC) medicines are not captured since data on OTC drug purchases are not collected in MEPS. |
|||||||||||||||||||||||||
 |
|||||||||||||||||||||||||
|
|||||||||||||||||||||||||
 |
|||||||||||||||||||||||||
| |||||||||||||||||||||||||
 |
|||||||||||||||||||||||||
| |||||||||||||||||||||||||
 |
|||||||||||||||||||||||||
|

|
|
Font Size:
|
||||
|
|
|
|
||||


