Skip to main content

|
||||||||||||||||||||||||||||||||||||||||||
|
|
||||||||||||||||||||||||||||||||||||||||||
STATISTICAL BRIEF #533:
|
||||||||||||||||||||||||||||||||||||||||||
| January 2021 | ||||||||||||||||||||||||||||||||||||||||||
| Emily M. Mitchell, PhD
|
||||||||||||||||||||||||||||||||||||||||||
Highlights
|
||||||||||||||||||||||||||||||||||||||||||
IntroductionIn 2018, spending on healthcare accounted for 17.7 percent of the United States gross domestic product, ¹ yet the majority of this spending was concentrated in a small percentage of the population. Medical Expenditure Panel Survey (MEPS) data show that about 13 percent of the U.S. civilian noninstitutionalized population had no personal healthcare expenditures in 2018. On the other hand, only 5 percent of the population accounted for nearly half of healthcare spending. This spending includes all sources of payments for medical care, including private insurance payments, Medicare, Medicaid, out-of-pocket spending, and other sources.In this Statistical Brief, data from the Agency for Healthcare Research and Quality (AHRQ) Medical Expenditure Panel Survey Household Component (MEPS-HC) are used to describe the overall concentration of healthcare expenditures across the U.S. civilian noninstitutionalized population in 2018. In addition, the most commonly treated conditions among top spenders are identified, and the shares of spending by age group, race/ethnicity, type of medical service, and source of payment are compared across the distribution. All differences discussed in the text are statistically significant at the 0.05 level. |
||||||||||||||||||||||||||||||||||||||||||
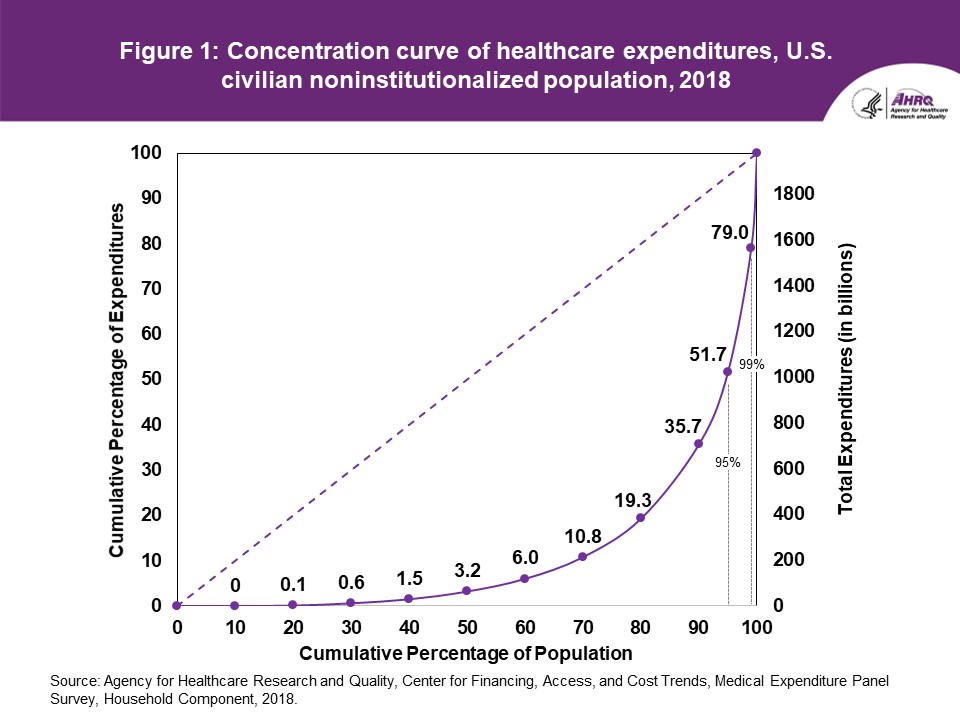
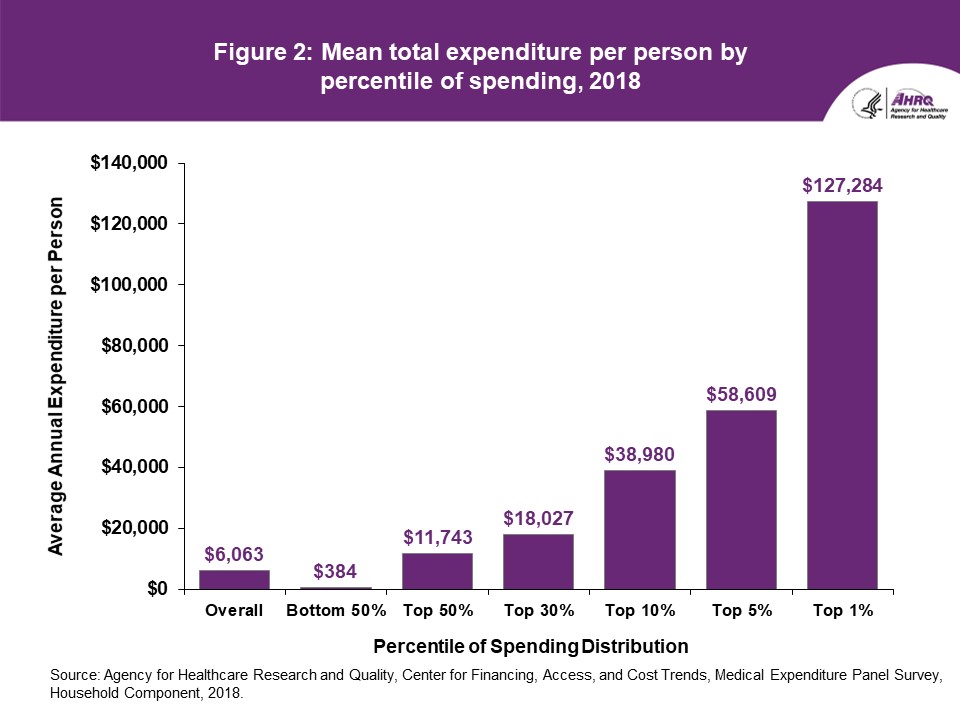
FindingsOverall (table 1, figures 1 and 2)In 2018, the top 1 percent of persons ranked by their healthcare expenditures accounted for 21 percent of total healthcare expenditures (100 minus 79 percent; figure 1), with an annual mean expenditure of $127,284 (figure 2). The group within the top 1 percent is defined as persons who spent $72,212 or more during the year. Cut points for additional percentile groups are shown in table 1. The top 5 percent of the population accounted for 48.3 percent of total expenditures (100 minus 51.7 percent), with an annual mean expenditure of $58,609. The bottom 50 percent accounted for only 3.2 percent of total healthcare expenditures. Every person in this group spent less than $1,317 during the year (table 1), with an average annual expenditure of $384 (figure 2).
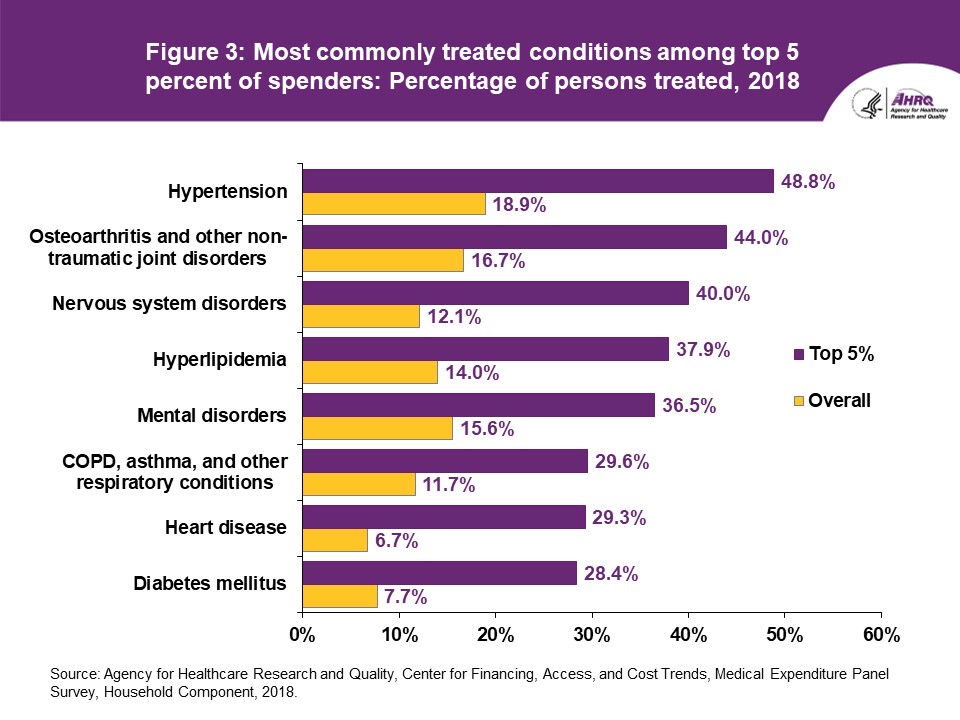
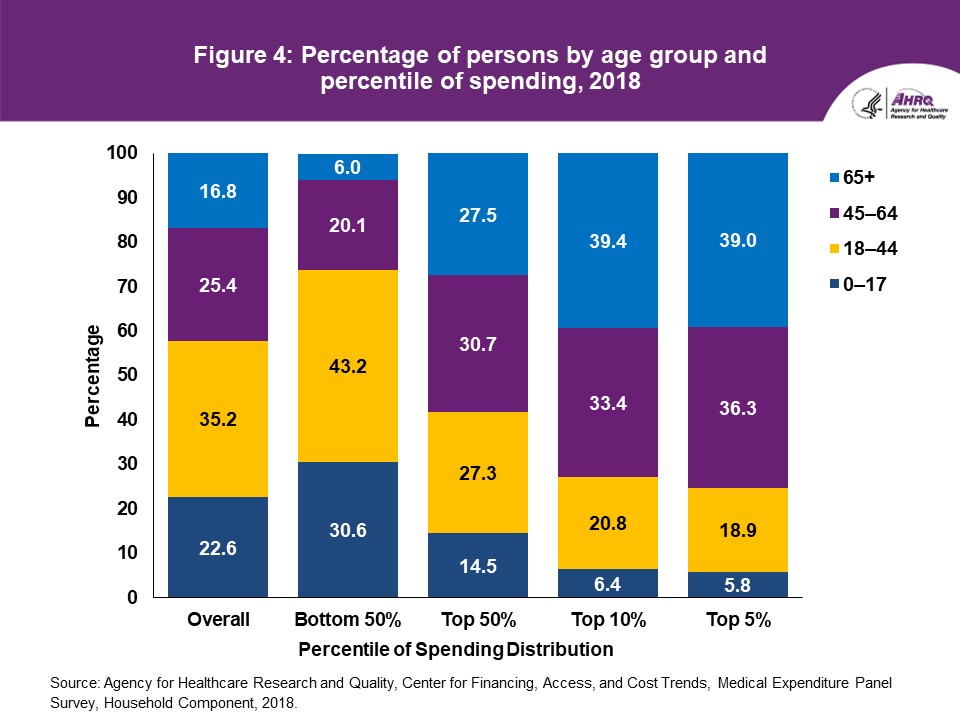
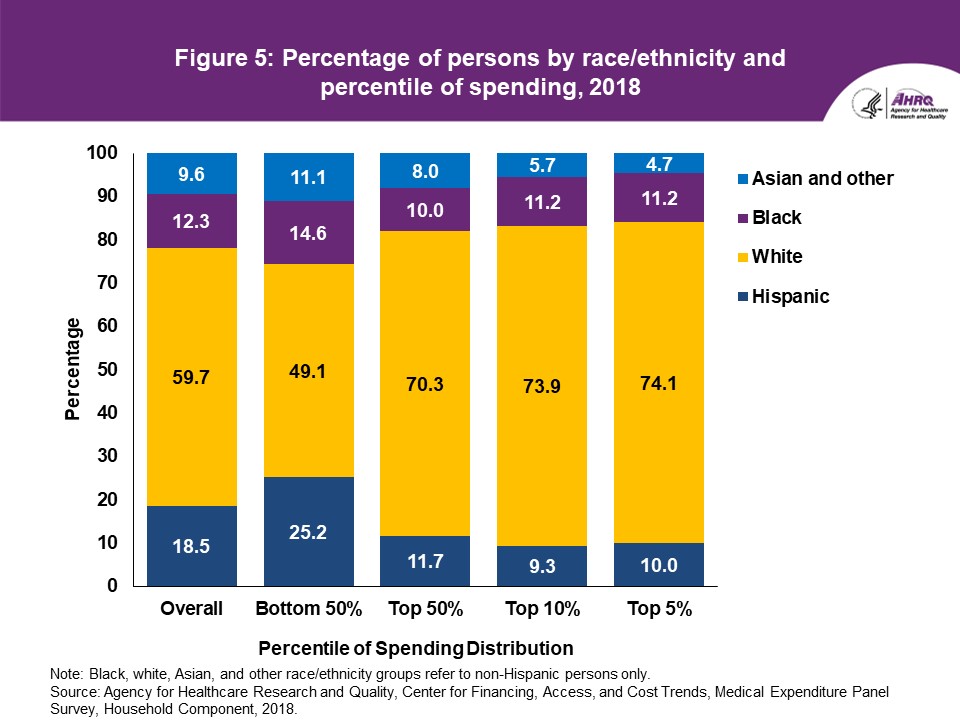
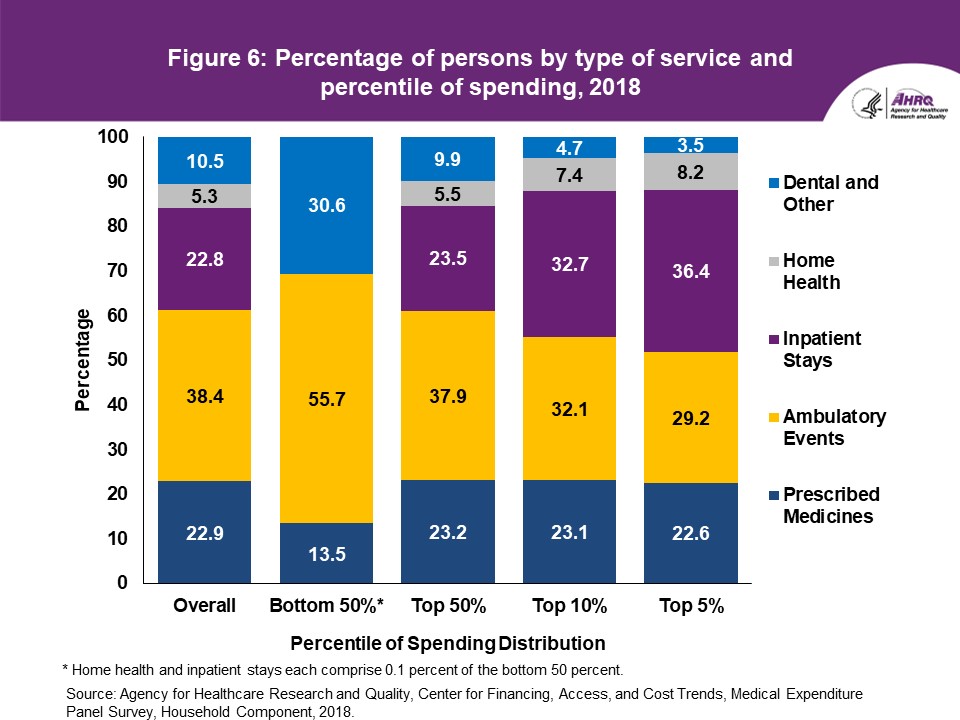
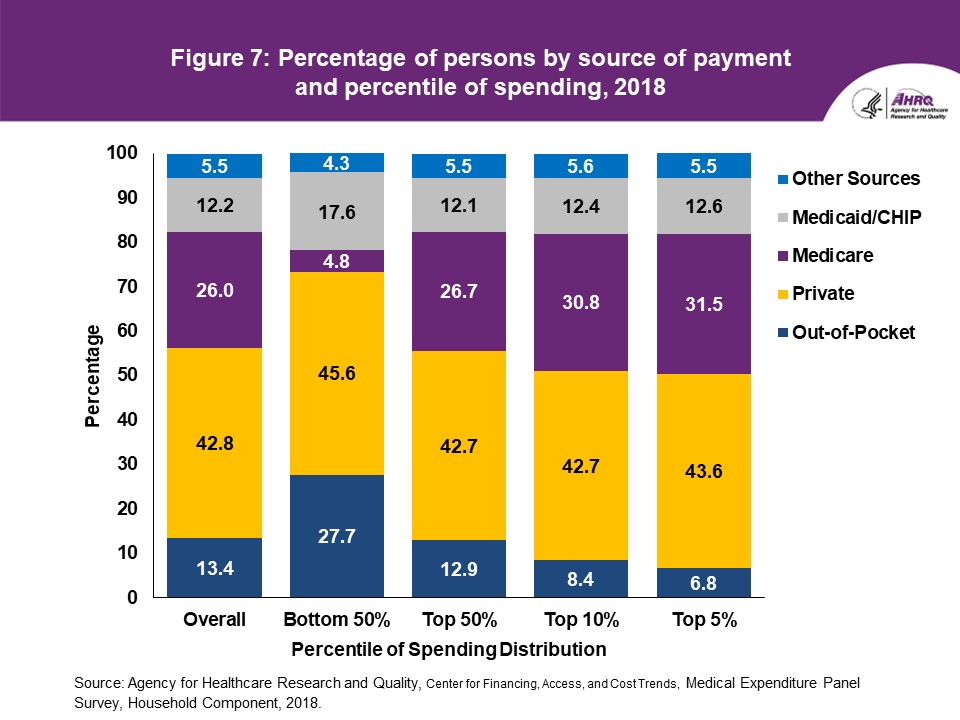
Health conditions (figure 3) The most commonly treated condition among the top 5 percent of spenders in 2018 was hypertension (48.8 percent), followed by osteoarthritis/other non-traumatic joint disorders (44.0 percent) and nervous system disorders (40.0 percent). In the overall population, however, the percentages of persons who received treatment for these conditions were only 18.9, 16.7, and 12.1, respectively. Other conditions for which at least 25 percent of persons in the top 5 percent were treated include hyperlipidemia; mental disorders; chronic obstructive pulmonary disease (COPD), asthma, and other respiratory conditions; heart disease; and diabetes mellitus. Note that while these conditions are the most common among high spenders, they are not necessarily the most expensive conditions to treat. Rather, the top spending group is more likely to include persons with multiple chronic conditions or expensive treatments (e.g., surgeries, hospitalizations) related to these conditions. Age (figure 4) Older persons were disproportionately represented in the higher healthcare spending tiers (figure 4). Among the entire U.S. civilian noninstitutionalized population in 2018, 16.8 percent were 65 and older, while 22.6 percent were under age 18. Among the top 5 percent of spenders, however, 39.0 percent were 65 and older, while only 5.8 percent were children under age 18. In contrast, among the bottom 50 percent of spenders, 30.6 percent were children while only 6.0 percent were 65 years and older. Race/ethnicity (figure 5) Non-Hispanic whites were disproportionately represented among the top 50 percent of spenders, while Hispanics were underrepresented in this higher spending group. In 2018, 59.7 percent of the U.S. civilian noninstitutionalized population was white, but whites accounted for 70.3 percent of the top half of spenders. In the same year, 18.5 percent of the population was Hispanic, but only 11.7 percent of the top half of spenders were Hispanic. Type of service (figure 6) Compared to the overall population, expenses for persons in the bottom 50 percent of spenders were less likely to go toward inpatient stays or home health expenses (0.1 percent for each), and more likely to go toward ambulatory events (55.7 percent). Among the top 5 percent of spenders, on the other hand, 36.4 percent of their expenses were for inpatient stays. This comparatively high proportion of expenditures owes to a combination of the fact that persons in the top spending percentiles are much more likely to have at least one inpatient stay during the year, and those stays tend to cost more relative to other types of service. Source of payment (figure 7) Nearly half of aggregate expenses for the bottom 50 percent of spenders were paid for by private insurance (45.6 percent), while out-of-pocket payments accounted for around a quarter of the expenditures for this group (27.7 percent). Only 4.8 percent of expenditures for this low-spending group were Medicare payments. For persons in the top 5 percent spending tier, Medicare paid for 31.5 percent of their total medical expenses, and private insurance paid for 43.6 percent. Out-of-pocket payments for this group amounted to only 6.8 percent of total expenses. |
||||||||||||||||||||||||||||||||||||||||||
Data SourceThe estimates shown in this Statistical Brief are based on data from the MEPS 2018 Full-Year Consolidated Data File (HC-209). |
||||||||||||||||||||||||||||||||||||||||||
DefinitionsAge Age was defined as age at the end of the year 2018 (or on the last date of MEPS eligibility if the person was out of scope at the end of the year). Concentration curve A concentration curve is a graphical representation of the distribution of a variable of interest, such as income or expenditures, across the percentage of the population. The cumulative percentage of the population is represented along the X-axis, and the cumulative percentage of expenditures is represented on the Y-axis. A point at the X-axis value of 50 percent and the Y-axis value of 10 percent, for instance, indicates that the bottom 50 percent of the population accounts for 10 percent of total spending, and conversely, the top 50 percent accounts for 90 percent of total spending. Similarly, a point at the X-axis value of 99 percent and the Y-axis value of 82 percent indicates that the bottom 99 percent of the population accounts for 82 percent of spending, and conversely, that the top 1 percent of the population accounts for 18 percent of expenditures. Expenditures Total expenditures were defined as the sum of payments from all sources to hospitals, physicians, other healthcare providers (including dental care), and pharmacies for services reported by respondents in the MEPS-HC. Health conditions Persons were classified as treated for a particular condition if they had one or more healthcare events (i.e., office-based, hospital outpatient or emergency room visits, hospital inpatient stays, prescribed medicine purchases, or home healthcare) where the condition was reported as leading to or discovered during the event. The health conditions reported in this Statistical Brief are the most commonly treated conditions among high spenders and are not mutually exclusive. Percentiles Percentiles of spending were formed by ordering sampled persons by their total expenditures from highest to lowest, and then allocating persons to groups based on weighted percentage of the population. Near the cut point of each percentile, a person was included in the top percentile group if his or her added weight did not surpass the specified percentile. In the case of ties, where two or more people had the same expenditures close to a percentile cut point, the person with the lower weight was included in the higher percentile group. In this brief, the "bottom 50 percent" and "top 50 percent" are mutually exclusive, while the "top 50 percent," "top 30 percent," "top 10 percent," "top 5 percent," and "top 1 percent" are not. Race/ethnicity MEPS respondents were asked if each family member was Hispanic or Latino and about each member's race. Based on this information, categories of race and Hispanic origin were constructed as follows:
|
||||||||||||||||||||||||||||||||||||||||||
About MEPSThe Medical Expenditure Panel Survey Household Component (MEPS-HC) collects nationally representative data on healthcare use, expenditures, sources of payment, and insurance coverage for the U.S. civilian noninstitutionalized population. The MEPS-HC is cosponsored by the Agency for Healthcare Research and Quality (AHRQ) and the National Center for Health Statistics (NCHS). More information about the MEPS-HC can be found on the MEPS website athttps://www.meps.ahrq.gov/mepsweb. |
||||||||||||||||||||||||||||||||||||||||||
ReferencesThe following methodology reports contain information on the survey and sample designs for the MEPS-HC and MEPS Medical Provider Component.Data collected in these two components are jointly used to derive MEPS healthcare expenditure data. Cohen, J. Design and Methods of the Medical Expenditure Panel Survey Household Component. MEPS Methodology Report No. 1. AHCPR Pub. No. 97-0026. 1997. Agency for Health Care Policy and Research (AHCPR), Rockville, MD. http://www.meps.ahrq.gov/mepsweb/data_files/publications/mr1/mr1.pdf Ezzati-Rice, T. M., Rohde, F., and Greenblatt, J., Sample Design of the Medical Expenditure Panel Survey Household Component, 1998–2007. Methodology Report No. 22. March 2008. Agency for Healthcare Research and Quality, Rockville, MD. http://www.meps.ahrq.gov/mepsweb/data_files/publications/mr22/mr22.pdf Machlin, S. R., Chowdhury, S. R., Ezzati-Rice, T., DiGaetano, R., Goksel, H., Wun, L.-M., Yu, W., and Kashihara, D. Estimation Procedures for the Medical Expenditure Panel Survey Household Component. Methodology Report #24. September 2010. Agency for Healthcare Research and Quality, Rockville, MD. https://www.meps.ahrq.gov/data_files/publications/mr24/mr24.shtml Stagnitti, M. N., Beauregard, K., and Solis, A. Design, Methods, and Field Results of the Medical Expenditure Panel Survey Medical Provider Component (MEPS MPC)—2006 Calendar Year Data. Methodology Report No. 23. November 2008. Agency for Healthcare Research and Quality, Rockville, MD. http://www.meps.ahrq.gov/mepsweb/data_files/publications/mr23/mr23.pdf |
||||||||||||||||||||||||||||||||||||||||||
Suggested CitationMitchell, E. M. Concentration of Healthcare Expenditures and Selected Characteristics of Persons with High Expenses, U.S. Civilian Noninstitutionalized Population, 2018. Statistical Brief #533. January 2021. Agency for Healthcare Research and Quality, Rockville, MD.http://www.meps.ahrq.gov/mepsweb/data_files/publications/st533/stat533.shtml AHRQ welcomes questions and comments from readers of this publication who are interested in obtaining more information about access, cost, use, financing, and quality of health care in the United States. We also invite you to tell us how you are using this Statistical Brief and other MEPS data and tools and to share suggestions on how MEPS products might be enhanced to further meet your needs. Please email us at MEPSProjectDirector@ahrq.hhs.gov or send a letter to the address below: Joel Cohen, PhD, Director Center for Financing, Access, and Cost Trends Agency for Healthcare Research and Quality 5600 Fishers Lane Rockville, MD 20857 |
||||||||||||||||||||||||||||||||||||||||||
|
1 Keehan, S, et al. National Health Expenditure Projections, 2019-28: Expected Rebound in Prices Drives Rising Spending Growth. Health Affairs, April 2020. |
||||||||||||||||||||||||||||||||||||||||||
 |
||||||||||||||||||||||||||||||||||||||||||
Source: Agency for Healthcare Research and Quality, Center for Financing, Access, and Cost Trends, Medical Expenditure Panel Survey, Household Component, 2018. |
||||||||||||||||||||||||||||||||||||||||||
 |
||||||||||||||||||||||||||||||||||||||||||
Source: Agency for Healthcare Research and Quality, Center for Financing, Access, and Cost Trends, Medical Expenditure Panel Survey, Household Component, 2018. |
||||||||||||||||||||||||||||||||||||||||||
 |
||||||||||||||||||||||||||||||||||||||||||
Source: Agency for Healthcare Research and Quality, Center for Financing, Access, and Cost Trends, Medical Expenditure Panel Survey, Household Component, 2018. |
||||||||||||||||||||||||||||||||||||||||||
 |
||||||||||||||||||||||||||||||||||||||||||
Source: Agency for Healthcare Research and Quality, Center for Financing, Access, and Cost Trends, Medical Expenditure Panel Survey, Household Component, 2018. |
||||||||||||||||||||||||||||||||||||||||||
 |
||||||||||||||||||||||||||||||||||||||||||
Note: Black, white, Asian, and other race/ethnicity groups refer to non-Hispanic persons only. |
||||||||||||||||||||||||||||||||||||||||||
 |
||||||||||||||||||||||||||||||||||||||||||
* Home health and inpatient stays each comprise 0.1 percent of the bottom 50 percent. |
||||||||||||||||||||||||||||||||||||||||||
 |
||||||||||||||||||||||||||||||||||||||||||
Source: Agency for Healthcare Research and Quality, Center for Financing, Access, and Cost Trends, Medical Expenditure Panel Survey, Household Component, 2018. |
| |||||||||||||||||||||||||||||||||||||||||