Skip to main content

|
||||||||||||||
|
|
||||||||||||||
STATISTICAL BRIEF #534:
|
||||||||||||||
| February 2021 | ||||||||||||||
| Rebecca Ahrnsbrak and Marie N. Stagnitti, MPA
|
||||||||||||||
Highlights
|
||||||||||||||
IntroductionIn 2018, an estimated 19.1 percent of adults in the U.S. civilian noninstitutionalized population experienced any mental illness in the past year, while an estimated 4.6 percent suffered from serious mental illness in the past year. In addition, an estimated 14.4 percent of youths aged 12–17 and 7.2 percent of adults experienced at least one major depressive episode in the past year in 2018.[1] Prescription antidepressants and antipsychotics are two types of drug therapies sometimes prescribed to treat mental illness. As more people use prescription antidepressants and antipsychotics, it is important for policymakers and researchers to understand changes in the utilization of these drugs as well as changes in expenditures for these drugs.This Statistical Brief presents a comparison of prescription antidepressant and antipsychotic utilization and expenditures in the U.S. civilian noninstitutionalized population between the years 2013 and 2018. Estimates are based on the 2013 Medical Expenditure Panel Survey Household Component (MEPS-HC) and the 2018 MEPS-HC. This Brief compares the number of people obtaining at least one prescription for an antidepressant or antipsychotic medication, total prescription fills, and total expenditures for those medications, as well as the average total, out-of-pocket, and third-party payer expenditures per fill. Estimates are presented separately for antidepressants and antipsychotics. Only prescriptions obtained in an outpatient setting (retail and mail-order prescribed medicines) are included in these estimates. Prescription medicines administered in an inpatient setting or in a clinic or physician's office are excluded. Expenditure estimates are presented in real dollars; estimates for 2013 are inflated to 2018 dollars based on the Gross Domestic Product (GDP) price index (http://www.meps.ahrq.gov/mepsweb/about_meps/Price_Index.shtml). All differences between estimates discussed in the text are statistically significant at the 0.05 level unless otherwise noted. |
||||||||||||||
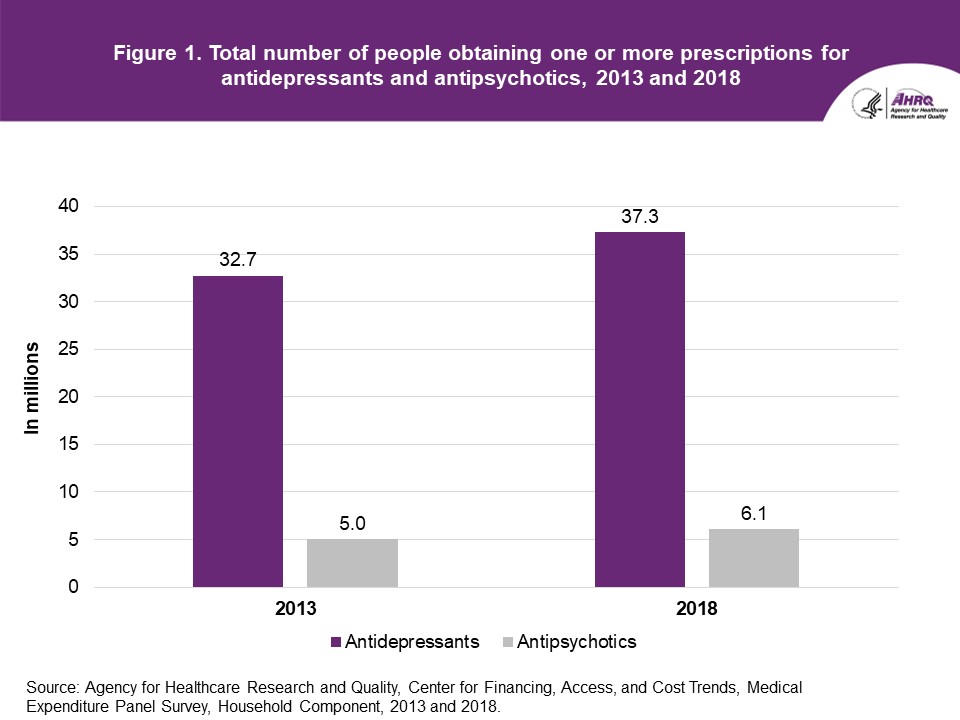
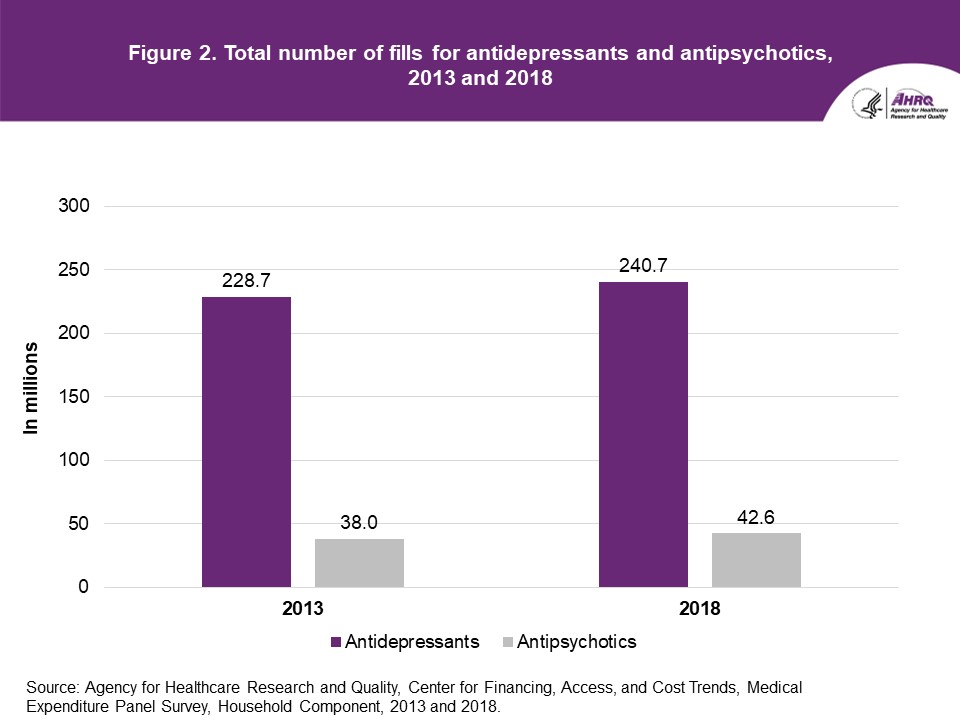
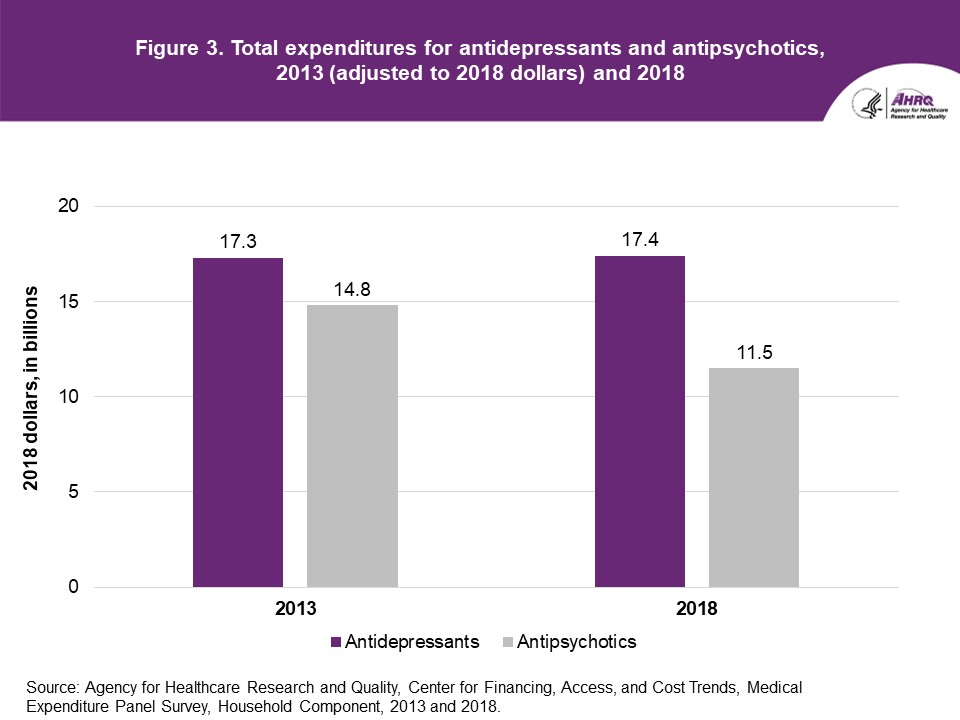
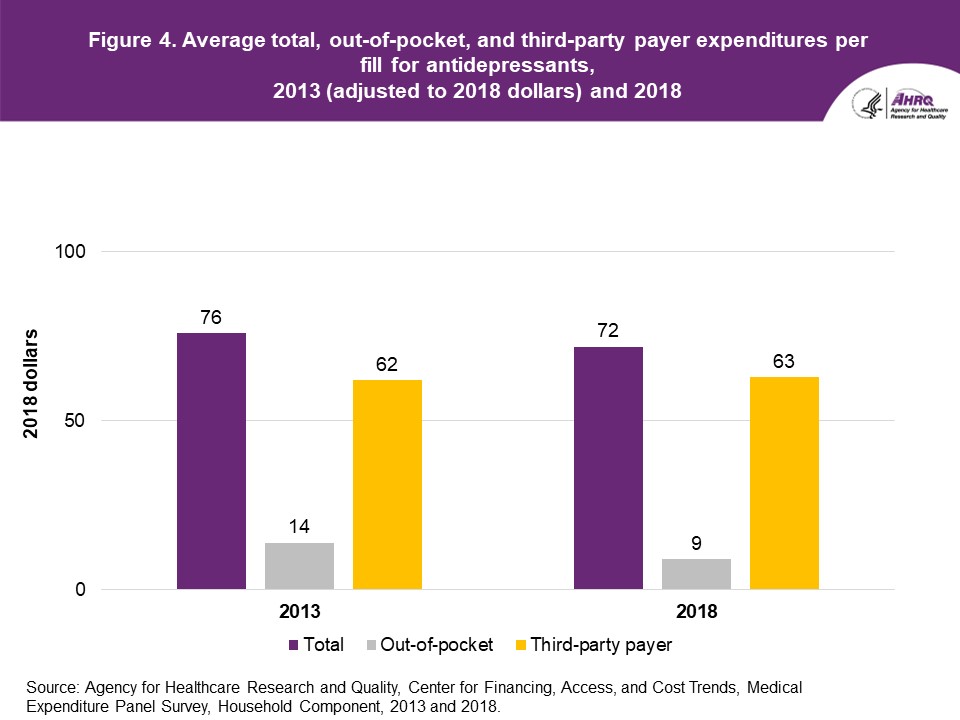
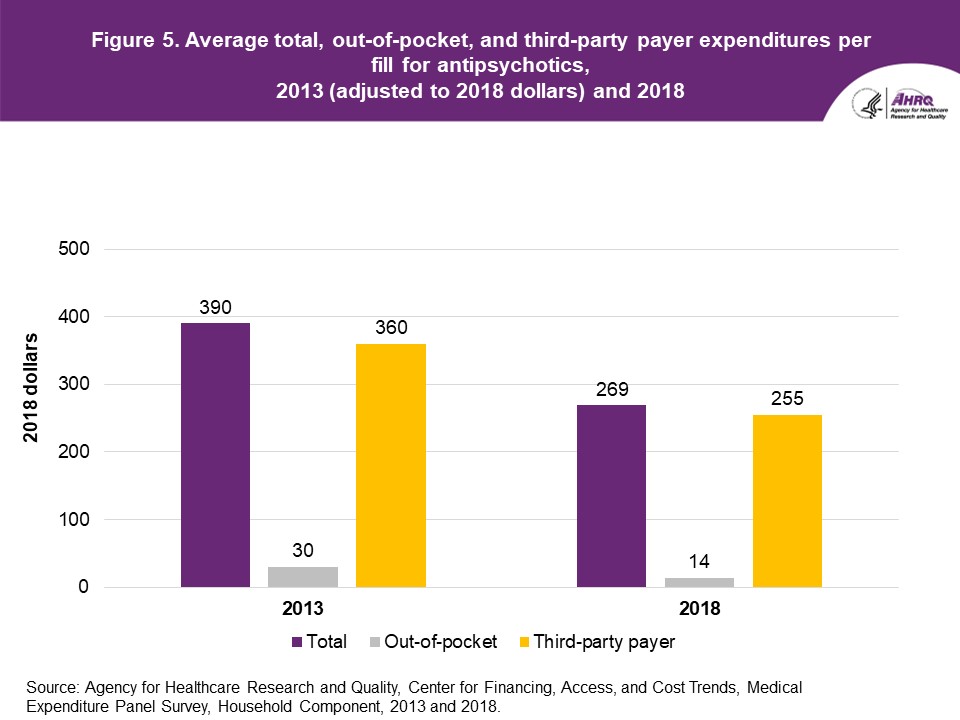
FindingsUtilization (figures 1 and 2)The total number of people obtaining at least one antidepressant prescription increased from 32.7 million in 2013 to 37.3 million in 2018 (figure 1). The total number of antidepressant fills was 228.7 million in 2013 and 240.7 million in 2018 (figure 2); this change was not statistically significant. Between 2013 and 2018, the total number of people obtaining at least one antipsychotic prescription increased from 5.0 million in 2013 to 6.1 million in 2018 (figure 1). The total number of antipsychotic fills was 38.0 million in 2013 and 42.6 million in 2018 (figure 2); this change was not statistically significant. Expenditures (figures 3–5) Between 2013 and 2018, total expenditures for antidepressants remained stable, with $17.3 billion in expenditures in 2013 and $17.4 billion in expenditures in 2018 (figure 3). Moreover, while the average total expenditure per fill for antidepressants also remained stable, at $76 in 2013 and $72 in 2018, the average out-of-pocket expenditure per fill decreased from $14 in 2013 to $9 in 2018, while the average third-party payer expenditure remained stable at $62 in 2013 and $63 in 2018 (figure 4). Total expenditures for antipsychotics were $14.8 billion in 2013 and $11.5 billion in 2018 (no significant difference) (figure 3). However, the average total expenditure per fill for antipsychotics decreased from $390 in 2013 to $269 in 2018, and the average third-party payer expenditure per fill decreased from $360 in 2013 to $255 in 2018 (figure 5). The average out-of-pocket expenditure per fill was $30 in 2013 and $14 in 2018; this difference was not statistically significant. |
||||||||||||||
Data SourceThe estimates reported in this Brief are based on data from the following Medical Expenditure Panel Survey (MEPS) data files:
The files used for this analysis are confidential internal versions (available to outside researchers through the Agency for Healthcare Research and Quality Data Center). MEPS public use files are downloadable from https://meps.ahrq.gov/data_stats/download_data_files.jsp. |
||||||||||||||
DefinitionsPurchases and expenditures Utilization is defined as purchasing or obtaining a prescription in the year of interest. Refills as well as original prescriptions are included in expenditure and utilization estimates. Expenditures include the total direct payments from all sources to pharmacies for prescriptions reported by respondents in the MEPS-HC. Expenditures are in real dollars; estimates for 2013 are inflated to 2018 dollars based on the GDP price index (http://www.meps.ahrq.gov/mepsweb/about_meps/Price_Index.shtml). Therapeutic classifications Therapeutic class and subclass were assigned to MEPS prescribed medicines using Multum Lexicon variables from Cerner Multum, Inc. MEPS prescribed medicines files were linked to the Multum Lexicon database to obtain therapeutic class and subclass variables. The following were used to define antidepressants in 2013 and 2018—therapeutic class: psychotherapeutic agents; subclass: antidepressants. The following were used to define antipsychotics in 2013—therapeutic class: psychotherapeutic agents; subclass: antipsychotics. The following were used to define antipsychotics in 2018—therapeutic class: psychotherapeutic agents; subclass: antipsychotics or antimanics. In 2013, there was no antimanic subclass. Prescribed medicines classified in 2018 as antimanics were classified in the miscellaneous antipsychotics sub-subclass under the antipsychotics subclass in 2013. A prescribed medicine can be assigned multiple therapeutic classes and subclasses. The estimates presented in this Brief include all prescribed medicines assigned to the therapeutic subclass of antidepressant or antipsychotic, regardless of whether that prescribed medicine has other possible therapeutic class or subclass assignments. For example, bupropion is included in estimates of antidepressants despite also being assigned to the Multum therapeutic class of miscellaneous agents and therapeutic subclass of smoking cessation aids. For additional information on these and other Multum Lexicon variables, please refer to the Multum website. When looking at estimates over time for therapeutic subclass and sub-subclasses, it is important to keep in mind that many factors can play a role. Drugs are reclassified due to changes in the Multum therapeutic classification scheme. Also, new drugs become available over time, and generic versions of previously brand-name-only drugs become available. Sources of Payment
|
||||||||||||||
About MEPSThe Medical Expenditure Panel Survey Household Component (MEPS-HC) collects nationally representative data on healthcare use, expenditures, sources of payment, and insurance coverage for the U.S. civilian noninstitutionalized population. The MEPS-HC is cosponsored by the Agency for Healthcare Research and Quality (AHRQ) and the National Center for Health Statistics (NCHS). More information about the MEPS-HC can be found on the MEPS website at https://www.meps.ahrq.gov/mepsweb. |
||||||||||||||
ReferencesFor a detailed description of the MEPS-HC survey design, sample design, and methods used to minimize sources of nonsampling error, see the following publications:Agency for Healthcare Research and Quality. Using Appropriate Price Indices for Analyses of Health Care Expenditures or Income across Multiple Years. 2018. Agency for Healthcare Research and Quality, Rockville, MD. http://www.meps.ahrq.gov/mepsweb/about_meps/Price_Index.shtml Cohen, J. Design and Methods of the Medical Expenditure Panel Survey Household Component. MEPS Methodology Report No. 1. AHCPR Pub. No. 97-0026. 1997. Agency for Health Care Policy and Research (AHCPR), Rockville, MD. http://www.meps.ahrq.gov/mepsweb/data_files/publications/mr1/mr1.shtml Cohen, S. Sample Design of the 1996 Medical Expenditure Panel Survey Household Component. MEPS Methodology Report No. 2. AHCPR Pub. No. 97-0027. 1997. Agency for Health Care Policy and Research (AHCPR), Rockville, MD. http://www.meps.ahrq.gov/mepsweb/data_files/publications/mr2/mr2.shtml Cohen, S. Design Strategies and Innovations in the Medical Expenditure Panel Survey. July 2003. Medical Care, 41(7) Supplement, III-5–III-12. Ezzati-Rice, T. M., Rohde, F., and Greenblatt, J. Sample Design of the Medical Expenditure Panel Survey Household Component, 1998–2007. Methodology Report #22. March 2008. Agency for Healthcare Research and Quality, Rockville, MD. http://www.meps.ahrq.gov/mepsweb/data_files/publications/mr22/mr22.shtml Hill, S. C., Roemer, M., and Stagnitti, M. N. Outpatient Prescription Drugs: Data Collection and Editing in the 2011 Medical Expenditure Panel Survey. Methodology Report #29. March 2014. Agency for Healthcare Research and Quality, Rockville, MD. http://www.meps.ahrq.gov/mepsweb/data_files/publications/mr29/mr29.shtml Hill, S. C., Zuvekas, S. H., and Zodet, M. W. The Validity of Reported Medicare Part D Enrollment in the Medical Expenditure Panel Survey. December 2012. Medical Research and Review, 69(6), 737–750. Sing, M., Banthin, J. S., Selden, T. M., Cowan, C. A., and Keehan, S. P. Reconciling Medical Expenditure Estimates from the MEPS and NHEA, 2002. Fall 2006. Health Care Financing Review, 28(1), 25–40. https://www.cms.gov/HealthCareFinancingReview/downloads/06Fallpg25.pdf Stagnitti, M. N., Beauregard, K., and Solis, A. Design, Methods, and Field Results of the Medical Expenditure Panel Survey Medical Provider Component (MEPS MPC)—2006 Calendar Year Data. Methodology Report #23. November 2008. Agency for Healthcare Research and Quality, Rockville, MD. http://www.meps.ahrq.gov/mepsweb/data_files/publications/mr23/mr23.shtml |
||||||||||||||
Suggested CitationAhrnsbrak, R., and Stagnitti, M. N. Comparison of Antidepressant and Antipsychotic Utilization and Expenditures in the U.S. Civilian Noninstitutionalized Population, 2013 and 2018. Statistical Brief #534. December 2020. Agency for Healthcare Research and Quality, Rockville, MD. https://meps.ahrq.gov/data_files/publications/st534/stat534.shtmlAHRQ welcomes questions and comments from readers of this publication who are interested in obtaining more information about access, cost, use, financing, and quality of health care in the United States. We also invite you to tell us how you are using this Statistical Brief and other MEPS data and tools and to share suggestions on how MEPS products might be enhanced to further meet your needs. Please email us at MEPSProjectDirector@ahrq.hhs.gov or send a letter to the address below: Joel Cohen, PhD, Director Center for Financing, Access, and Cost Trends Agency for Healthcare Research and Quality 5600 Fishers Lane Rockville, MD 20857 |
||||||||||||||
|
[1] Substance Abuse and Mental Health Services Administration. Key Substance Use and Mental Health Indicators in the United States: Results from the 2018 National Survey on Drug Use and Health. U.S. Department of Health and Human Services Publication No. PEP19-5068, National Survey on Drug Use and Health Series H-54. 2019. Center for Behavioral Health Statistics and Quality, Substance Abuse and Mental Health Services Administration, Rockville, MD. https://www.samhsa.gov/data/report/2018-nsduh-annual-national-report |
||||||||||||||
 |
||||||||||||||
Source: Agency for Healthcare Research and Quality, Center for Financing, Access and Cost Trends, Medical Expenditure Panel Survey, Household Component, 2013 and 2018. |
||||||||||||||
 |
||||||||||||||
Source: Agency for Healthcare Research and Quality, Center for Financing, Access and Cost Trends, Medical Expenditure Panel Survey, Household Component, 2013 and 2018. |
||||||||||||||
 |
||||||||||||||
Source: Agency for Healthcare Research and Quality, Center for Financing, Access and Cost Trends, Medical Expenditure Panel Survey, Household Component, 2013 and 2018. |
||||||||||||||
 |
||||||||||||||
Source: Agency for Healthcare Research and Quality, Center for Financing, Access and Cost Trends, Medical Expenditure Panel Survey, Household Component, 2013 and 2018. |
||||||||||||||
 |
||||||||||||||
Source: Agency for Healthcare Research and Quality, Center for Financing, Access and Cost Trends, Medical Expenditure Panel Survey, Household Component, 2013 and 2018. |
| |||||||||||||