
|
|
|
Font Size:
|
||||
|
|
|
|
||||
Bone Density Scan (DEXA) Utilization Among Women Without Diagnosed Osteoporosis Aged 50 and Older in the United States, 2022
Statistical Brief #569 | December 2025 | Terceira A. Berdahl, PhD
Highlights
- Less than half of all women aged 50 and older (42.8%) without diagnosed osteoporosis reported ever having a DEXA scan in 2022. More women aged 65 and older (67.6%) reported DEXA scans compared to younger women aged 50-64 (24.8%).
- Women over age 65 who had Medicare or Medicare/Private insurance were more likely to have screening exams, relative to women who had Medicare/Other Public insurance.
- Among women aged 50-64, those with private health insurance were more likely (27.9%) to ever have had a DEXA scan compared to those with only public insurance (17.4%).
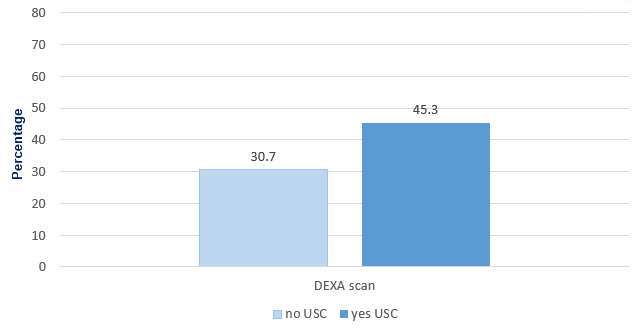
- Women with a usual source of care provider were more likely than those without a usual source of care provider to have ever received a DEXA scan (45.3% vs. 30.7%).
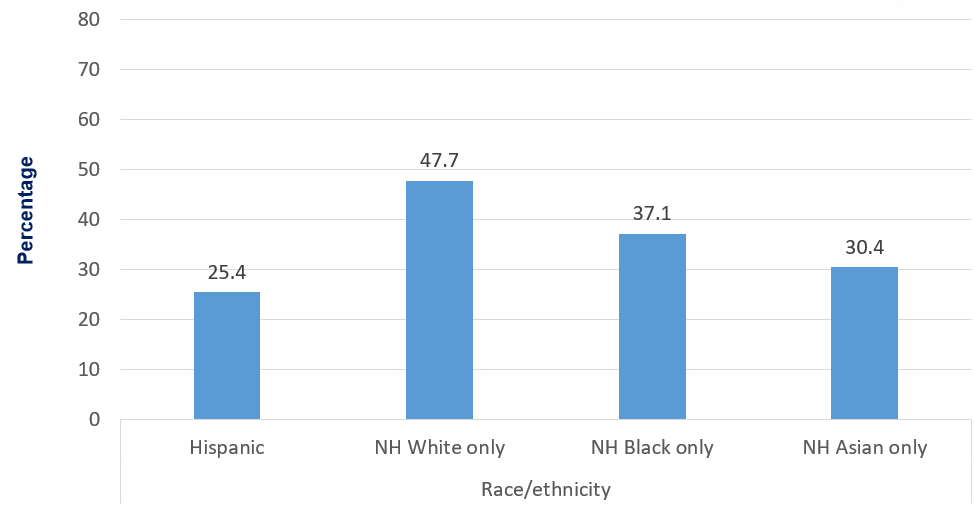
- Among racial-ethnic groups, Hispanic women had the lowest DEXA screening rates (25.4%) while non-Hispanic white women had the highest rates (47.7%).
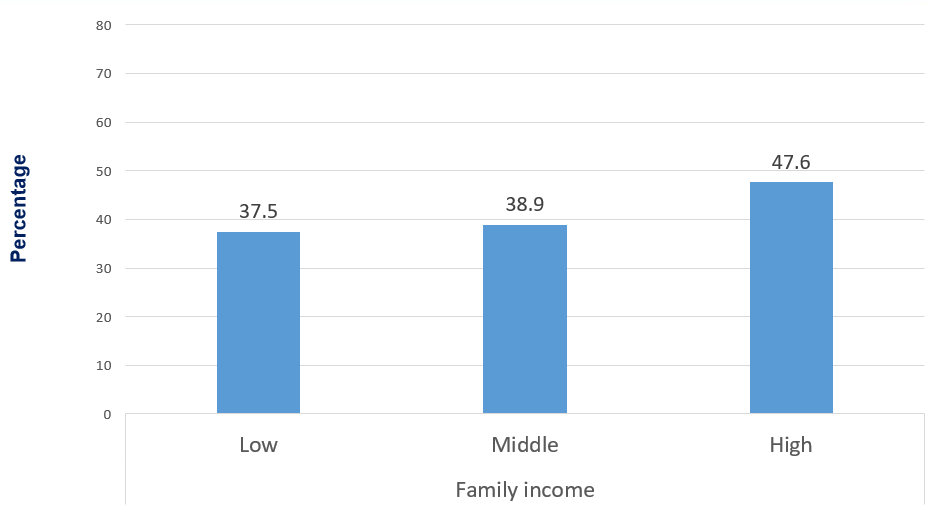
- Women who lived in higher-income families were more likely (47.6%) to ever have a DEXA scan relative to those in lowerincome or middle-income families (37.5% and 38.9%).
Introduction
Low bone density is the primary indicator of osteoporosis, and a bone density screening test is how osteoporosis is diagnosed.1 Osteoporosis is a progressive bone disease that increases the risk of fractures and subsequent mortality.2 The disease impacts older women, primarily, although not exclusively.3 Because the disease can be severe without any symptoms, preventive screening using a low-dose x-ray test called a DEXA scan is recommended for all women aged 65 and older.4 This recommended age is not without criticism, as osteoporosis can occur at younger ages.5 Some doctors urge women to have DEXA scans prior to menopause or at the beginning of menopause around age 50, when detecting low bone density could allow for more effective interventions, including hormone replacement therapy and bone building prescription medications. While women already diagnosed with osteoporosis may be receiving treatments, undiagnosed women will continue to have the disease progress without preventive treatment.
Using recent data from the Medical Expenditure Panel Survey-Household Component (MEPS-HC) 2022, this Statistical Brief provides estimates of ever having low bone density screening (DEXA scan) for women aged 50 and older who do not yet have a diagnosis of osteoporosis. This Brief provides estimates of DEXA screening by age subgroup, insurance status, having a usual source of care, raceethnicity, MSA status, region and family income. Estimates of overall rates of diagnosed osteoporosis are also presented. All estimates are weighted and standard errors are adjusted to account for nonresponse and the MEPS-HC complex survey design. Questions on diagnosis of osteoporosis and DEXA scans (for women without a diagnosis) are included in the Female Preventive Care Self-Administered Questionnaire (SAQ) for women aged 50 and older in 2022, and the female SAQ weight is used for all analyses to produce nationally representative estimates. Unless otherwise noted, all differences discussed in the Brief are statistically significantly different at the .05 level.
Findings
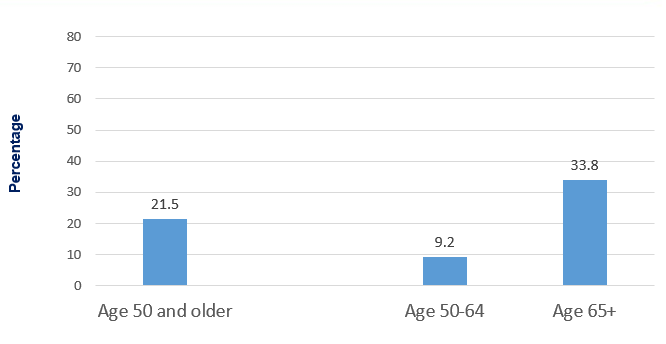
Percentage of women aged 50 and older with diagnosed osteoporosis, 2022 (Figure 1)
In 2022 (Figure 1), 21.5 percent of women reported having diagnosed osteoporosis. Women aged 65 and older had higher rates of diagnosed osteoporosis (33.8%) relative to younger women aged 50-64 (9.2%).
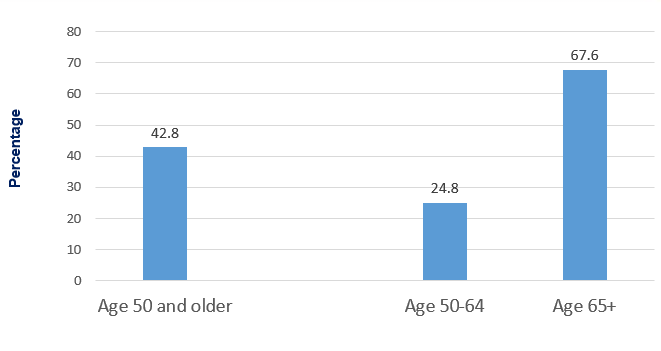
Ever had DEXA scan by age group among women aged 50 and older without diagnosed osteoporosis (Figure 2)
In 2022, 42.8 percent of women aged 50 and older who had never been diagnosed with osteoporosis had a DEXA scan. While less than half of women had a DEXA scan, differences by age subgroup showed that screening was more common for older women. Among women aged 65 and older, 67.6 percent reported ever having a DEXA scan while only 24.8 percent of women aged 50-64 reported ever having had a DEXA scan.
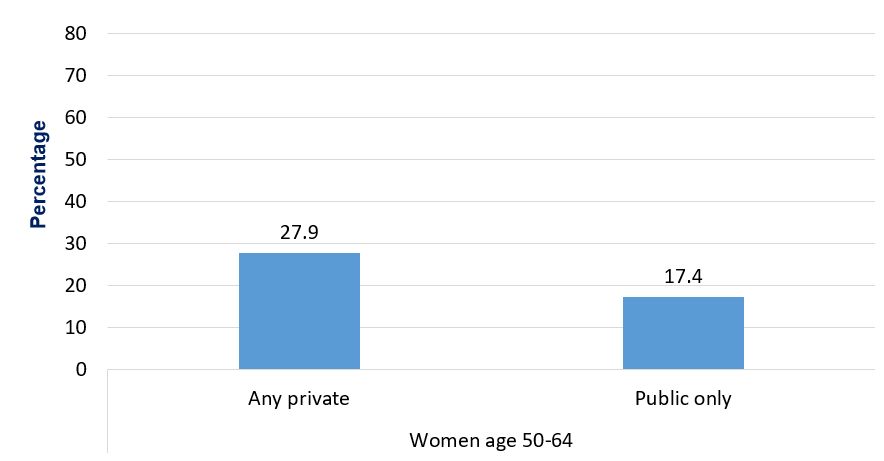
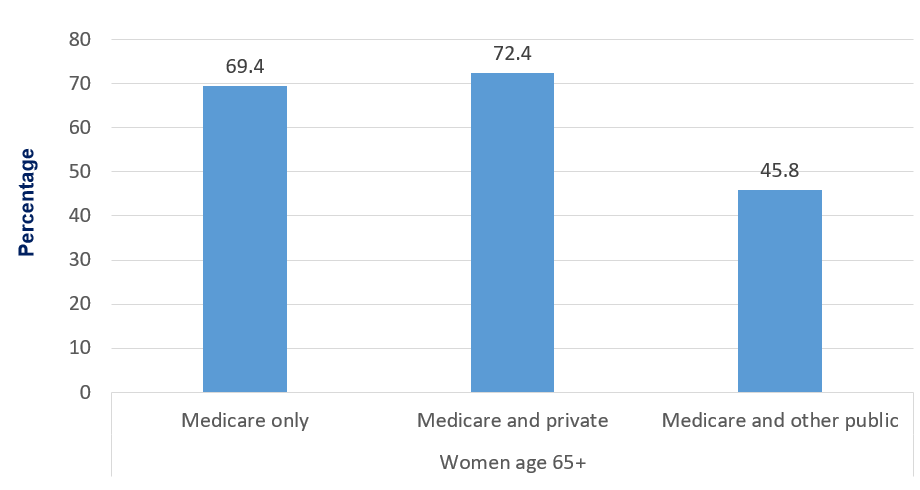
Ever had DEXA scan, health insurance type and age, among women aged 50 and older without diagnosed osteoporosis, 2022 (Figures 3 and 4)
As shown in Figure 3, women aged 50-64 who had private health insurance were more likely to ever have a DEXA scan compared to women who only had public only insurance (27.9% vs. 17.4%). Estimates for uninsured women did not meet standards for presentation due to small sample sizes and are not presented in this Brief. Among women aged 65 and older (Figure 4), those who had both Medicare and Private insurance (72.4%) and those with Medicare only (69.4%) had higher rates of DEXA scan utilization than those with Medicare and other public insurance (45.8%).
Access to a Usual Source of Care and ever had DEXA scan among women aged 50 and older without diagnosed osteoporosis, 2022 (Figure 5)
Women who did not have a usual source of care provider were less likely than those who did to report having ever had a DEXA scan (Figure 5). Among women who had a usual source of care, 45.3 percent reported ever having a DEXA scan, compared to only 30.7 percent of women who did not have a usual source of care.
DEXA scans by demographic and socioeconomic characteristics among women who do not have diagnosed osteoporosis, 2022 (Figure 6, 7 & 8)
As shown in Figure 6, DEXA scan rates were different across categories of race-ethnicity. Hispanic women had the lowest rates of ever having a DEXA scan (25.4%), while non-Hispanic white women had the highest rate (47.7%). Non-Hispanic black women (37.1%) and non-Hispanic Asian women (30.4%) had intermediate rates.
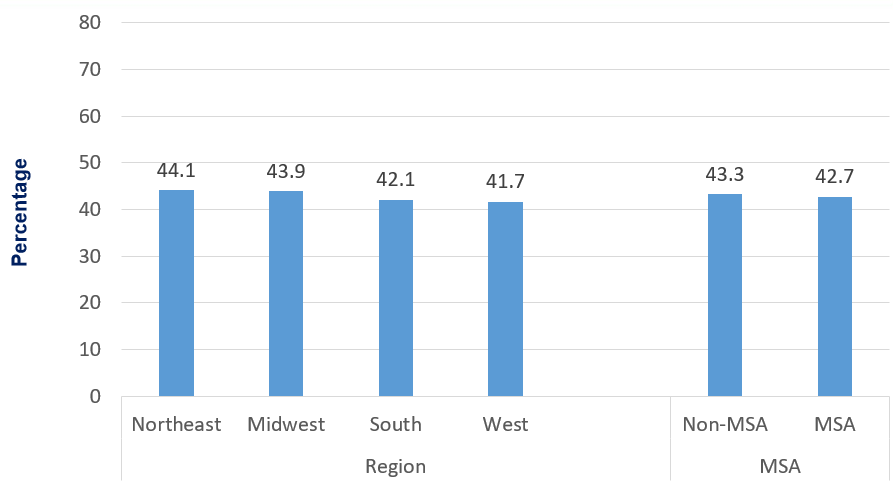
In Figure 7, DEXA scan rates by US Census geographic region and living in an MSA are presented. Rates across the four Census regions were not statistically significantly different and ranged from 41.7 percent (West) to 44.1 percent (Northeast). For residence in an MSA, there was no statistically significant difference between those women living in urban MSA areas compared to those women living in less urban non-MSA areas.
As shown in Figure 8, women living in low-income (37.5%) and middle-income (38.9%) families were less likely than women living in high-income families to ever have had a DEXA scan (47.6%) in 2022.
Data Source
Data for this paper come from the Medical Expenditure Panel Survey Household Component, 2022 Full-Year Consolidated file (HC243). The subsample used for this analysis includes women aged 50 and older who completed the Preventive Care Self-Administered Questionnaire (PSAQ) portion of the MEPS-HC in 2022.
Definitions
Osteoporosis Diagnosis
In the PSAQ, women aged 50 and older were asked, "Have you ever been told by a doctor, nurse or other health care professional that you have osteoporosis? Osteoporosis is when the bones become fragile and break easily."
Bone Density Scan (DEXA)
Ever having a bone density scan (DEXA scan) was included in the female PSAQ for women aged 50 and older in 2022. When a woman aged 50 or older reported that she does not have osteoporosis in the SAQ, she is then asked if she has ever had a bone density scan. Women with diagnosed osteoporosis are not asked about DEXA scans.
Insurance Status
In this Brief, health insurance categories are as follows:
Women aged 50-64 (Figure 3):
- Any private insurance was defined as having had any private insurance coverage [including TRICARE/CHAMPVA] at any time during 2022).
- Public only (Person had only public insurance coverage [excluding TRICARE/CHAMPVA] during 2022).
- Uninsured women were not covered by any type of insurance. Due to the small sample size of uninsured women over age 50 who fit sample criteria for this study, no estimates for uninsured women were presented.
Women aged 65 and older (Figure 4):
- Medicare only (65+) includes women aged 65 or older who were covered by edited Medicare only.
- Medicare and private (65+) includes women aged 65 or older and were covered by edited Medicare and private insurance or TRICARE/CHAMPVA.
- Medicare and other pub only (65+) includes women aged 65 or older who were covered by edited Medicare and public insurance including edited Medicaid/SCHIP or other public coverage but excluding TRICARE/CHAMPVA in 2022.
- Uninsured women were not covered by any type of insurance. Due to the small sample size of uninsured women over age 65 who fit sample criteria for this study, no estimates for uninsured women were presented.
Usual Source of Care
Women who had a particular doctor's office, clinic, health center, or other place to go for medical care when ill or for health-related advice were considered to have access to a Usual Source of Care (USC) provider. Women who indicated they did not have a particular place were considered to lack a usual source of care (USC) provider.
Age
Age was defined as age at the end of the year 2022 (or on last date of MEPS eligibility if the person was out of scope at the end of the year). Three age subgroups are used sections of the analysis, as appropriate: age 50 and older, age 50-64, and age 65 and older.
Race/Ethnicity
MEPS respondents were asked if each family member was Hispanic or Latino and about each member's race. Based on this information, categories of race and Hispanic origin were constructed as follows:
- Hispanic
- White, non-Hispanic with no other race reported
- Black, non-Hispanic with no other race reported
- Asian, non-Hispanic, with no other race reported
The "other/multiple races, non-Hispanic" category is not shown separately in this Brief due to small sample sizes or failure to meet minimum precision requirements. However, those individuals are included in the overall total.
Metro / Non-Metro Area Residence (MSA and Non-MSA)
Residence in a metropolitan statistical area (MSA) was defined by geographical locations designated by the U.S. Office of Management and Budget that are composed of a large population nucleus combined with adjacent communities that have a high degree of economic and social integration with the nucleus. An MSA has one or more central counties containing the area's main population concentration. Residence in a non-MSA indicates a less urban, and more rural location of residence.
Region
The variable region is defined using the four-category U.S. Census Bureau designation that corresponded to the location of residence. Region includes: Northeast, Midwest, South and West. States are categorized into the four regional categories as follows:
- Northeast: Connecticut, Maine, Massachusetts, New Hampshire, New Jersey, New York, Pennsylvania, Rhode Island, and Vermont;
- Midwest: Indiana, Illinois, Iowa, Kansas, Michigan, Minnesota, Missouri, Nebraska, North Dakota, Ohio, South Dakota, and Wisconsin;
- South: Alabama, Arkansas, Delaware, District of Columbia, Florida, Georgia, Kentucky, Louisiana, Maryland, Mississippi, North Carolina, Oklahoma, South Carolina, Tennessee, Texas, Virginia, and West Virginia; or
- West: Alaska, Arizona, California, Colorado, Hawaii, Idaho, Montana, Nevada, New Mexico, Oregon, Utah, Washington, and Wyoming.
Family Income
Family income was classified into the following three categories based on the ratio of total family income to the federal poverty line (FPL), adjusted for family size and composition: low income (less than 200%), middle income (200% to less than 400%), and high income (greater than or equal to 400%) in 2022.
About MEPS
The Medical Expenditure Panel Survey Household Component (MEPS-HC) collects nationally representative data on health care use, expenditures, sources of payment, and insurance coverage for the U.S. civilian noninstitutionalized population. The MEPS-HC is cosponsored by the Agency for Healthcare Research and Quality (AHRQ) and the National Center for Health Statistics (NCHS). More information about the MEPS-HC can be found on the MEPS Web site at https://meps.ahrq.gov.
References
1 Kanis,J., Glüer, CC. & for the Committee of Scientific Advisors, International Osteoporosis Foundation. An Update on the Diagnosis and Assessment of Osteoporosis with Densitometry. Osteoporos Int 11, 192-202 (2000). https://doi.org/10.1007/s001980050281
2 Marshall D, Johnell O, Wedel H. Meta-analysis of how well measures of bone mineral density predict occurrence of osteoporotic fractures BMJ 1996; 312 :1254 doi:10.1136/bmj.312.7041.1254
3 Sarafrzi N, Wambogo EA, Shepherd JA. Osteoporosis or low bone mass in older adults: United States, 2017-2018. NCHS Data Brief, no 405. Hyattsville, MD: National Center for Health Statistics. 2021. DOI: https://dx.doi.org/10.15620/cdc:103477.
4 US Preentive Services Task Force. Screening for Osteoporosis to Prevent Fractures: US Preventive Services Task Force Recommendation Statement. JAMA. 2025;333(6):498-508. doi:10.1001/jama.2024.27154
5 Ishimoo AK, Shah AA. Screening and early treatment for osteoporosis: Who are we missing under age 65? Maturitas. 2024 Sep;187:108044. doi: 10.1016/j.maturitas.2024.108044. Epub 2024 Jun 7. PMID: 38885594.
Suggested Citation
Berdahl, T. A. Bone Density Scan (DEXA) Utilization Among Women Without Diagnosed Osteoporosis Aged 50 and Older in the United States, 2022. Statistical Brief #569. AHRQ Publication No. 25-0093. December 2025. Agency for Healthcare Research and Quality, Rockville, MD. https://meps.ahrq.gov/data_files/publications/st569/stat569.pdf
AHRQ welcomes questions and comments from readers of this publication who are interested in obtaining more information about access, cost, use, financing, and quality of healthcare in the United States. We also invite you to tell us how you are using this Statistical Brief and other MEPS data and tools and to share suggestions on how MEPS products might be enhanced to further meet your needs. Please email us at MEPSProjectDirector@ahrq.hhs.govor send a letter to the address below:
Samuel H. Zuvekas, PhD, Acting Director
Center for Financing, Access and Cost Trends
Agency for Healthcare Research and Quality
5600 Fishers Lane, Mailstop 07W01C
Rockville, MD 20857
Figures
Figure 1. Percentage of women aged 50 and older with diagnosed osteoporosis, 2022
| Age Group | Percentage (%) |
|---|---|
| Age 50 and older | 21.5 |
| Age 50-64 | 9.2 |
| Age 65+ | 33.8 |
Source: Agency for Healthcare Research and Quality, Medical Expenditure Panel Survey, Household Component, 2022.
Figure 2. Percentage ever had DEXA scan, women aged 50 and older without diagnosed osteoporosis, 2022
| Age Group | Percentage (%) |
|---|---|
| Age 50 and older | 42.8 |
| Age 50-64 | 24.8 |
| Age 65+ | 67.6 |
Source: Agency for Healthcare Research and Quality, Medical Expenditure Panel Survey, Household Component, 2022.
Figure 3. Percentage ever had DEXA scan by insurance status, women aged 50-64 and older without diagnosed osteoporosis
| Insurance Status | Percentage (%) |
|---|---|
| Any private | 27.9 |
| Public only | 17.4 |
Source: Agency for Healthcare Research and Quality, Medical Expenditure Panel Survey, Household Component, 2022.
Figure 4. Percentage ever had DEXA scan by insurance status, women aged 65 and older without diagnosed osteoporosis
| Insurance Status | Percentage (%) |
|---|---|
| Medicare only | 69.4 |
| Medicare and private | 72.4 |
| Medicare and other public | 45.8 |
Source: Agency for Healthcare Research and Quality, Medical Expenditure Panel Survey, Household Component, 2022.
Figure 5. Percentage ever had DEXA scan by Usual Source of Care (USC), women aged 50 and older without diagnosed osteoporosis
| Usual Source of Care (USC) | Percentage (%) |
|---|---|
| No USC | 30.7 |
| Yes USC | 45.3 |
Source: Agency for Healthcare Research and Quality, Medical Expenditure Panel Survey, Household Component, 2022.
Figure 6. Percentage ever had DEXA scan by race/ethnicity, women aged 50 and older without diagnosed osteoporosis
| Race / ethnicity | Percentage (%) |
|---|---|
| Hispanic | 25.4 |
| NH White only | 47.7 |
| NH Black only | 37.1 |
| NH Asian only | 30.4 |
Source: Agency for Healthcare Research and Quality, Medical Expenditure Panel Survey, Household Component, 2022.
Figure 7. Percentage ever had DEXA scan by US geographic region and metropolitan (MSA) residence, women aged 50 and older without diagnosed osteoporosis
| Region / MSA status | Percentage (%) |
|---|---|
| Northeast | 44.1 |
| Midwest | 43.9 |
| South | 42.1 |
| West | 41.7 |
| Non-MSA | 43.3 |
| MSA | 42.7 |
Source: Agency for Healthcare Research and Quality, Medical Expenditure Panel Survey, Household Component, 2022.
Figure 8. Percentage ever had DEXA scan by family income level, women aged 50 and older without diagnosed osteoporosis
| Family income level | Percentage (%) |
|---|---|
| Low | 37.5 |
| Middle | 38.9 |
| High | 47.6 |
Source: Agency for Healthcare Research and Quality, Medical Expenditure Panel Survey, Household Component, 2022.
AHRQ Pub. No. 25-0093
December 2025