
|
|
|
Font Size:
|
||||
|
|
|
|
||||
Use of Telehealth in Nonmetropolitan and Metropolitan Areas, United States 2021-2023
Statistical Brief #570 | December 2025 | Sandra Decker, PhD
Highlights
- The percentage of medical visits that take place via telehealth is lower for patients living in nonmetropolitan compared to metropolitan areas for both visits to mental health providers (26.3 compared to 48.9 percent) and other providers (2.6 compared to 3.8 percent).
- Among mental health visits by adult patients experiencing serious psychological distress, less than one-third (27.2%) took place via telehealth for patients living in nonmetropolitan areas compared to over half (51.5%) for patients in metropolitan areas.
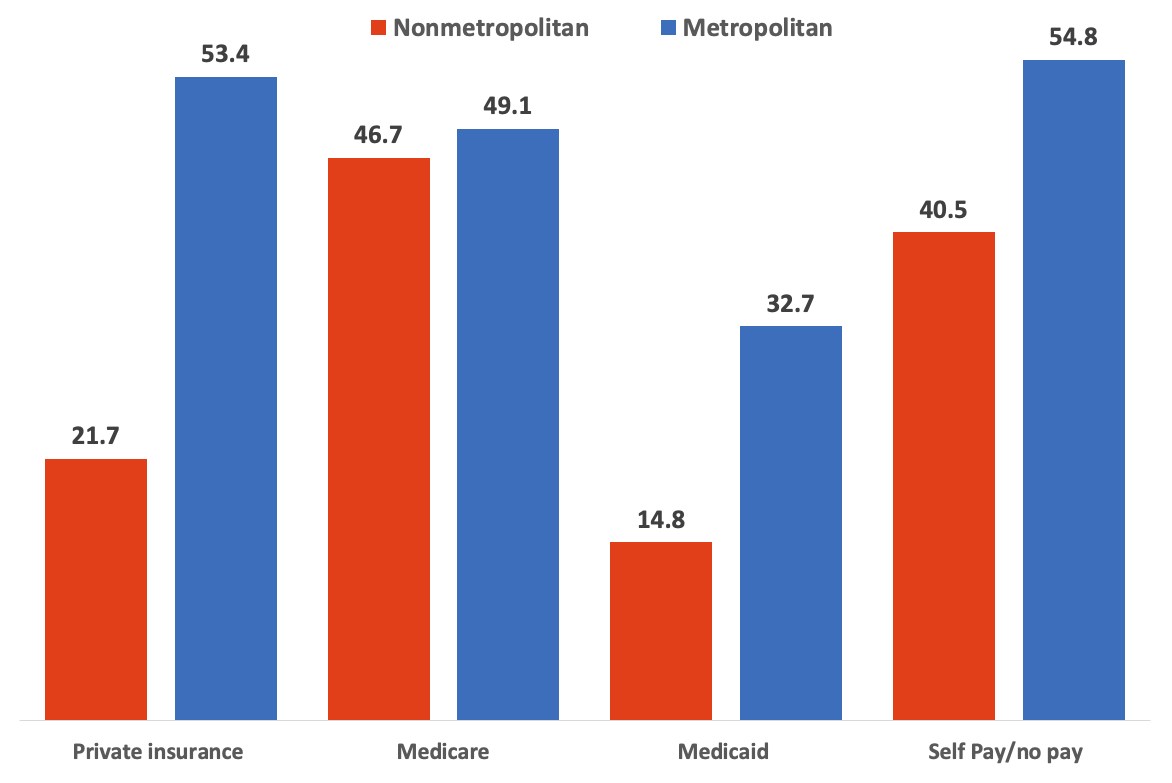
- For visits to mental health providers with private insurance as the primary source of payment, only 21.7 percent took place via telehealth for patients living outside of metropolitan areas compared to 53.4 percent for patients living in metropolitan areas.
- For visits to mental health providers with Medicaid as the primary payer, only 14.8 percent took place via telehealth for patients in nonmetropolitan areas compared to nearly one-third (32.7%) for patients living in metropolitan areas.
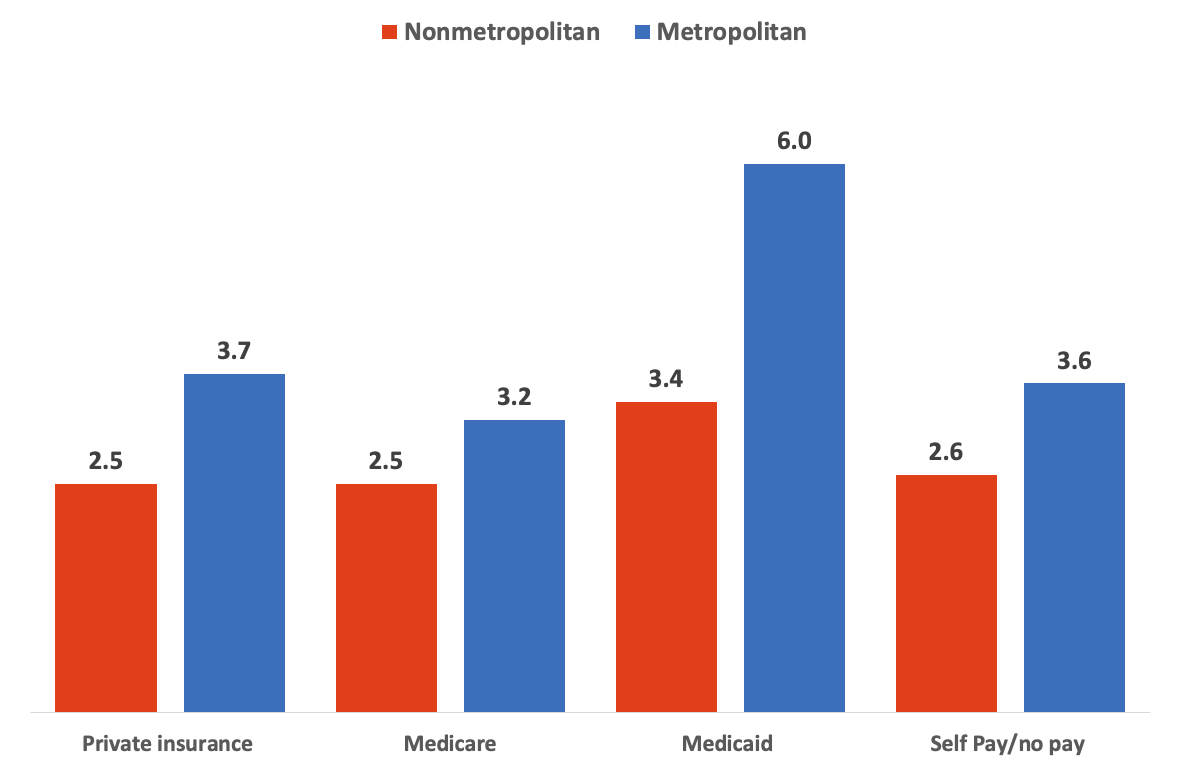
- For visits to non-mental health providers with private insurance as the primary payer, the percent that took place via telehealth was lower for patients living in nonmetropolitan areas (2.5%) compared to those living in metropolitan areas (3.7%).
Introduction
One of the priorities of the Agency for Healthcare Research and Quality (AHRQ) is to define appropriate and cost-effective uses of telehealth to improve patient outcomes.1 A first step toward accomplishing this goal is to document the extent to which telehealth is currently used in the United States. Previous work from AHRQ showed that, in 2021, 6.1 percent of primary care physician visits, 7.8 percent of specialty physician visits, and 11.4 percent of medical visits to other providers took place via telehealth.2 The percent of visits that took place via telehealth was higher for psychiatrists (42.2%) and nonphysician mental health providers (50.4%) compared to visits to other providers (3.5 percent for physician visits excluding psychiatrists and 3.4 percent for visits to non-physician providers outside of mental health).
This Statistical Brief presents estimates of telehealth use among visits in 2021-2023 for patients living in rural compared to urban areas since these groups may benefit differently from access to telemedicine. Access to care in rural areas may be particularly important because these areas bear the greatest burden of chronic disease3 and have higher age-adjusted mortality rates compared to more urban areas.4 Those living in rural areas may also face challenges in accessing care due to provider shortages5 and greater travel distances to obtain care in person.6 This brief also examines differences in telehealth use by source of insurance since different policies may provide different incentives and support to providers to offer telehealth and due to previous work suggesting that access to telemedicine may differ by insurance source.7
The brief relies on data collected from the U.S. civilian noninstitutionalized population through AHRQ's 2021-2023 Medical Expenditure Panel Survey Household Component (MEPS-HC). All differences mentioned in the text are significant at the p<0.05 level or better.
Findings
Telehealth by metropolitan status and provider type (figure 1)
The percentage of visits that took place via telehealth was lower for patients living in nonmetropolitan compared to metropolitan areas for both visits to mental health providers (26.3 compared to 48.9 percent) and other providers (2.6 compared to 3.8 percent). Visits were less likely to take place via telehealth for patients living in nonmetropolitan compared to metropolitan areas for both physicians and other providers, though the difference was largest for visits to mental health providers. For example, among visits to nonphysician mental health providers, only about one-quarter (25.3%) took place via telehealth among patients living in nonmetropolitan areas compared to nearly half (49.8%) among patients living in metropolitan areas.
Telehealth by rurality and provider type (figure 2)
Metropolitan areas can be subdivided into urban and suburban areas, and nonmetropolitan areas can be subdivided into large and small rural areas. Visits to mental health providers were more likely to take place via telehealth in urban areas (54.3%) compared to all other area types, including 36.6 percent for patients living in suburban areas, 24.7 percent in large rural areas, and 30.9 percent in small rural areas. The percentage of visits to non-mental health providers taking place via telehealth was less than half in small rural compared to urban areas (1.9 and 4.4 percent, respectively).
Telehealth for visits to mental health providers by degree of patient psychological distress (figure 3)
The percentage of visits to mental health providers taking place via telehealth was lower for adults living in nonmetropolitan compared to metropolitan areas for adults experiencing all degrees of psychological distress. For example, among visits by adults experiencing serious psychological distress, less than one-third (27.2%) took place via telehealth for patients living in a nonmetropolitan compared to over half (51.5%) for patients in metropolitan areas.
Telehealth for visits to non-mental health providers by specialty (figure 4)
Among visits to providers outside of mental health, the percentage using telehealth was lower for patients living outside compared to inside metropolitan areas for all physician specialty groups. For example, among primary care physician visits, 3.1 percent took place via telehealth for patients living outside of metropolitan areas compared to 5.5 percent for those living inside metropolitan areas.
Visits to mental health providers by primary source of payment (figure 5)
For visits paid for by private insurance or Medicaid, the percentage of visits taking place via telehealth was lower for patients living in nonmetropolitan compared to metropolitan areas. For visits paid for by private insurance, 21.7 percent took place via telehealth for patients living outside of metropolitan areas compared to 53.4 percent for patients living in metropolitan areas. For visits with Medicaid payment, 14.8 percent took place via telehealth for patients in nonmetropolitan areas compared to 32.7 percent for patients outside of those areas.
Visits to non-mental health providers by primary source of payment (figure 6)
For visits to non-mental health providers with payment from private insurance, the percentage that took place via telehealth was lower for patients living in nonmetropolitan areas (2.5%) than for those living in metropolitan areas (3.7%).
Data Source
This Statistical Brief used data from the 2021-2023 Medical Expenditure Panel Survey (MEPS) Medical Visit (HC-229G, HC-239G and HC-248G), Outpatient Visit (HC-229F, HC-239F and HC-248F), and Full-Year Consolidated Data (HC-233. HC-243 and HC-251) files. Due to confidentiality concerns, urban-rural designations for MEPS households are not on public use files but may be accessed for approved projects through the AHRQ Research Data Center (https://meps.ahrq.gov/mepsweb/data_stats/onsite_datacenter.jsp).
Definitions
Telehealth visits
A visit was classified as taking place via telehealth if the MEPS household respondent indicated that the Medical or Outpatient Visit took place via telehealth. [TELEHEALTHFLAG]
Visits to mental health providers
Visits to mental health providers were defined as office or hospital outpatient department visits to psychiatrists, mental health counselors/marital or family therapists, psychologists, or social workers. Visits to non-mental health providers were defined as office or hospital outpatient department visits to all other providers.
Physician specialty
Physicians were considered to be in primary care if the specialty reported for the visit by the MEPS respondent was general or family practice, internal medicine, pediatrics, or geriatrics. Although precise division of other specialties into surgical versus nonsurgical specialties is not possible using households' general descriptions of physician specialty, specialties in this brief were classified broadly as surgical if the reported specialty was general surgery, obstetrics/gynecology, urology, orthopedics, otolaryngology, "proctology," oncology, ophthalmology, plastic surgery, or thoracic surgery. All other specialties outside of primary care were considered "non-surgical specialty".
Psychological distress
The degree of psychological distress was measured using the Kessler-6 (K6).8,9 The K6 evaluates how often in the past 30 days an adult felt so sad that nothing could cheer them up, nervous, restless or fidgety, hopeless, that everything was an effort, and worthless. The K6 total score [K6SUM42] is calculated by adding scores across the six questions, with responses of "all of the time" counting as 4, "most of the time" as 3, "some of the time" as 2, "a little of the time" as 1, and "none of the time" as 0. The degree of psychological distress was classified as none or mild, moderate, and serious for K6 totals of 0-7, 8-12, and 13-24, respectively.
Metropolitan and nonmetropolitan areas
Metropolitan status was determined based on the respondent's county of residence in round 31, 42 (if 31 missing) or 53 (if 31 and 42 missing). These counties were matched with the relevant urban-rural continuum code.10 Metropolitan areas include a core urban population of 50,000 or more and are further divided into urban (urban-rural continuum code 1) and suburban (codes 2-3) areas. Nonmetropolitan areas, considered rural, include all counties outside metropolitan boundaries. They are categorized as large rural (codes 4-6) and small rural (codes 7-19).
Primary source of payment
Primary source of payment was categorized as private insurance if the sources of payment for the office or hospital outpatient visit included private insurance, TRICARE, workers compensation, or other insurance, and any payment from Medicare or Medicaid was less than the payment from private insurance. Source of payment was categorized as Medicare if the sources of payment for the office or hospital outpatient visit included any payment from Medicare, Veterans Administration, or other federal source other than TRICARE, and the Medicare payment was greater than any payment from private insurance. Source of payment was categorized as Medicaid if the sources of payment for the office or hospital outpatient visit included any payment from Medicaid or other state and local government payer, there was no payment from Medicare, Veterans Administration, or other federal source other than TRICARE, and the payment from Medicaid was greater than any payment from private insurance. Source of payment was categorized as self-pay or no pay if the sources of payment for the office or hospital outpatient visit did not include payment from private insurance, Medicare, or Medicaid.
About MEPS
The Medical Expenditure Panel Survey Household Component (MEPS-HC) collects nationally representative data on health care use, expenditures, sources of payment, and insurance coverage for the U.S. civilian noninstitutionalized population. The MEPS-HC is cosponsored by the Agency for Healthcare Research and Quality (AHRQ) and the National Center for Health Statistics (NCHS). More information about the MEPS-HC can be found on the MEPS Web site at https://meps.ahrq.gov.
For a detailed description of the MEPS-HC survey design, sample design, and methods used to minimize sources of non-sampling error, see the following publications:
Cohen J. Design and Methods of the Medical Expenditure Panel Survey Household Component. MEPS Methodology Report No. 1. Agency for Health Care Policy Research Pub. No. 97-0026. Rockville, MD: Agency for Health Care Policy and Research; 1997. https://meps.ahrq.gov/data_files/publications/mr1/mr1.pdf.
Cohen S. Sample Design of the 1996 Medical Expenditure Panel Survey Household Component. MEPS Methodology Report No. 2. Agency for Health Care Policy and Research Pub. No. 97-0027. Rockville, MD: Agency for Healthcare Research and Quality, 1997. https://meps.ahrq.gov/data_files/publications/mr2/mr2.pdf.
References
1 AHRQ Research Priorities and Compliance Guidance. https://www.ahrq.gov/funding/policies/nofoguidance/index.html. Accessed September 18, 2025.
2 Decker SL, Encinosa WE, Zuvekas SH. 2024. Use of Telehealth Among Medical Visits in the United States: Results From the 2021 Medical Expenditure Panel Survey. Annals of Internal Medicine. 177(7): 987-990.
3 Smith SA, Ansa B. 2016. A Systemic Review of Lifestyle Interventions for Chronic Diseases in Rural Areas. Journal of the Georgia Public Health Association. 5(4): 1-15.
4 Moy E, Garcia MC, Bastian B et al. 2017. Leading Cases of Death in Nonmetropolitan and Metropolitan Areas - United States, 1999-2014. Morbidity and Mortality Weekly. 66(1): 1-8.
5 Goins RT, Williams KA, Carter MW, Spencer SM, Solovieva T. 2005. Perceived Barriers to Health Care Access Among Rural Older Adults: A Qualitative Study. The Journal of Rural Health. 21(3): 206-213.
6 Decker SL, Gourevitch RA, Meille G. 2024. Patient Travel Patterns and Concordance with Geographic Market Boundaries. Annals of Internal Medicine. 177(12): 1732-1734.
7 Karimi, M., Lee, E.C., Couture, S. J., Gonzales, A.B., Grigorescu, V., Smith, S.R., De Lew, N., and Sommers, B.D. National Trends in Telehealth Use in 2021: Disparities in Utilization and Audio vs. Video Services. (Research Report No. HP-2022-04). Office of the Assistant Secretary for Planning and Evaluation, U.S. Department of Health and Human Services. February 2022.
8 Kessler RC, Andrews G, Colpe LJ, Hiripi E, Mroczek DK, Normand, S.L.T., Walters, EE, Zaslavsky A. 2002. Short Screening Scales to Monitor Population Prevalences and Trends in Nonspecific Psychological Distress Psychological Medicine, 32(6), 959-976.
9 Kessler RC, Barker, PR, Colpe, LJ, Epstein, JF, Gfroerer JC, Hiripi E, Howes MJ, Normand, S.L.T., Manderscheid, RW, Walters, EE, Zaslavsky, A M. 2003. Screening for Serious Mental Illness in the General Population Archives of General Psychiatry, 60(2), 184-189.
10 U.S. Department of Agriculture. 2013 Rural-Urban Continuum Codes. https://www.ers.usda.gov/data-products/rural-urban-continuum-codes. Accessed May 14, 2025.
Suggested Citation
Decker, SL. Use of Telehealth in Metropolitan and Nonmetropolitan Areas, United States 2021-2023. Statistical Brief #570. AHRQ Publication No. 26-0002. December 2025. Agency for Healthcare Research, Rockville, MD. https://meps.ahrq.gov/data_files/publications/st570/stat570.pdf.
AHRQ welcomes questions and comments from readers of this publication who are interested in obtaining more information about access, cost, use, financing, and quality of healthcare in the United States. We also invite you to tell us how you are using this Statistical Brief and other MEPS data and tools and to share suggestions on how MEPS products might be enhanced to further meet your needs. Please email us at MEPSProjectDirector@ahrq.hhs.govor send a letter to the address below:
Samuel H. Zuvekas, PhD, Acting Director
Center for Financing, Access and Cost Trends
Agency for Healthcare Research and Quality
5600 Fishers Lane, Mailstop 07W01C
Rockville, MD 20857
Figures
Figure 1. Percent of Medical Visits Via Telehealth, 2021-2023
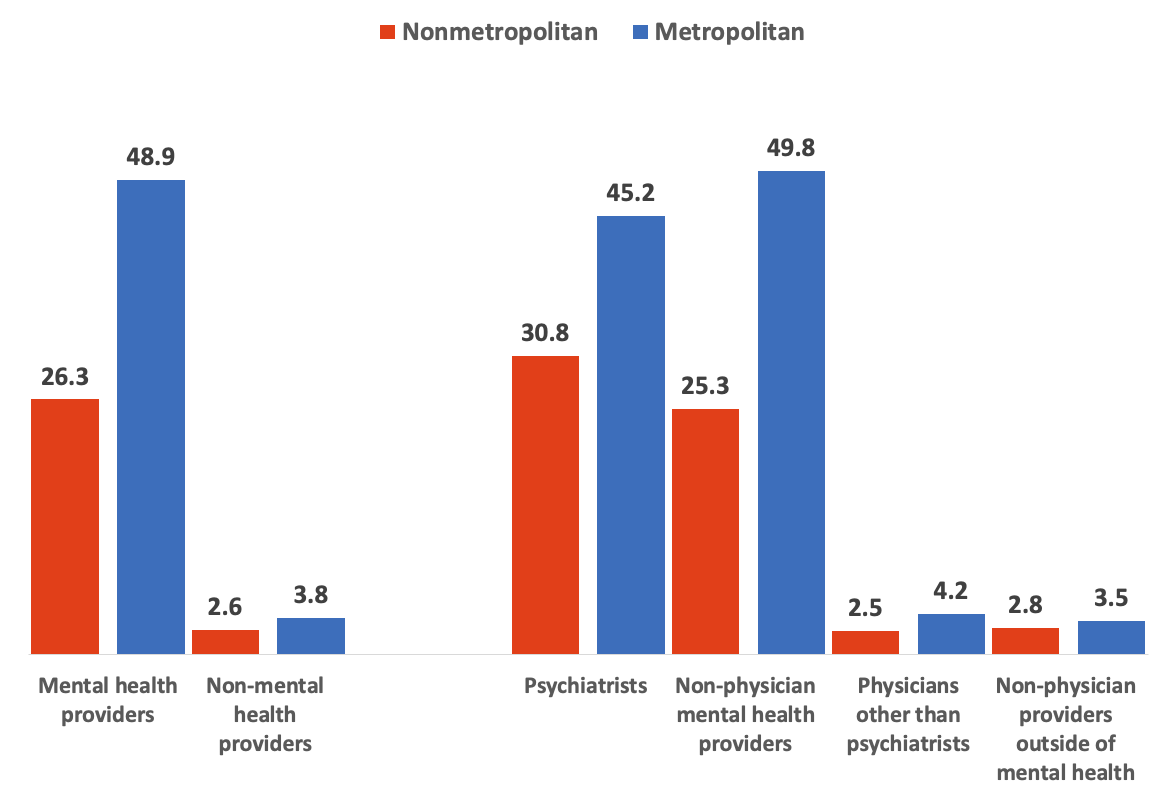
| Provider type | Nonmetropolitan (%) | Metropolitan (%) |
|---|---|---|
| Mental health providers | 26.3 | 48.9 |
| Non-mental health providers | 2.6 | 3.8 |
| Psychiatrists | 30.8 | 45.2 |
| Non-physician mental health providers | 25.3 | 49.8 |
| Physicians other than psychiatrists | 2.5 | 4.2 |
| Non-physician providers outside of mental health | 2.8 | 3.5 |
Source: Agency for Healthcare Research and Quality, Medical Expenditure Panel Survey-Household Component, 2021-2023.
Figure 2. Percent of Medical Visits Via Telehealth, 2021-2023
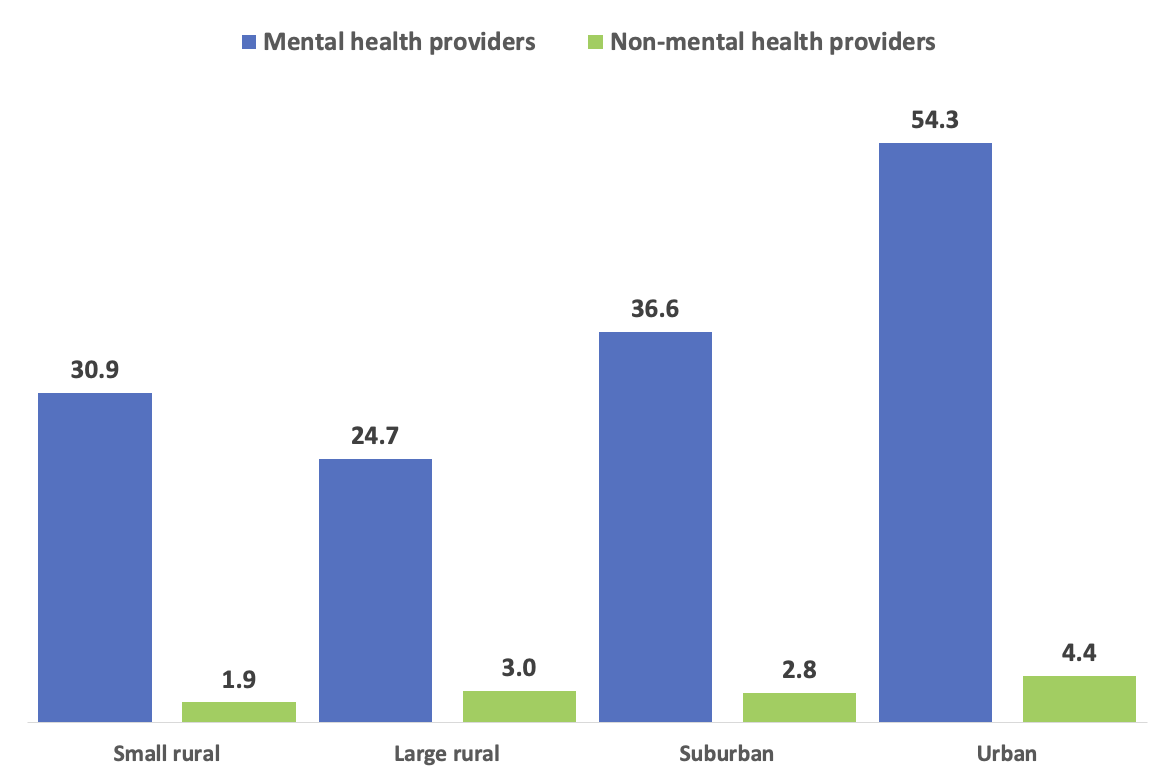
| Area type | Mental health providers (%) | Non-mental health providers (%) |
|---|---|---|
| Small rural | 30.9 | 1.9 |
| Large rural | 24.7 | 3.0 |
| Suburban | 36.6 | 2.8 |
| Urban | 54.3 | 4.4 |
Source: Agency for Healthcare Research and Quality, Medical Expenditure Panel Survey-Household Component, 2021-2023.
Figure 3. Percent of Visits to Mental Health Providers Taking Place Via Telehealth by Degree of Patient Psychological Distress, Ages 18+, 2021-2023
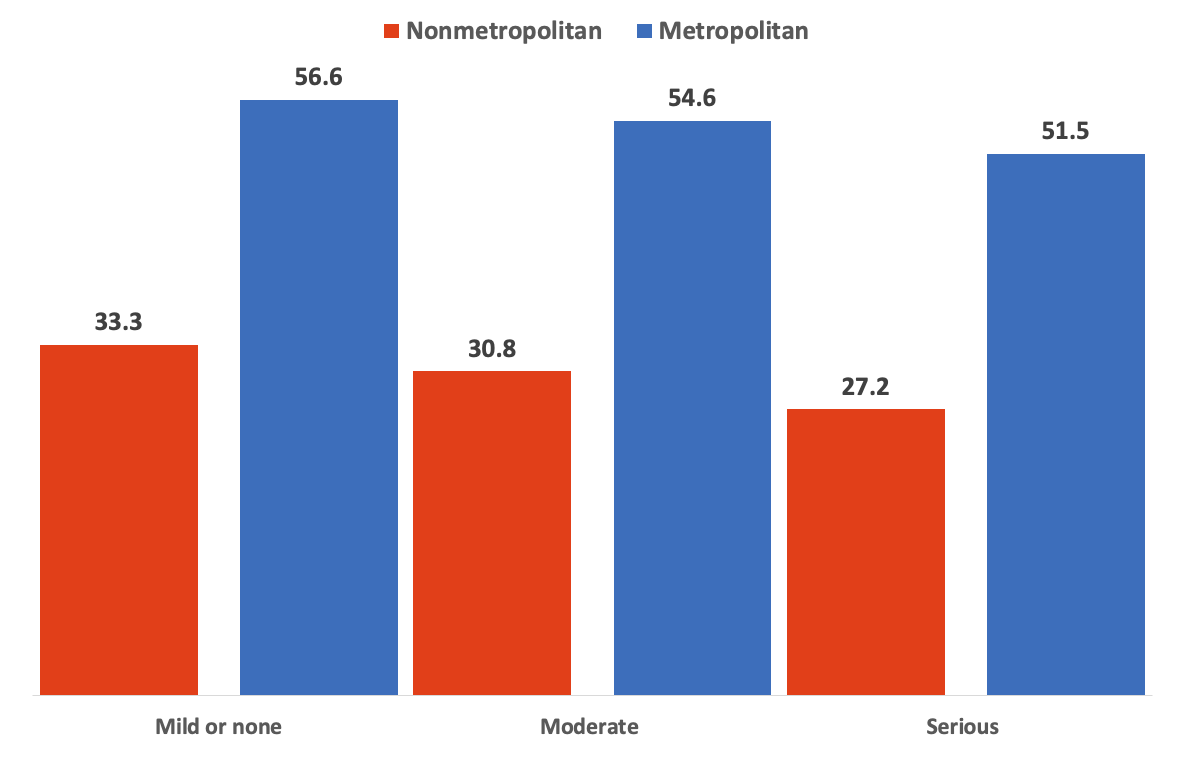
| Mental illness severity | Nonmetropolitan (%) | Metropolitan (%) |
|---|---|---|
| Mild or none | 33.3 | 56.6 |
| Moderate | 30.8 | 54.6 |
| Serious | 27.2 | 51.5 |
Source: Agency for Healthcare Research and Quality, Medical Expenditure Panel Survey-Household Component, 2021-2023.
Figure 4. Percent of Visits to Non-Mental Providers Taking Place via Via Telehealth by Provider Specialty Group, 2021-2023
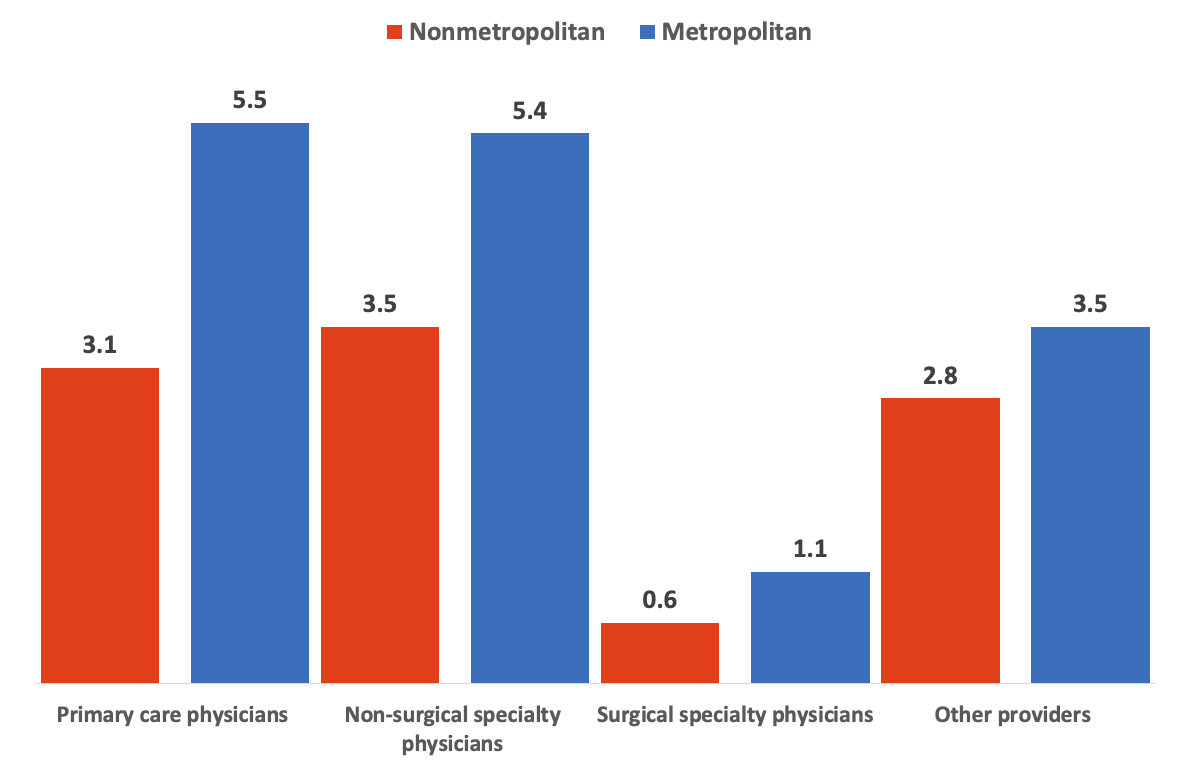
| Provider type | Nonmetropolitan (%) | Metropolitan (%) |
|---|---|---|
| Primary care physicians | 3.1 | 5.5 |
| Non-surgical specialty physicians | 3.5 | 5.4 |
| Surgical specialty physicians | 0.6 | 1.1 |
| Other providers | 2.8 | 3.5 |
Source: Agency for Healthcare Research and Quality, Medical Expenditure Panel Survey-Household Component, 2021-2023.
Figure 5. Percent of Visits to Mental Health Providers Taking Place Via Telehealth by Primary Source of Payment, 2021-2023
| Payment source | Nonmetropolitan (%) | Metropolitan (%) |
|---|---|---|
| Private insurance | 21.7 | 53.4 |
| Medicare | 46.7 | 49.1 |
| Medicaid | 14.8 | 32.7 |
| Self pay / no pay | 40.5 | 54.8 |
Source: Agency for Healthcare Research and Quality, Medical Expenditure Panel Survey-Household Component, 2021-2023.
Figure 6. Percent of Visits to Non-Mental Health Providers Taking Place Via Telehealth by Primary Source of Payment, 2021-2023
| Payment source | Nonmetropolitan (%) | Metropolitan (%) |
|---|---|---|
| Private insurance | 2.5 | 3.7 |
| Medicare | 2.5 | 3.2 |
| Medicaid | 3.4 | 6.0 |
| Self pay / no pay | 2.6 | 3.6 |
Source: Agency for Healthcare Research and Quality, Medical Expenditure Panel Survey-Household Component, 2021-2023.
AHRQ Pub. No. 26-0002
December 2025