
|
|
Font Size:
|
||||
|
|
|
|
||||
STATISTICAL BRIEF #6:
The Uninsured in America--1996-2001: Estimates for the Civilian Noninstitutionalized Population Under Age 65
Briefly Stated
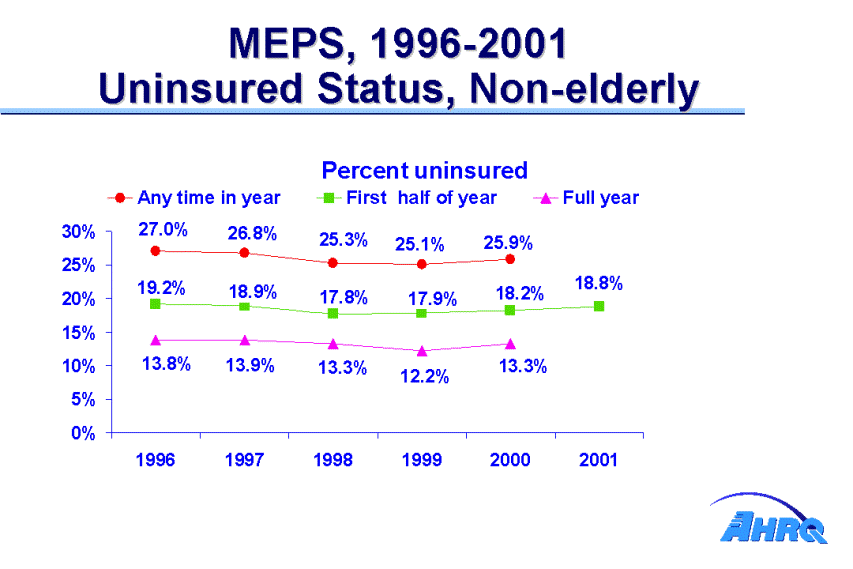
- The number of uninsured Americans under age 65 varied depending on the definition of time period for being uninsured. In 2000, 25.9% of the population was uninsured at some point during the year, 18.2% were uninsured throughout the first half of the year, and 13.3% were uninsured the entire year.
- Overall, there was a decline in the percent and number of non-elderly individuals uninsured from 1996 to 1999. In 2000, this decline was no longer occurring.
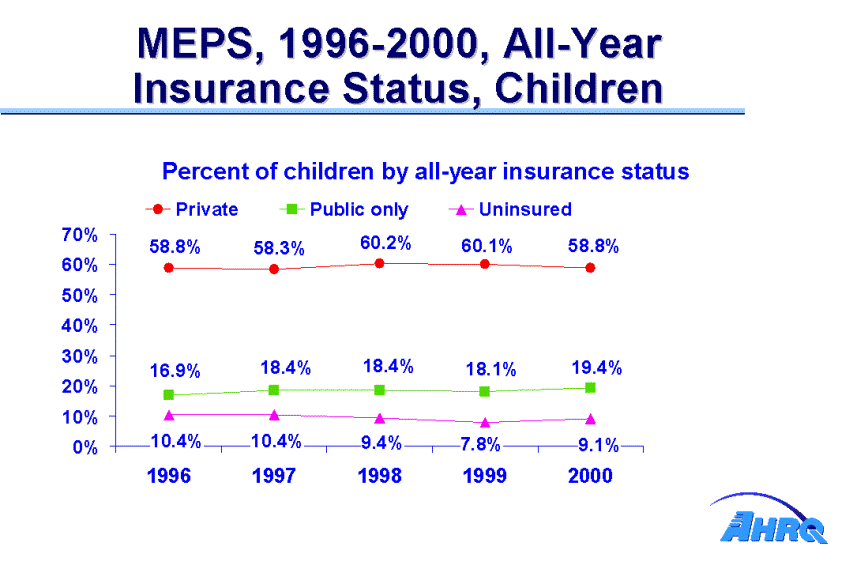
- From 1996 to 1999, the percent of children uninsured all year declined from 10.4% to 7.8%. By 2000, 9.1% of children were uninsured all year.
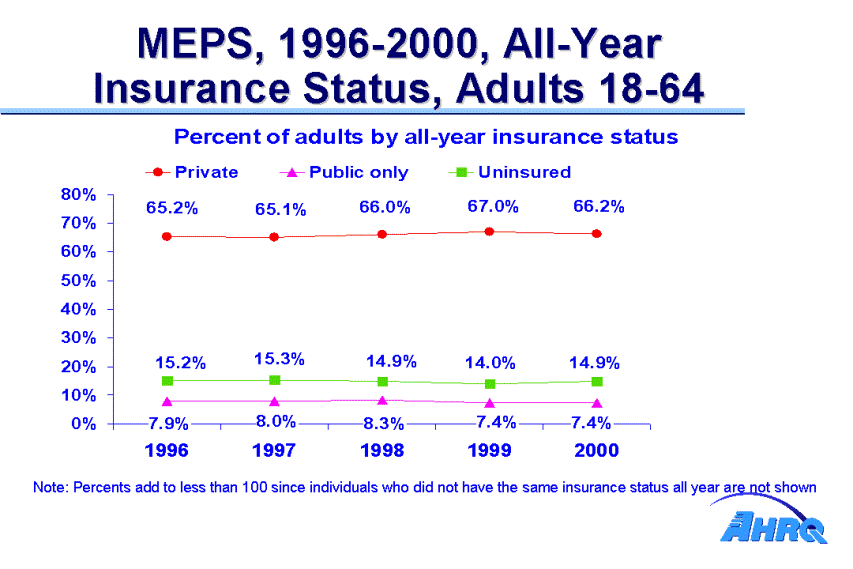
- In 1997, 15.3% of adults were uninsured all year compared to 14.0% in 1999. In 2000, the percentage of adults uninsured the entire year was 14.9%.
- Throughout 1996 to 2000, adults were more likely to be uninsured the entire year (15% of adults compared to a range of 7.8% to 10.4% for children). In each year children relied more heavily on public insurance as compared to adults, while adults relied more heavily on private insurance.
Introduction
Estimates of the health insurance status of the U.S. civilian noninstitutionalized (community) population are critical to policymakers and others concerned with access to medical care and the cost and quality of that care. Health insurance helps people get timely access to medical care and protects them against the risk of expensive and unanticipated medical events. Compared to people with health care coverage, uninsured people are less likely to visit a doctor, have a usual source of medical care, receive preventive services, or have a recommended test or prescription filled (Taylor, Cohen, and Machlin, 2001; Weinick, Zuvekas, and Drilea, 1997).
Timely and reliable estimates of the population's health insurance status are essential to evaluate the costs and expected impact of public policy interventions in this area, such as efforts to expand coverage or to alter the way in which private and public insurance is financed.
The Medical Expenditure Panel Survey (MEPS), a household survey sponsored by Agency for Healthcare Research and Quality that is conducted annually, provides critical data for evaluating trends in the health insurance status of the population. This Statistical Brief presents data from calendar years 1996 through 2000, as well as the first half of 2001. Unless otherwise noted, only differences that are statistically significant at the 0.05 level are discussed in the text.
Definition of Terms
Uninsured
People classified as uninsured throughout the first half of the year did not have coverage during the period from January of the survey year through the time of their first interview in that year. These interviews were typically conducted from March to July. People uninsured for the entire year did not have insurance coverage at any time during the survey year. People classified as uninsured at some point during the survey year lacked coverage for at least one month during the year. People covered only by noncomprehensive State-specific programs (e.g., Maryland Kidney Disease Program) or private single-service plans (e.g., coverage for dental or vision care only, coverage for accidents or specific diseases) were not considered to be insured.
Public Coverage
People were considered to have public coverage if they were covered by Medicare, Medicaid, TRICARE, or other public hospital and physician coverage.
Private Coverage
Private health insurance was defined as non-public insurance that provides coverage for hospital and physician care (including Medigap coverage).
Findings
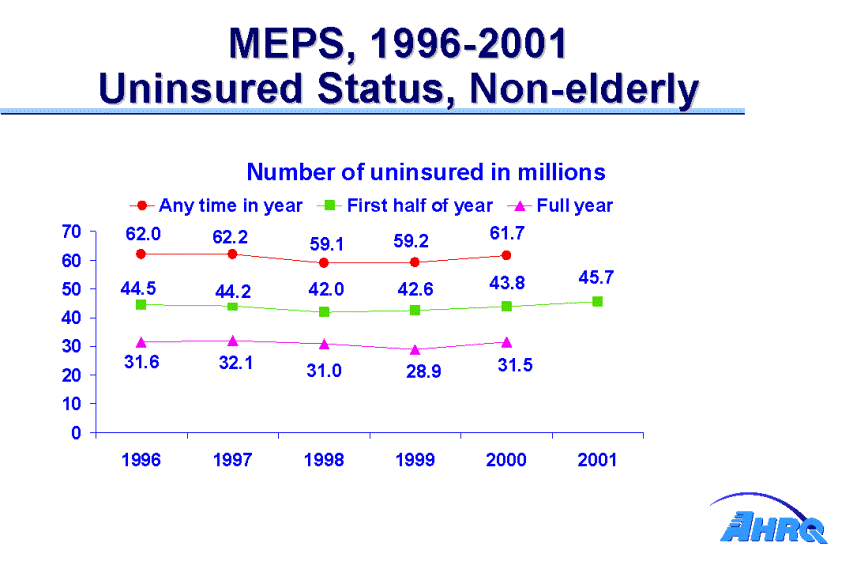
MEPS produces estimates of the uninsured for different periods within a year: at any time during the year, throughout the first half of the year, or the entire year. In 2000, the latest year for which all three measures are available, 25.9% of the population under age 65 was uninsured at some point during the year, 18.2% were uninsured throughout the first half of the year, and 13.3% were uninsured the entire year (Figure 1). Reflecting these differences, the number of people uninsured varied up to twofold depending on the time period of being uninsured. In 2000, 61.7 million were uninsured at some point during the year, 43.8 million were uninsured throughout the first half of the year, and 31.5 million people were uninsured all year (Figure 2).
From 1996 to 1999, the percent of the population uninsured at some point during the year declined from 27.0% to 25.1%, and the percent uninsured all year declined from 13.8% to 12.2%. The percent of the population uninsured throughout the first half of the year declined from 19.2% in 1996 to 17.8% in 1998 year (Figure 1) (Rhoades, Vistnes, and Cohen, 2002). These figures point to a decline in the percent and number of non-elderly individuals uninsured from 1996 to 1999. By 2000, this decline was no longer occurring.
For the first half of 2001, the most recent MEPS estimates available, 18.8% of the non-elderly population, 45.7 million individuals were uninsured year (Figure 1 and Figure 2).
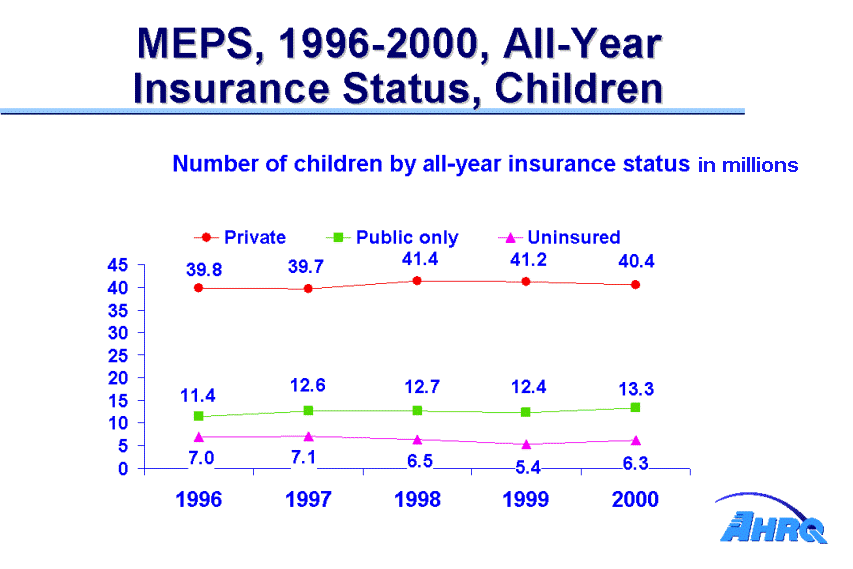
For children similar trends are observed. From 1996 to 1999, the percent of children under age 18 who were uninsured the entire year declined by 2.6 percentage points--from 10.4% to 7.8% year (Figure 3). Increases in public and private coverage contributed 1.3 percentage points each to this decline. Over this same time period the number of children uninsured the entire year declined by 1.6 million, from 7.0 million to 5.4 million year (Figure 4) (Rhoades, Vistnes, and Cohen, 2002). In 2000, the percentage and number of children who were uninsured for the entire year were 9.1% and 6.3 million, respectively year (Figure 3 and Figure 4).
While the estimates of the uninsured for the overall non-elderly population and for children declined between 1996 and 1999, the pattern for adults (age 18 to 64) was slightly different, with the decline occurring between 1997 and 1999. In 1997, 15.3% of adults were uninsured all year compared to 14.0% in 1999 (Rhoades, Vistnes, and Cohen, 2002). In 2000, the percentage of adults uninsured the entire year was 14.9% year (Figure 5).
Throughout 1996 to 2000, adults were more likely to be uninsured the entire year than children (roughly 15% of adults compared to a range of 7.8% to 10.4% for children). In each year children relied more heavily on public insurance as compared to adults, while adults relied more heavily on private insurance. For example, in 2000, 7.4% and 66.2% of adults had public insurance only or private insurance respectively, compared to 19.4% and 58.8% of children year (Figure 3 and Figure 5).
Source of data
The estimates presented in this Statistical Brief come from the Medical Expenditure Panel Survey (MEPS) Household Component. MEPS is cosponsored by the Agency for Healthcare Research and Quality (AHRQ) and the National Center for Health Statistics (NCHS). It is a nationally representative survey of the U.S. civilian noninstitutionalized population that collects data on medical expenses for both individuals and households. MEPS collects detailed data on demographic characteristics, health conditions, health status, use of medical care services, charges and payments, access to care, satisfaction with care, health insurance coverage, income, and employment. Other MEPS components collect data on the use, charges, and payments reported by medical care providers; data on residents of licensed or certified nursing homes; and data on the supply side of the health insurance market. For a detailed description of the MEPS survey design see J. Cohen (1997) and S. Cohen (1997).
MEPS data are released to the public in a number of formats, including public use data files and the printed MEPS Research Findings and MEPS Highlights series. The numbers shown in this Statistical Brief are drawn from analyses conducted by the MEPS staff from the following public use files: 1996-99 Full Year Consolidated Data Files, HC-012, HC-020, HC-028, and HC-038 and 2000 Full Year Population Characteristics Data File HC-039. Point in Time estimates were derived from Data Files HC-001, HC-005, HC-009, HC-013, HC-022, and HC-034.
 |
||||||||||||||||||||||||||||
Note: The estimates of the uninsured are highest for people uninsured at any time in the year.
| ||||||||||||||||||||||||||||
|
|
||||||||||||||||||||||||||||
 |
||||||||||||||||||||||||||||
Note: The number of people uninsured varied up to twofold, depending on the time period used to define being uninsured.
| ||||||||||||||||||||||||||||
|
|
||||||||||||||||||||||||||||
 |
||||||||||||||||||||||||||||
Note: The percent of children uninsured all year declined from 10.4% in 1996 to 7.8% in 1999.
| ||||||||||||||||||||||||||||
|
|
||||||||||||||||||||||||||||
 |
||||||||||||||||||||||||||||
Note: The number of uninsured children declined from 7.0 million in 1996 to 5.4 million in 1999.
| ||||||||||||||||||||||||||||
|
|
||||||||||||||||||||||||||||
 |
||||||||||||||||||||||||||||
Note: Percents add to less than 100 since individuals who did not have the same insurance status all year are not shown.
| ||||||||||||||||||||||||||||
|
|
||||||||||||||||||||||||||||
 |
||||||||||||||||||||||||||||
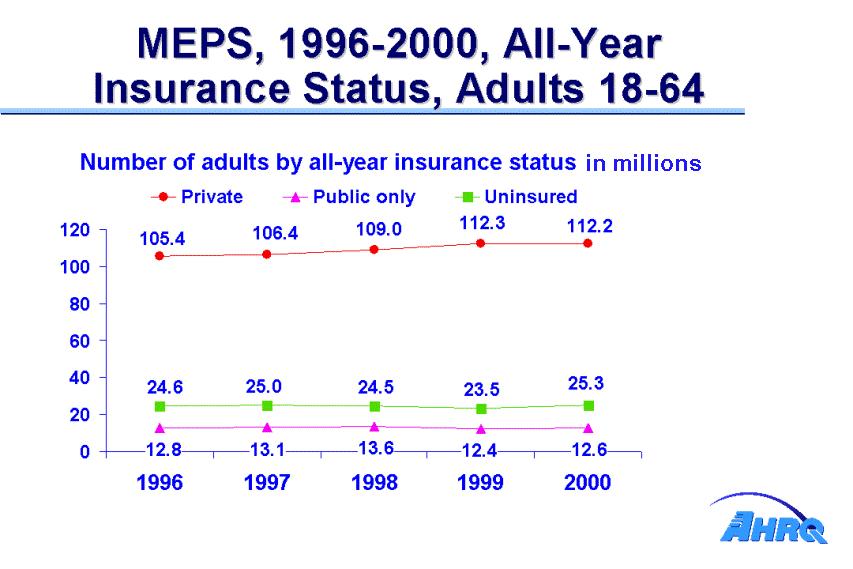
Note: In 2000, 25.3 million adults were uninsured all year.
| ||||||||||||||||||||||||||||
The Uninsured in America--1996-2001For more information about MEPS, call the MEPS information coordinator at AHRQ (301-594-1406) or visit the MEPS Web site at: http://www.meps.ahrq.gov/ |
||||||||||||||||||||||||||||
ReferencesCohen J. Design and methods of the Medical Expenditure Panel Survey Household Component. Rockville (MD): Agency for Health Care Policy and Research; 1997. MEPS Methodology Report No. 1. AHCPR Pub. No. 97-0026. Cohen S. Sample design of the 1996 Medical Expenditure Panel Survey Household Component. Rockville (MD): Agency for Health Care Policy and Research; 1997. MEPS Methodology Report No. 2 AHCPR Pub. No. 97-0027. Rhoades J, Vistnes P, and Cohen J. The Uninsured in America: 1996-2000. Rockville (MD): Agency for Healthcare Research and Quality; 2002. MEPS Chartbook No. 9 AHRQ Pub. No. 02-0027. Taylor A, Cohen J, Machlin S. Being uninsured in 1996 compared to 1987: how has the experience of the uninsured changed over time? Health Serv Res 2001; 36:16-31. Weinick R, Zuvekas S, Drilea S. Access to health care - sources and barriers, 1996. Rockville (MD): Agency for Health Care Policy and Research; 1997. MEPS Research Findings No. 3: AHCPR publication No. 98-0001. |
||||||||||||||||||||||||||||
|
|


