
|
|
Font Size:
|
||||
|
|
|
|
||||
STATISTICAL BRIEF #68:
Overweight and Obese Elderly and Near Elderly in the United States, 2002: Estimates for the Noninstitutionalized Population Age 55 and Older
Highlights
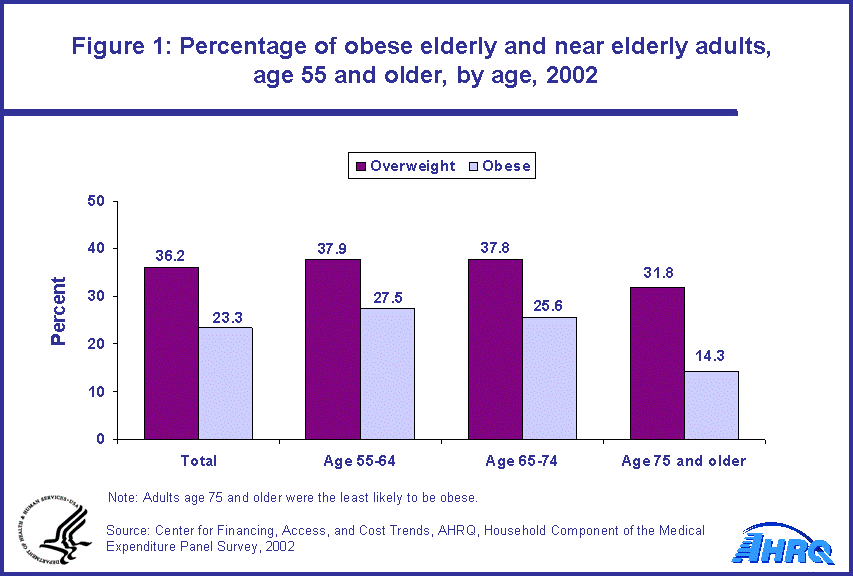
- Individuals age 75 and older were the least likely to be obese in 2002: 14.3 percent of those age 75 and older were obese as compared with 27.5 percent of those age 55 to 64 and 25.6 percent of those age 65 to 74.
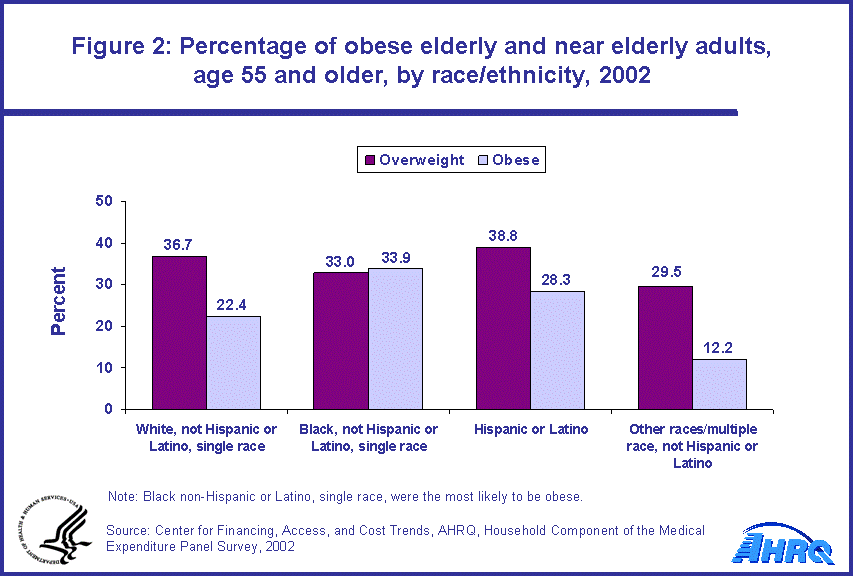
- Black not Hispanic or Latino, single race, were the most likely to be obese (33.9 percent) in 2002. Other races/multiple race, not Hispanic or Latino were the least likely to be obese (12.2 percent).
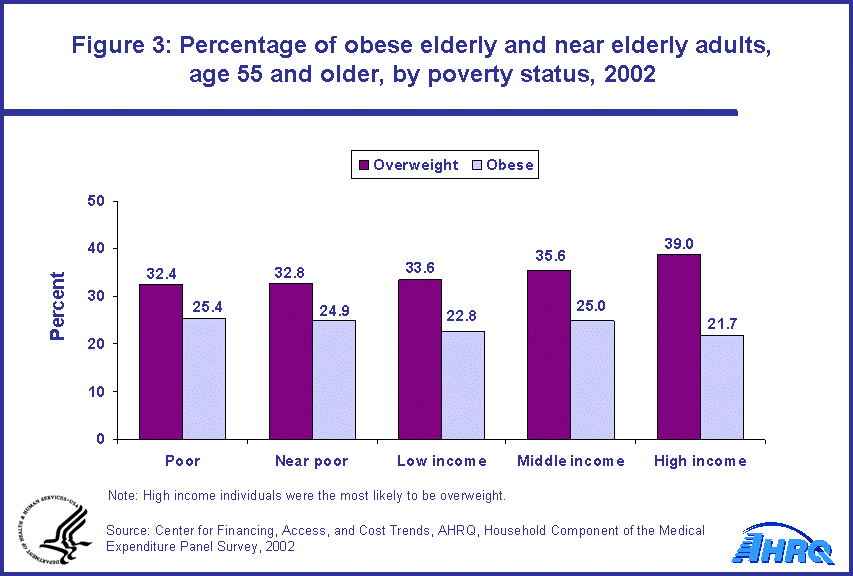
- Adults (age 55 and older) with high incomes (400 percent or more of the poverty level) were the most likely to be overweight (39.0 percent) in 2002.
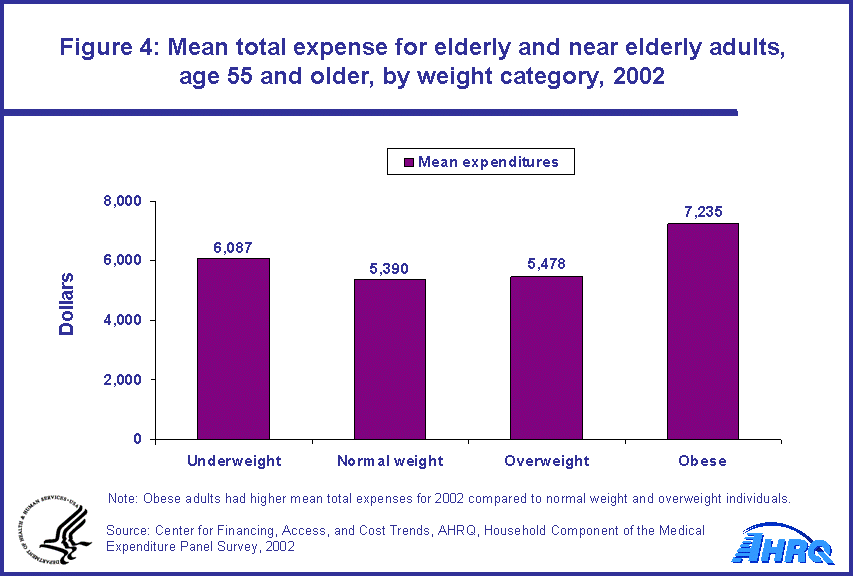
- Among the elderly and near elderly population (age 55 and older) with an expense, obese individuals had higher total mean expenses ($7,235) for medical care in 2002 as compared with persons who were either normal weight ($5,390) or overweight ($5,478).
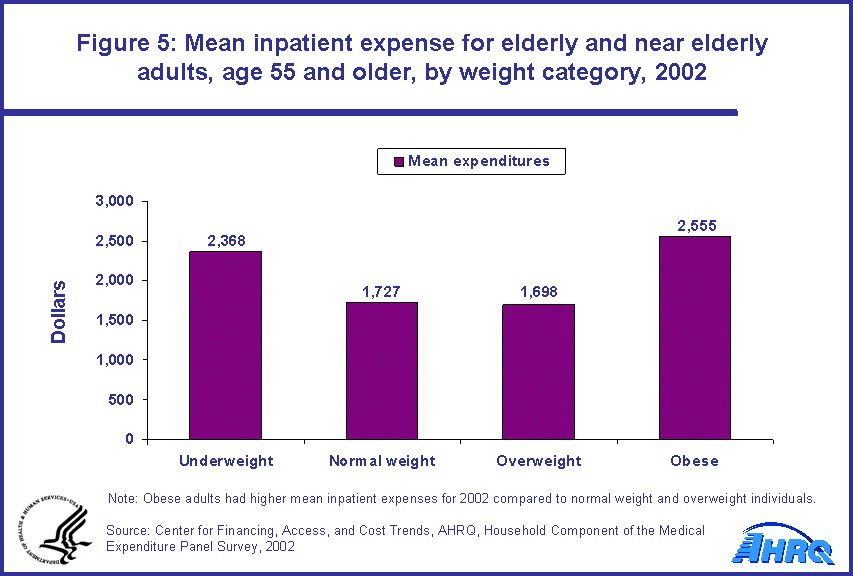
- Persons age 55 and older who were obese had higher inpatient mean expenses ($2,555) for 2002 when compared with normal weight ($1,727) and overweight ($1,698) individuals.
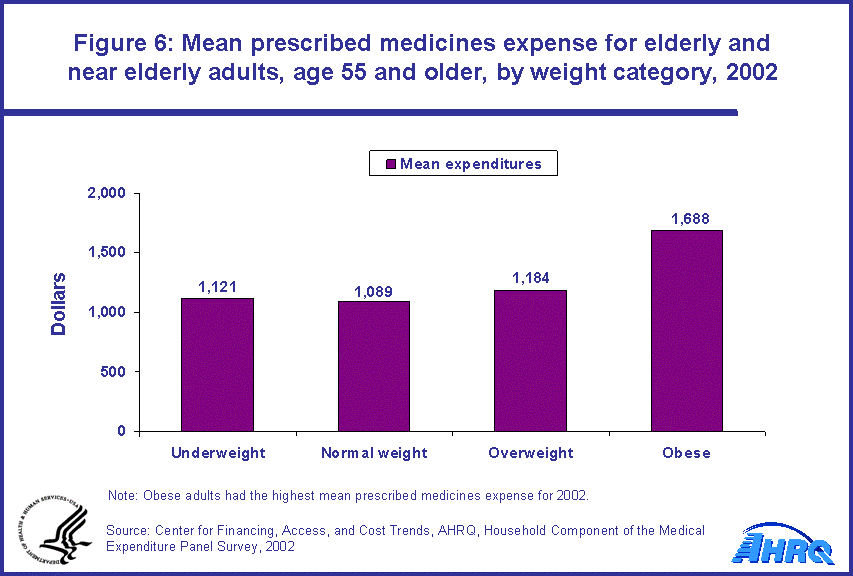
- Obese individuals age 55 and older had the highest mean expense ($1,688) for prescribed medicines in 2002 compared with normal weight ($1,089) and overweight ($1,184) individuals.
Introduction
This Statistical Brief presents data from the Household Component of the Medical Expenditure Panel Survey (MEPS-HC) concerning the prevalence of overweight and obesity among the elderly and near elderly (age 55 and older) noninstitutionalized (community) population. Estimates are for calendar year 2002. Emphasis is placed on the relationships between body mass index (BMI) and demographic characteristics of the population, total health care expenditures, and inpatient and prescribed medicines expenditures (two areas of concentrated health care expenditures). The demographic variables of interest are age, race/ethnicity, and income. Only differences that are statistically significant at the 0.05 level are discussed in the text.
Findings
Age
Individuals age 75 and older were the least likely to be overweight or obese in 2002 as compared with other age groups. For the age group 75 and older, 14.3 percent were obese. This compares with 27.5 percent of those age 55 to 64 and 25.6 percent of those age 65 to 74. With respect to being overweight, 31.8 percent of the individuals 75 and older were such, while 37.9 percent of 55 to 64 year olds and 37.8 percent of individuals age 65 to 74 were overweight (figure 1).
Race/ethnicity
Black not Hispanic or Latino, single race, were the most likely to be obese in 2002 as compared with all other racial/ethnic groups. Of those individuals age 55 and older identified as black not Hispanic or Latino, single race, 33.9 percent were obese. This compares with 22.4 percent of white not Hispanic or Latino, single race, 28.3 percent of Hispanic or Latino and 12.2 percent of other races/multiple race, not Hispanic or Latino. Other races/multiple race, not Hispanic or Latino were the least likely to be obese (12.2 percent) in 2002 (figure 2).
Poverty status
Individuals age 55 and older with the highest income (400 percent or more of the poverty level) were the most likely to be overweight in 2002 when compared with all other income levels. Of those individuals with high incomes, 39.0 percent were overweight (figure 3).
Total expenditures
Obese individuals age 55 and older had higher total mean expenses for medical care in 2002 as compared with persons who were either normal weight or overweight. The mean total expense for obese individuals was $7,235; this compares with $5,390 and $5,478 for normal weight and overweight individuals, respectively (figure 4).
Inpatient expenditures
With respect to inpatient care, persons 55 and older who were obese had higher mean expenses for 2002 when compared with normal weight and overweight individuals. The mean inpatient expense in 2002 for obese individuals was $2,555 while the mean expense for normal weight and overweight individuals was $1,727 and $1,698, respectively (figure 5).
Prescribed medicines expenditures
For prescribed medicines, obese individuals age 55 and older had the highest mean expense for 2002 at $1,688. For normal weight persons, the mean expense for prescribed medicines was $1,089; for those who were overweight, the mean expense was $1,184; and for underweight individuals, the mean expense was $1,121 (figure 6).
Data Source
The estimates shown in this Statistical Brief are drawn from analyses conducted by MEPS staff from the 2002 Full-Year Consolidated Data File, HC-070, which is available on the MEPS Web site, http://www.meps.ahrq.gov/.
Definitions/Methodology
Underweight, normal weight, overweight, and obesity
- Underweight: BMI less than 18.5
- Normal weight: BMI of 18.5 or greater and less than 25
- Overweight: BMI equal to or greater than 25 and less than 30
- Obesity: BMI equal to or greater than 30
Age
The respondent was asked to report the age of each family member as of the date of each interview. In this report, age was usually based on the sample person's age at the end of the reference year. If data were not collected at the end of the year because the sample person was out of scope (e.g., deceased or institutionalized), then age at the time of the previous interview(s) was used.
Race/ethnicity
Classification by race and ethnicity was based on information reported for each family member. Respondents were asked if each family member's race was best described as American Indian, Alaska Native, Asian or Pacific Islander, black, white, or other. They also were asked if each family member's main national origin or ancestry was Puerto Rican; Cuban; Mexican, Mexicano, Mexican American, or Chicano; other Latin American; or other Spanish. All persons whose main national origin or ancestry was reported in one of these Hispanic groups, regardless of racial background, were classified as Hispanic or Latino. Since the Hispanic or Latino grouping can include black Hispanic or Latino, white Hispanic or Latino, and other Hispanic or Latino, the race categories of black, white, and other do not include Hispanic or Latino. Other not Hispanic or Latino included American Indian/Alaskan Native not Hispanic or Latino, Asian or Pacific Islander not Hispanic or Latino, and multiple races not Hispanic or Latino.
Poverty status
Each sample person was classified according to the total yearly income of his or her family. Within a household, all individuals related by blood, marriage, or adoption were considered to be a family. Personal income from all family members was summed to create family income.
Poverty status is the ratio of family income to the Federal poverty thresholds, which control for family size and age of the head of family. Categories are defined as follows:
- Poor: Persons in families with income less than or equal to the poverty line, including those who reported negative income
- Near poor: Persons in families with income over the poverty line through 125 percent of the poverty line
- Low income: Persons in families with income over 125 percent through 200 percent of the poverty line
- Middle income: Persons in families with income over 200 percent through 400 percent of the poverty line
- High income: Persons in families with income over 400 percent of the poverty line
About MEPS-HC
MEPS-HC is a nationally representative longitudinal survey that collects detailed information on health care utilization and expenditures, health insurance, and health status, as well as a wide variety of social, demographic, and economic characteristics for the civilian noninstitutionalized population. It is cosponsored by the Agency for Healthcare Research and Quality and the National Center for Health Statistics.
For more information about MEPS, call the MEPS information coordinator at AHRQ (301-427-1406) or visit the MEPS Web site at http://www.meps.ahrq.gov/.
References
Cohen, J. Design and Methods of the Medical Expenditure Panel Survey Household Component. MEPS Methodology Report No. 1. AHCPR Pub. No. 97-0026. Rockville, Md.: Agency for Healthcare Policy and Research, 1997.
Cohen, S. Sample Design of the 1996 Medical Expenditure Panel Survey Household Component. MEPS Methodology Report No. 2. AHCPR Pub. No. 97-0027. Rockville, Md.: Agency for Health Care Policy and Research, 1997.
Suggested Citation
Rhoades, J. A. Overweight and Obese Elderly and Near Elderly in the United States, 2002: Estimates for the Noninstitutionalized Population Age 55 and Older. Statistical Brief #68. February 2005. Agency for Healthcare Research and Quality, Rockville, MD. http://meps.ahrq.gov/mepsweb/data_files/publications/st68/stat68.shtml
 |
||||||||||||||||||||||||||||||
|
||||||||||||||||||||||||||||||
|
|
||||||||||||||||||||||||||||||
 |
||||||||||||||||||||||||||||||
|
||||||||||||||||||||||||||||||
|
|
||||||||||||||||||||||||||||||
 |
||||||||||||||||||||||||||||||
|
||||||||||||||||||||||||||||||
|
|
||||||||||||||||||||||||||||||
 |
||||||||||||||||||||||||||||||
|
||||||||||||||||||||||||||||||
|
|
||||||||||||||||||||||||||||||
 |
||||||||||||||||||||||||||||||
|
||||||||||||||||||||||||||||||
|
|
||||||||||||||||||||||||||||||
 |
||||||||||||||||||||||||||||||
|
||||||||||||||||||||||||||||||
|
|
||||||||||||||||||||||||||||||


