
|
|
Font Size:
|
||||
|
|
|
|
||||
STATISTICAL BRIEF #73:
Characteristics of Persons with High
Medical Expenditures in the U.S.
Civilian Noninstitutionalized Population,
2002
Highlights
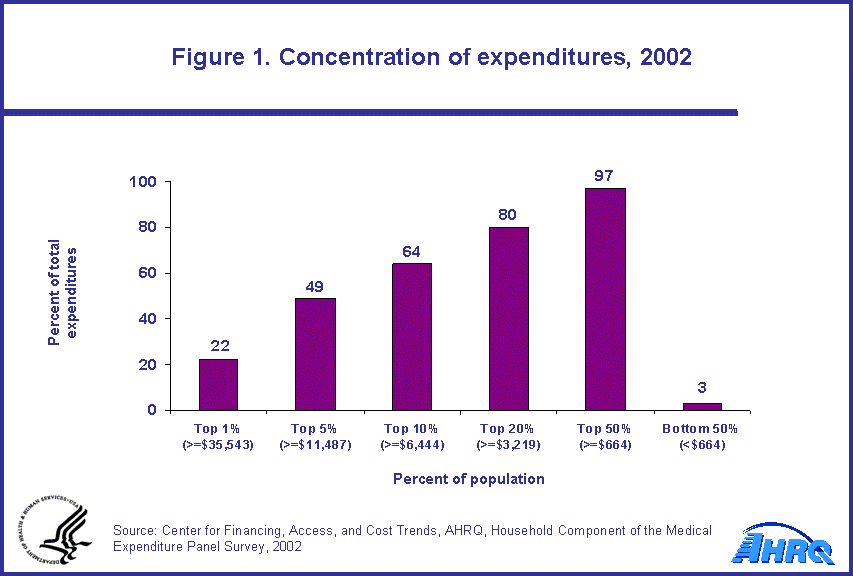
- In 2002, 5 percent of the population accounted for 49 percent of total medical expenditures, and half the population accounted for only 3 percent of the total.
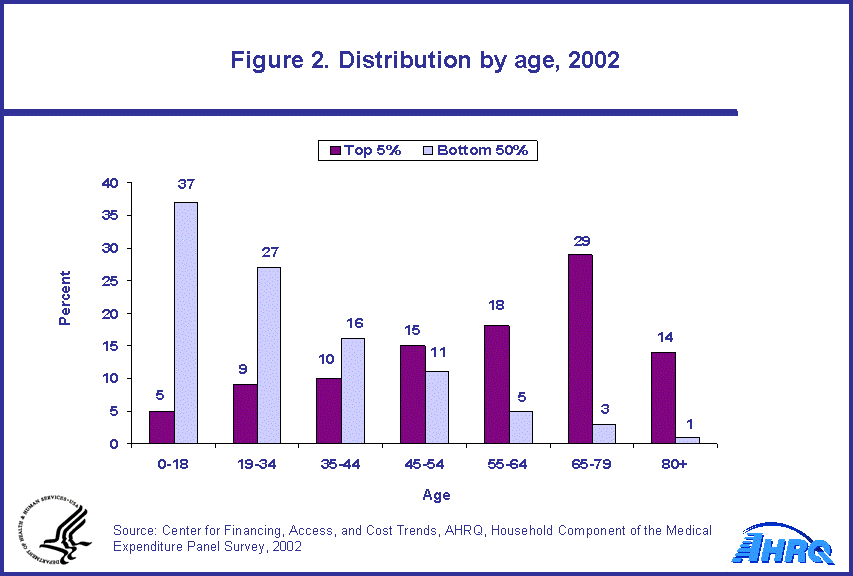
- More than one-quarter of individuals in the top 5 percent of the expenditure distribution were between the ages of 65 and 79, and another 14 percent were age 80 and above.
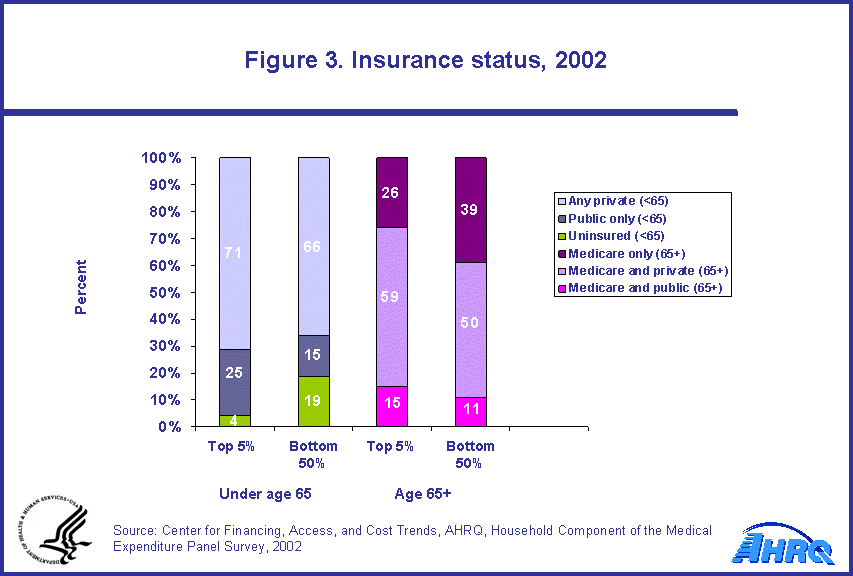
- Among persons under the age of 65 in the top 5 percent of the expenditure distribution, more than 70 percent had private insurance during the year, and only 4 percent were uninsured.
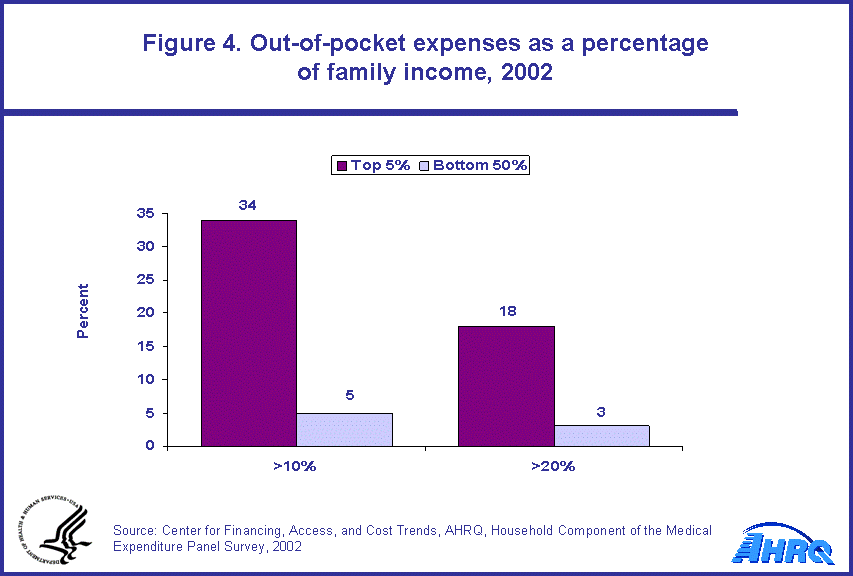
- About one-third of persons in the top 5 percent of the medical expenditure distribution had out-of-pocket expenses that exceeded 10 percent of family income.
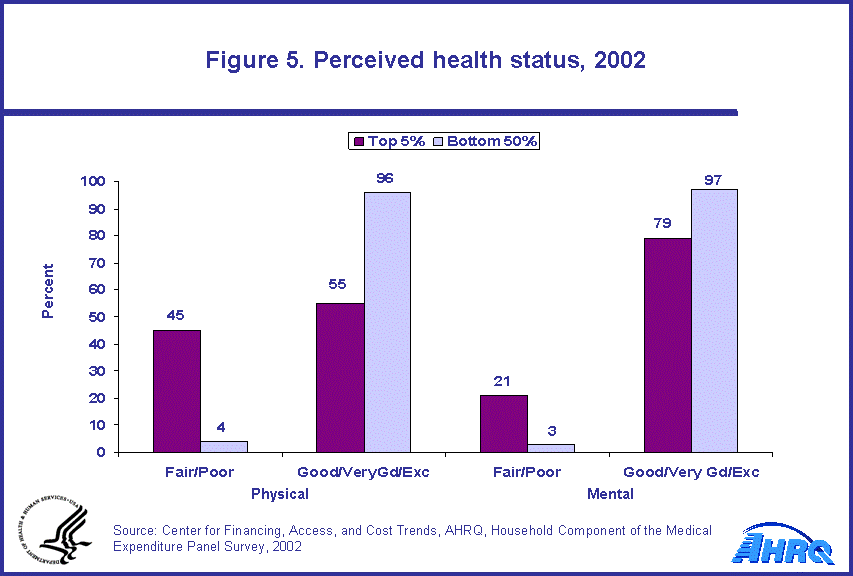
- Persons in the top 5 percent of the medical expenditure distribution were much more likely than those in the bottom half of the distribution to report their physical or mental health as being only fair or poor.
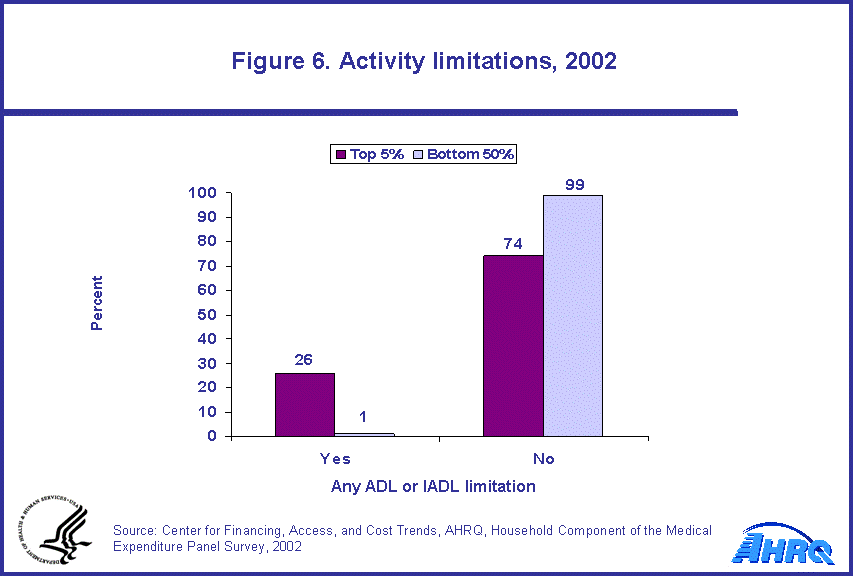
- More than one-quarter of persons in the top 5 percent of the medical expenditure distribution had one or more activity limitations compared with 1 percent of persons in the bottom half of that distribution.
Introduction
This Statistical Brief presents characteristics of persons in the U.S. civilian noninstitutionalized (community) population in calendar year 2002 who were in the top 5 percent of the medical expenditure distribution compared with persons in the bottom 50 percent of that distribution. The distribution of medical expenditures is determined by ranking individuals in descending order according to their total medical expenses and determining aggregate spending at specific percentiles of the population. Total expenditures include expenditures for services provided by hospitals, physicians, and other health care providers, as well as expenditures for prescribed medicines and medical equipment. Expenses are defined as direct payments to providers by individuals, private insurance, Medicare, Medicaid, and other payment sources.
The estimates provided in this brief are derived from the Household Component of the 2002 Medical Expenditure Panel Survey (MEPSHC). All differences between estimates discussed in the text are statistically significant at the 0.05 level.
Findings
In 2002, the top 5 percent of the U.S. community population, ranked according to their level of expenditures, accounted for 49 percent of overall U.S. medical spending. Medical expenses for these people equaled or exceeded $11,487 during the year. In contrast, the bottom 50 percent of the expenditure distribution (that is, the half of the population with the lowest expenditures, those with annual medical spending below $664) represented only 3 percent of total national medical expenditures (figure 1).
Levels of expenditures are generally inversely related to age (figure 2). The youngest age group, those less than 19, accounted for 37 percent of the bottom 50 percent of the expenditure distribution, but only 5 percent of the top 5 percent, while those age 65 and over accounted for just under half (43 percent) of the top 5 percent of the distribution, but only 4 percent of the bottom 50 percent.
Within the population under age 65, most of the individuals in both the top 5 percent and bottom 50 percent of the expenditure distribution had private health insurance at some time during the year (figure 3, left side). Those with private insurance did make up a slightly higher proportion of the top 5 percent of the distribution than the bottom 50 percent (71 versus 66 percent). In contrast, the uninsured accounted for almost one-fifth of the bottom 50 percent of the expenditure distribution, but less than one-twentieth of the top 5 percent.
Within the population age 65 and older (figure 3, right side), the overwhelming majority of individuals in the top 5 percent of the expenditure distribution had Medicare plus private insurance (59 percent). Those 65 and older in the bottom 50 percent of that distribution were more likely than those in the top 5 percent to have Medicare only (39 percent versus 26 percent).
Among persons in the top 5 percent of the expenditure distribution, more than one-third had out-of-pocket medical expenses that exceeded 10 percent of family income and almost one-fifth had out-of-pocket expenses that exceeded 20 percent of family income (figure 4). Persons in the bottom 50 percent of the distribution were much less likely than those in the top 5 percent to have out-of-pocket expenses for medical care that exceeded 10 or 20 percent of family income. Only 5 percent of persons in the bottom 50 percent had expenses that exceeded 10 percent of family income and only 3 percent had out-of-pocket expenses in excess of 20 percent.
Persons in the highest 5 percent of the distribution of medical expenditures were much more likely to be in fair or poor health than persons in the bottom half of that distribution, 45 percent versus 4 percent. Similarly, 21 percent of persons in the top 5 percent of the expenditure distribution were in fair or poor mental health compared with 3 percent of persons in the bottom 50 percent (figure 5).
Of those in the top 5 percent of the expenditure distribution, 26 percent needed help with at least one activity of daily living (ADL), such as bathing and dressing, or instrumental activity of daily living (IADL), such as doing housework and paying bills, compared with only 1 percent of those in the bottom half of the distribution (figure 6). Conversely, almost no one in the bottom 50 percent of the medical expenditure distribution (99 percent) had an IADL or ADL limitation.
Data Source
The estimates in this Statistical Brief are derived from the MEPS 2002 Full Year Consolidated Data File: HC-070.
Definitions
Expenditures
Expenditures include the total payments from all sources to hospitals, physicians, other health care providers (including dental care), and pharmacies for services reported by respondents in the MEPS-HC. Sources include direct payments from individuals and families, private insurance, Medicare, Medicaid, and miscellaneous other sources.
Health insurance status
Health insurance was defined as follows for individuals under age 65:
- Any private health insurance: Having insurance at any time during the year that provided coverage for hospital and physician care from a nonpublic source. Coverage only by private single-service plans (e.g., coverage for dental or vision care only or coverage for accidents or specific diseases) was not defined as private health insurance.
- Public coverage only: Having Insurance at any time during the year that provided coverage for hospital and physician care through Medicare, Medicaid, or some other public program, combined with no coverage for hospital and physician care through a private source. Coverage only through noncomprehensive State-specific programs (e.g., the Maryland Kidney Disease Program, the Colorado Child Health Plan) was not defined as public coverage.
- Uninsured: Having no private or public coverage of hospital and physician care at any time during the year.
- Medicare only: Having coverage only through the Medicare program.
- Medicare and private: Having coverage through Medicare and a private source.
- Medicare and public: Having coverage through Medicare and some other public source.
This category includes only payments to providers by users and their families. Insurance premiums are not included.
Perceived health status
The MEPS respondent was asked to rate the health of each person in the family according to the following categories: excellent, very good, good, fair, and poor.
Limitations
ADLs are activities of daily living, including personal care activities such as bathing, dressing, and eating. IADLs are instrumental activities of daily living, such as using the telephone, paying bills, taking medications, preparing light meals, doing laundry, or going shopping. The measure "any limitations" is a combined measure that indicates whether an individual had one or more limitations, including ADLs/IADLs, physical activity limitations (such as difficulty walking, bending, or stooping), or work/housework/school limitations.
About MEPS-HC
MEPS-HC is a nationally representative longitudinal survey that collects detailed information on health care utilization and expenditures, health insurance, and health status, as well as a wide variety of social, demographic, and economic characteristics for the civilian noninstitutionalized population. It is cosponsored by the Agency for Healthcare Research and Quality and the National Center for Health Statistics.
For more information about MEPS, call the MEPS information coordinator at AHRQ (301-427-1656) or visit the MEPS Web site at http://www.meps.ahrq.gov/.
References
For a detailed description of the MEPS-HC survey design, sample design, and methods used to minimize sources on nonsampling error, see the following publications:
Cohen, J. Design and Methods of the Medical Expenditure Panel Survey Household Component. MEPS Methodology Report No. 1. AHCPR Pub. No. 97-0026. Rockville, Md.: Agency for Health Care Policy and Research, 1997.
Cohen, S. Sample Design of the 1996 Medical Expenditure Panel Survey Household Component. MEPS Methodology Report No. 2. AHCPR Pub. No. 97-0027. Rockville, Md.: Agency for Health Care Policy and Research, 1997.
Cohen, S. Design Strategies and Innovations in the Medical Expenditure Panel Survey. Medical Care, July 2003: 41(7) Supplement: III-5-III-12.
Suggested Citation
Conwell, L. J. and Cohen, J. W. Characteristics of Persons with High Medical Expenditures in the U.S. Civilian Noninstitutionalized Population, 2002. Statistical Brief #73. March 2005. Agency for Healthcare Research and Quality, Rockville, Md. http://meps.ahrq.gov/mepsweb/data_files/publications/st73/stat73.shtml
 |
||||||||||||||||||||||||||||||
|
||||||||||||||||||||||||||||||
|
|
||||||||||||||||||||||||||||||
 |
||||||||||||||||||||||||||||||
|
||||||||||||||||||||||||||||||
|
|
||||||||||||||||||||||||||||||
 |
||||||||||||||||||||||||||||||
|
||||||||||||||||||||||||||||||
|
|
||||||||||||||||||||||||||||||
 |
||||||||||||||||||||||||||||||
|
||||||||||||||||||||||||||||||
|
|
||||||||||||||||||||||||||||||
 |
||||||||||||||||||||||||||||||
|
||||||||||||||||||||||||||||||
|
|
||||||||||||||||||||||||||||||
 |
||||||||||||||||||||||||||||||
|
||||||||||||||||||||||||||||||
|
|
||||||||||||||||||||||||||||||


