
|
|
Font Size:
|
||||
|
|
|
|
||||
STATISTICAL BRIEF #86:
Trends in National Health Care Expenses in the U.S. Civilian Noninstitutionalized Population, 1997 versus 2002
Highlights
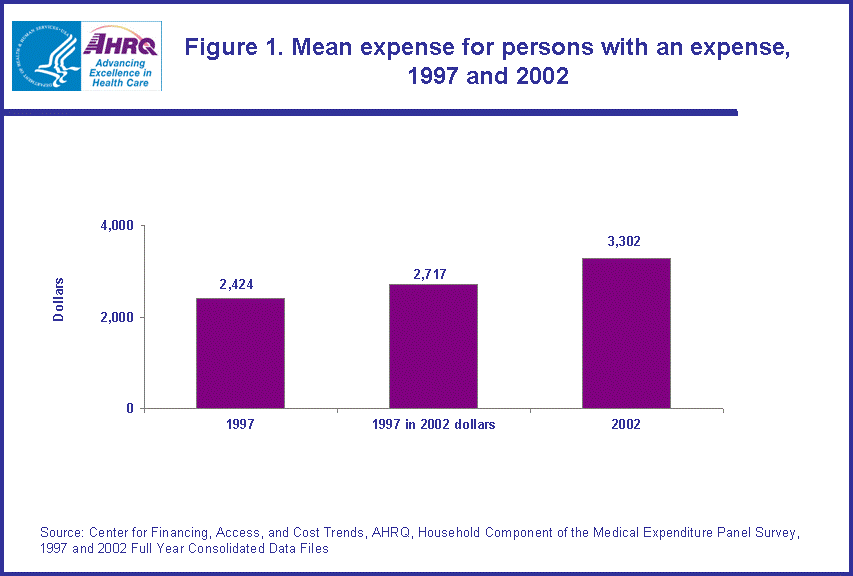
- The mean expense for persons with an expense increased from $2,717 (in 2002 dollars) in 1997 to $3,302 in 2002, a 21.5 percent increase.
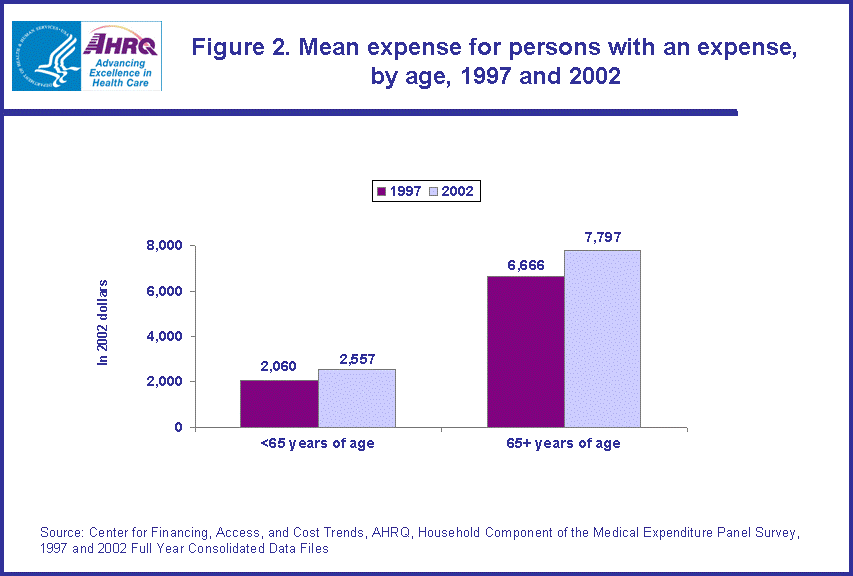
- The mean expense for the non-elderly (under age 65) increased 24.1 percent from $2,060 (in 2002 dollars) in 1997 to $2,557 in 2002 while the mean expense of those age 65 and older increased 17.0 percent from $6,666 to $7,797.
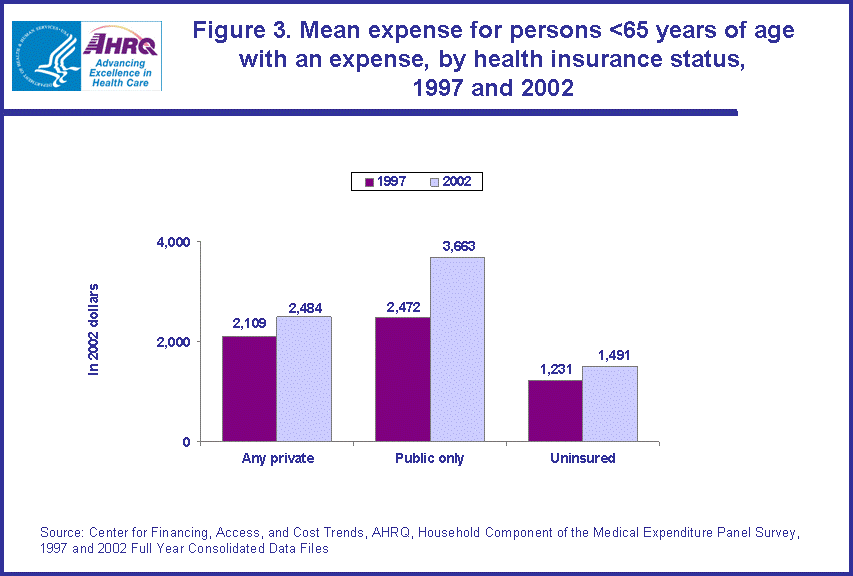
- The rate of increase in the mean expense between 1997 and 2002 for the non-elderly with public only insurance (48.2 percent) was higher than for those with any private insurance (17.8 percent), reflecting an increase from $2,472 (in 2002 dollars) to $3,663 for those with public only health insurance and from $2,109 to $2,484 for those with any private health insurance.
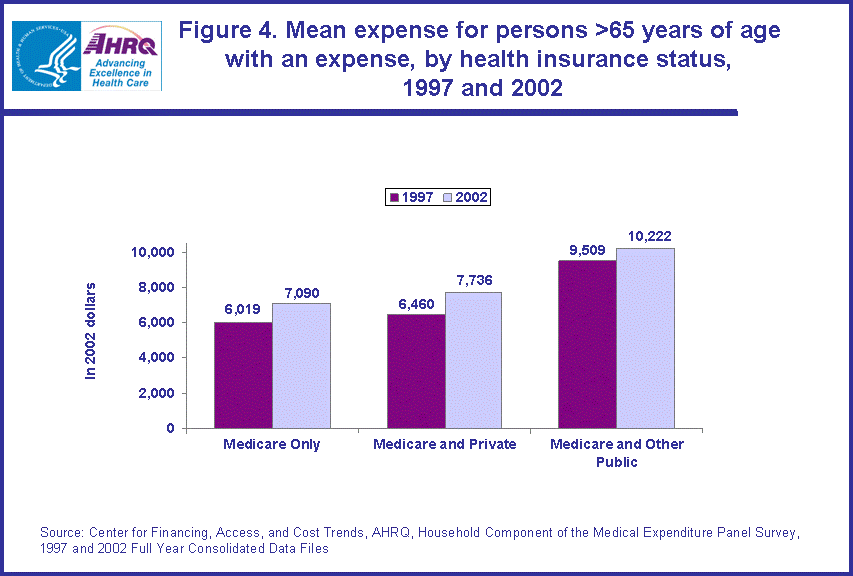
- For the elderly, the increase in the mean expense from 1997 (in 2002 dollars) to 2002 was significant only for those with Medicare and private insurance ($6,460 versus $7,736).
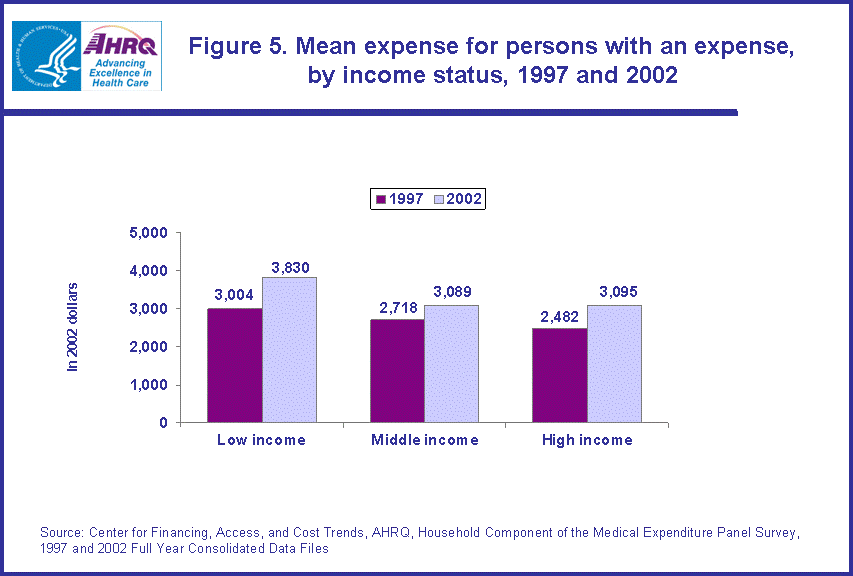
- The mean health care expenditures for low-income individuals increased from $3,004 (in 2002 dollars) in 1997 to $3,830 in 2002 and for high-income individuals from $2,482 to $3,095.
Introduction
Trends in health care expenditures are important to policymakers who are concerned about the rising cost of health care in the United States. This Statistical Brief compares national health care expenses in 1997 with those in 2002 for the overall U.S. civilian noninstitutionalized (community) population and by age, health insurance status, and income status.
The estimates in the brief are derived from the Household Component of the Medical Expenditure Panel Survey (MEPS-HC) for 1997 and 2002. The estimates of mean expenses presented are for those people who had at least some medical expenses during the year. Expenses for 1997 are adjusted to account for overall inflation (about 12 percent) over the five-year period. All differences between estimates discussed in the text are statistically significant at the 0.05 level unless otherwise noted.
Findings
Total population
The percentage of the total U.S. community population who had medical expenses was similar in both 1997 and 2002 (84.1 percent and 85.2 percent, respectively). Total health care expenses increased from about $553.2 billion in 1997 to approximately $810.7 billion in 2002 (data not shown), an increase of 46.5 percent. Only about one-quarter of this increase can be attributed to general inflation. (Estimates not shown in figures.)
In 1997, the mean expense per person with a medical expense was $2,424 (figure 1). When expenditures for 1997 are expressed in 2002 dollars, mean spending increased 21.5 percent from $2,717 in 1997 to $3,302 in 2002. Median expenses are substantially lower than mean expenses because a small proportion of the population accounts for a disproportionate amount of medical expenses. The median expense of the total population also increased substantially when comparing 1997 and 2002, rising by nearly 50 percent from $643 (in 2002 dollars) to $960 (estimates not shown).
Age
The elderly (persons age 65 and older) are more likely to have expenses for health care than the non-elderly (e.g., 96.3 percent versus 83.6 percent in 2002; estimate not shown), and their average expenses are also higher (e.g., $7,797 versus $2,557 in 2002; figure 2).
The mean expense of $7,797 for the population over age 65 in 2002 was 17.0 percent higher than in 1997 ($6,666 in 2002 dollars). Similarly, the mean expense for the population under age 65 of $2,557 in 2002 was 24.1 percent higher than in 1997 ($2,060 in 2002 dollars). (figure 2)
Health insurance status
Between 1997 and 2002, the mean health care expense for the non-elderly with any private health insurance increased 17.8 percent from $2,109 (in 2002 dollars) to $2,484. However, the increase for those with public only health insurance was much higher, at 48.2 percent ($2,472 versus $3,663, in constant dollars). (figure 3)
For the elderly, only the mean expense for those with Medicare and private insurance showed a significant increase from 1997 to 2002 from $6,460 to $7,736, which represented a 19.7 percent increase. (figure 4)
Income level
The lowest and highest income categories exhibited similar increases in mean expenses from 1997 to 2002. For the low-income category, the mean expense in 1997 (in 2002 dollars) was $3,004 while the mean expense in 2002 was $3,830, a 27.5 percent increase. The mean expense for the high-income group increased 24.7 percent ($2,482 to $3,095, in constant dollars). (figure 5)
Data Source
The estimates in this Statistical Brief are based upon data from the MEPS 1997 and 2002 Full Year Consolidated Data Files, HC-020 and HC-070.
Definitions
Expenditures
Expenditures include the total payments from all sources to hospitals, physicians, other health care providers (including dental care), and pharmacies for services reported by respondents in the MEPS-HC. Sources include direct payments from individuals, private insurance, Medicare, Medicaid, and miscellaneous other sources. Expenditures for hospital-based services include those for both facility and separately billed physician services. Expenditures for 1997 were adjusted to 2002 dollars (an increase of 12.1 percent) based on the Consumer Price Index for All Urban Consumers (CPI-U) for all items averaged across all U.S. cities.
Health insurance status
- Private coverage: Private health insurance coverage is defined as nonpublic insurance that provides coverage for hospital and physician care (including Medigap coverage). Persons covered by TRICARE (Armed Forces-related coverage) are also included in this category.
- Public only coverage: People are considered to have public only health insurance coverage if they are not covered by private insurance and they are covered by Medicare, Medicaid, or other public hospital and physician coverage.
- Uninsured: People who did not have insurance coverage at any time during the survey year are classified as uninsured. People who are covered only by noncomprehensive, State-specific programs (e.g., Maryland Kidney Disease Program) or private single-service plans (e.g., coverage for dental or vision care only, coverage for accidents or specific diseases) are considered to be uninsured.
Each sample person is classified according to the total annual income of his or her family. Within a household, all individuals related by blood, marriage, or adoption are considered to be a family. Personal income from all family members is summed to create family income. Poverty status is the ratio of family income to the Federal poverty thresholds, which control for family size and age of the head of family. Categories are defined as follows:
- Low income: Persons in families with income below the Federal poverty line through 200 percent of the poverty line.
- Middle income: Persons in families with income over 200 percent to 400 percent of the poverty line.
- High income: Persons in families with income over 400 percent of the poverty line.
About MEPS-HC
MEPS-HC is a nationally representative longitudinal survey that collects detailed information on health care utilization and expenditures, health insurance, and health status, as well as a wide variety of social, demographic, and economic characteristics for the civilian noninstitutionalized population. It is cosponsored by the Agency for Healthcare Research and Quality and the National Center for Health Statistics.
For more information about MEPS, call the MEPS information coordinator at AHRQ (301-427-1656) or visit the MEPS Web site at http://www.meps.ahrq.gov/.
References
For a detailed description of the MEPS-HC survey design, sample design, and methods used to minimize sources of nonsampling error, see the following publications:
Cohen, J. Design and Methods of the Medical Expenditure Panel Survey Household Component. MEPS Methodology Report No. 1. AHCPR Pub. No. 97-0026. Rockville, Md.: Agency for Health Care Policy and Research, 1997.
Cohen, S. Sample Design of the 1996 Medical Expenditure Panel Survey Household Component. MEPS Methodology Report No. 2. AHCPR Pub. No. 97-0027. Rockville, Md.: Agency for Health Care Policy and Research, 1997.
Cohen, S. Design Strategies and Innovations in the Medical Expenditure Panel Survey. Medical Care, July 2003: 41(7) Supplement: III-5-II-12.
Suggested Citation
Kashihara, D. and Carper, K. Trends in National Health Care Expenses in the U.S. Civilian Noninstitutionalized Population, 1997 versus 2002. Statistical Brief #86. June 2005. Agency for Healthcare Research and Quality, Rockville, Md. http://meps.ahrq.gov/mepsweb/data_files/publications/st86/stat86.shtml
 |
||||||||||||||||||||
|
||||||||||||||||||||
|
|
||||||||||||||||||||
 |
||||||||||||||||||||
|
||||||||||||||||||||
|
|
||||||||||||||||||||
 |
||||||||||||||||||||
|
||||||||||||||||||||
|
|
||||||||||||||||||||
 |
||||||||||||||||||||
|
||||||||||||||||||||
|
|
||||||||||||||||||||
 |
||||||||||||||||||||
|
||||||||||||||||||||
|
|
||||||||||||||||||||


