|
|
Font Size:
|
||||
|
|
|
|
||||
STATISTICAL BRIEF #9:
Hospital Admission Rates--1987 and 1998
Briefly Stated
- From 1987 to 1998, the hospital admissions rate declined significantly from 114 per 1000 to 96 per 1000, representing a 16% decrease.
- Among people under the age of 65, those covered by only public health insurance all year experienced the highest rates of hospital admissions in both 1987 and 1998.
Introduction
Hospitals are a major component of the American health care delivery system. While only a small proportion of the population enters a hospital each year (7.1 percent in 1998), a hospital admission is a major medical event. This Statistical Brief compares the changes in the rate of hospital admission per 1000 persons in the U.S. civilian, noninstitutionalized population for the years 1987 and 1998. This representation of use is presented in relation to a variety of demographic characteristics in order to examine differentials across the years of the study.
The estimates in this Statistical Brief are based on data from the 1987 National Medical Expenditure Survey (NMES) and the 1998 Medical Expenditure Panel Survey Household Component (MEPS-HC). Both of the surveys were based on a national probability sample of the civilian noninstitutionalized population of the United States. The 1987 NMES data set contains a sample of 34,459 persons with a response rate of about 80 percent while the 1998 MEPS HC data set contains a sample of 22,953 persons with a pooled annual response rate of 67.9 percent. Both surveys collected extensive information on health care utilization, health insurance, and income, as well as a variety of background social, demographic, and economic characteristics. Results presented in this Statistical Brief are statistically significant at the .05 level.
Definitions
Hospital Admissions
Hospital admissions include all admissions for inpatient stays of one (1) night or more. Stays for newborn infants are included in the mother's stay unless the newborn was discharged at least 24 hours after the mother's discharge.
Health Insurance Coverage
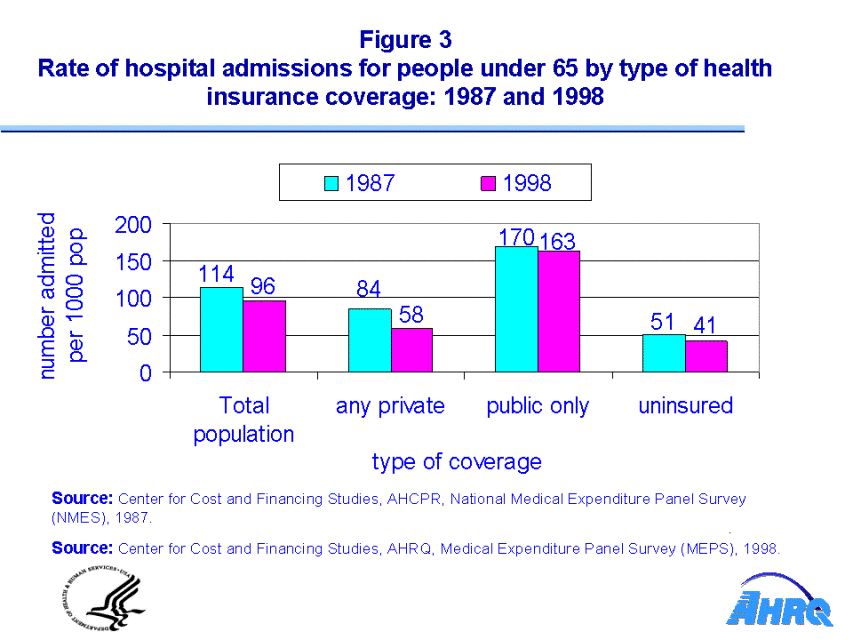
The health insurance coverage variables used in this Statistical Brief are hierarchical summary variables. Any private indicates persons having private insurance coverage (including CHAMPUS/VA) any time during the year. Public only denotes persons having only public insurance coverage all year, and uninsured indicates persons who were uninsured all year.
Results
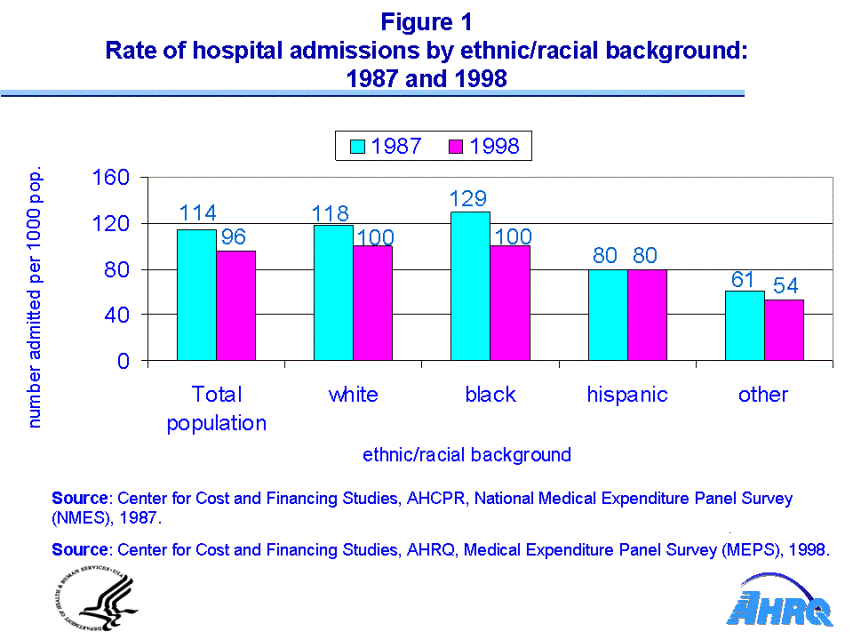
During the period from 1987 to 1998, the rate of hospital admissions per 1000 of the U.S. non-institutionalized civilian population declined significantly from 114 per 1000 to 96 per 1000, representing a 16% decrease.
Regarding race and ethnic characteristics, Figure 1 shows that non-Hispanic blacks had the highest rate of hospital admission in 1987 (129 per 1000); however, by 1998 their rates had fallen 22% to equal that of non-Hispanic whites (100 per 1000). Hispanics and others' admissions rates did not fall but remained stable during the eleven year period (80 per 1000).
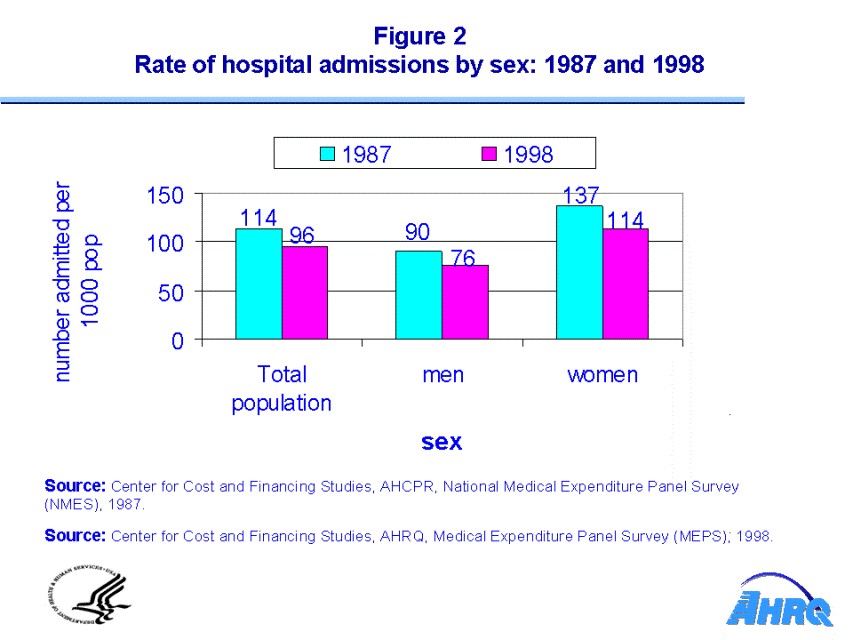
In 1987 and 1998, women had significantly higher hospital admission rates than men. In 1987, women were admitted to hospitals at a rate of 137 per 1000 while men were admitted at a rate 90 per 1000. Even though, in 1998, the rate for women dropped to 114 per 1000, it remained higher than the rate for men at 76 per 1000. (Figure 2)
With respect to health insurance coverage among people under the age of 65, those covered by any private insurance, over the course of the year, were nearly 1.65 more likely to be admitted to hospitals than those uninsured all year in 1987 (84 per 1000 versus 51 per 1000). By 1998, this differential in admission rates by insurance coverage was less dramatic. Nevertheless, those covered only by public health insurance experienced the highest rates of hospital admissions in both 1987 (170 per 1000) and 1998 (160 per 1000). (Figure 3)
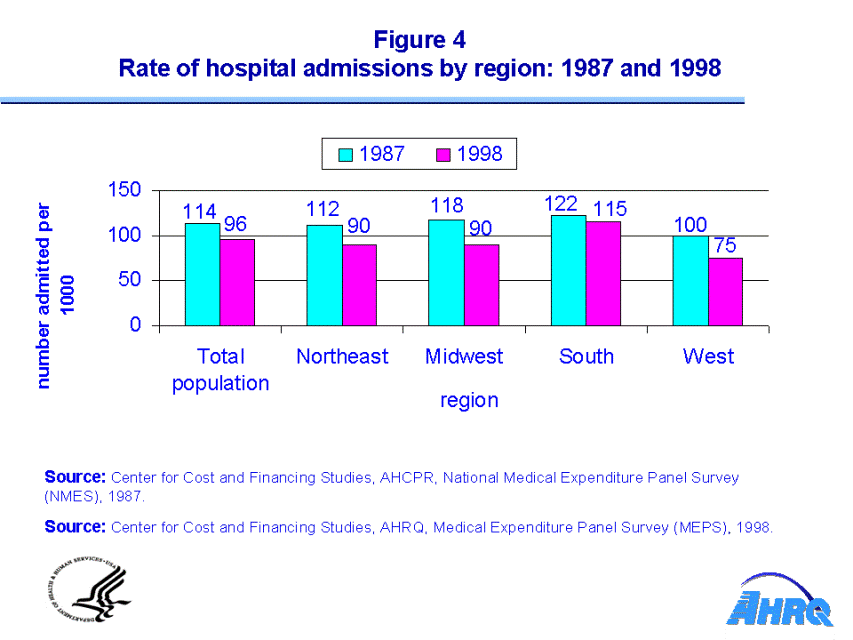
The South was the only region that did not experience a significant decline in rates of hospital admissions. Both the West and the Midwest saw similar rates of decline with the West dropping from 100 to 75 per 1000 (a 25% decline) and the Midwest, from 118 to 90 per 1000 (a 24% decline). (Figure 4)
About MEPS
The Medical Expenditure Panel Survey (MEPS) collects nationally representative data on health care use, expenditures, sources of payment, and insurance coverage for the U.S. civilian noninstitutionalized population. MEPS is cosponsored by the Agency for Healthcare Research and Quality (AHRQ) and the National Center for Health Statistics (NCHS).
 |
||||||||||||||||||||||||
|
||||||||||||||||||||||||
|
|
||||||||||||||||||||||||
 |
||||||||||||||||||||||||
|
||||||||||||||||||||||||
|
|
||||||||||||||||||||||||
 |
||||||||||||||||||||||||
|
||||||||||||||||||||||||
|
|
||||||||||||||||||||||||
 |
||||||||||||||||||||||||
|
||||||||||||||||||||||||
|
|
||||||||||||||||||||||||


