MEPSnet/IC Statistical Help
For each chart generated by MEPSnet/IC, a table is provided which lists the survey estimates shown in the chart and their corresponding standard errors (SE). These standard errors reflect the estimated sampling error associated with the estimate (i.e. potential error introduced because data were collected for only a sample of establishments).
Analysts frequently generate 95% confidence intervals to assess the precision of survey estimates. These intervals are computed as:
Estimate +/- 1.96*SE
MEPSnet/IC displays a 95 percent confidence interval for each estimate shown in the chart. A 95 percent confidence interval has the following general interpretation: applying the interval-estimating procedure to all possible samples, a statement that a given interval enclosed the true population mean would be correct 95 percent of the time. Therefore, one can be 95 percent sure that an interval constructed from one sample captures the true population mean.
As an example, the following chart and table generated using MEPSnet/IC shows the average total single premium levels from 2012-14 at private-sector establishments that offer health insurance. The estimated average premium in 2012 was $5,384, but the corresponding confidence interval was $5,384 +/- 1.96*27.83 (i.e. the interval ranges from $5,329.45.30 to $5,438.55).
Test of Significance
To interpret whether there has been a statistically significant change between 2 particular years, one can compute a z-statistic using the following formula:
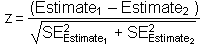
For example, the z-statistic to assess whether the difference in average premiums between 2012 and 2014 is statistically significant would be computed as follows:
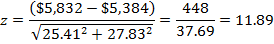
The threshold z-statistic for establishing statistical significance at the .05 level is 1.96. That is, if the calculated z-statistic is greater than 1.96 or less than 1.96, the estimates are significantly different at the .05 level. All values that are significant at the 0.05 level are marked with an *. For this example, the calculated z-statistic of 11.89 is greater than 1.96, so the difference between the two years is statistically significant.
The p-value shown in the table below is the probability of having a z-statistic as large or larger than the one calculated from these estimates (or smaller in cases where the z-statistic is negative). When this p-value is less than or equal to the 0.05 level of significance, then the difference is statistically significant at that level and is marked with an *. In our example, the p-value associated with the z-statistic of 11.89 is very small (rounds to 0.00000) and thus this difference is statistically significant.
| Year |
Average |
Std. Error |
| 2012 |
5,384 |
27.83 |
| 2013 |
5,571 |
22.70 |
| 2014 |
5,832 |
25.41 |
z-Test Showing the Significance of Change Between Years
| Years Compared |
Average |
SE |
Joint SE |
z-Statistic |
p-Value (two-tail) |
| 2012 |
5,384 |
27.83 |
35.91 |
5.19785 |
0.00000* |
| 2013 |
5,571 |
22.70 |
| 2012 |
5,384 |
27.83 |
37.69 |
11.87253 |
0.00000* |
| 2014 |
5,832 |
25.41 |
| 2013 |
5,571 |
22.70 |
34.07 |
7.65380 |
0.00000* |
| 2014 |
5,832 |
25.41 |
* Significant at 0.05 level
Average total single premium (in dollars) per enrolled employee at private-sector establishments that offer health insurance: United States
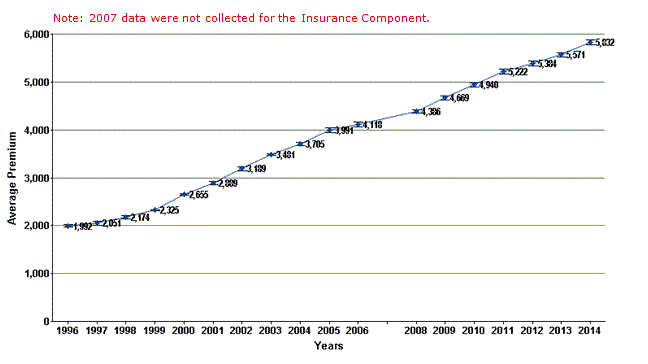
| Years |
Average Premium |
| 1996 |
1,992 |
| 1997 |
2,051 |
| 1998 |
2,174 |
| 1999 |
2,325 |
| 2000 |
2,655 |
| 2001 |
2,889 |
| 2002 |
3,189 |
| 2003 |
3,481 |
| 2004 |
3,705 |
| 2005 |
3,991 |
| 2006 |
4,118 |
| 2007 |
- |
| 2008 |
4,386 |
| 2009 |
4,669 |
| 2010 |
4,940 |
| 2011 |
5,222 |
| 2012 |
5,384 |
| 2013 |
5,571 |
| 2014 |
5,832 |
- 2007 data were not coleected for the Insurance Component.
|
