Chartbook #6:
Nursing Home Expenses, 1987 and 1996
By Jeffrey A. Rhoades, Ph.D., John P. Sommers, Ph.D.
Contents
The estimates in this report are based on the most recent data available from MEPS at the time the report was written. However, selected elements of MEPS data may be revised on the basis of additional analyses, which could result in slightly different estimates from those shown here. Please check the MEPS Web site for the most current file releases—www.meps.ahrq.gov
Executive Summary
How have nursing home expenses and sources of payment changed from 1987 to 1996?
Facilities
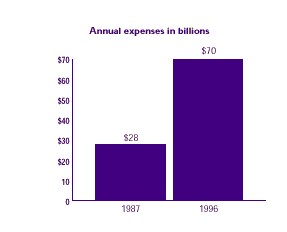
From 1987 to 1996, total annual expenses increased from $28 billion to $70 billion, and annual expenses per resident day increased from $56 to $118.
Medicare paid a greater portion of the nursing home bill in 1996 than in 1987, especially for hospital-based nursing homes, nursing homes with fewer beds, and those located in the West Region.
Residents
The proportion of total annual nursing home expenses per resident paid for by Medicare increased for all age groups.
The share paid for by Medicaid decreased for all racial/ethnic groups, particularly for minorities. Medicaid as a source of payment decreased from 69.0% to 50.6% of total annual nursing home expenses per resident for Hispanics, and it decreased from 77.7% to 66.4% for blacks.
Residents who were not married, did not own a home, or were covered by Medicaid tended to have higher annual expenses per resident but lower annual expenses per resident day.
In 1996, people residing in a nursing home for the shortest period of time (both admitted and discharged during the year or both admitted and dying during the year) had the lowest annual expenses per resident but the highest annual expenses per resident day. Medicare paid the largest proportion of the total nursing home bill for these residents.
The share of annual expenses per resident paid for by Medicare increased from 1987 to 1996 for each income category. The greatest increase was for residents in the highest income category.
In 1996, individuals with neither functional disability nor mental conditions had lower annual expenses per resident but higher annual expenses per resident day. Medicare paid a greater portion of the nursing home bill for such individuals than for residents with functional disabilities or mental conditions.
Throughout this report, a nursing home is defined as having at least three beds, being either certified by Medicare or Medicaid or licensed by a government agency as a nursing home, and providing 24-hour skilled nursing care.
Return To Table Of Contents
Introduction
Nursing homes serve only a minority of the functionally impaired elderly, but nursing home care dominates long-term care financing. State and Federal spending for nursing homes represented 67.4% of total annual expenditures for nursing home and home health services in 1996 (Levit, Lazenby, Braden, et al., 1997).
With increasing life expectancy and a growing population with functional impairments, meeting long-term care needs will continue to be a challenge. Demand for nursing home care could require 600,000 new beds by 2010 (Porter and Witek, 1991). Because most nursing home care is financed out of pocket or through Medicaid, the prospect of rapid increases in the number of Americans who are elderly and at risk for nursing home care has turned the financing of these services into a matter of intense private and public concern.
This report presents information concerning expenses (total payments received for care, defined more fully in the section “Definitions of Terms”) and sources of payment for nursing homes for 1987 and 1996. A nursing home was defined as having at least three beds, being either certified by Medicare or Medicaid or licensed by a government agency as a nursing home, and providing 24-hour skilled nursing care. Some other surveys, including the National Nursing Home Survey, conducted by the National Center for Health Statistics, used a broader definition of nursing home that does not require the facility to provide round-the-clock nursing care (Strahan, 1987 and 1997).
This chartbook and other MEPS publications are available electronically on the MEPS Web site at http://www.meps.ahrq.gov
Return To Table Of Contents
Sources of Data
The estimates presented in this report are drawn from the 1996 Medical Expenditure Panel Survey (MEPS) Nursing Home Component (NHC) and the 1987 National Medical Expenditure Survey (NMES) Institutional Population Component (IPC). Both surveys were designed to provide extensive data on the types of health care services Americans use, how frequently they use them, how much is paid for the services, and who pays for them. The NHC and IPC are nationally representative surveys, sponsored by the Agency for Healthcare Research and Quality (AHRQ). They collect detailed information on characteristics of nursing homes and nursing home residents and on the use of and expenses for nursing home and health care services.
The estimates presented here are nationally representative of nursing homes and their residents. Estimates for residents are based on a sample of current residents as well as admissions during the reference year. Current residents are sampled persons living in a nursing home as of midnight December 31 of 1986 or 1995, while admissions are sampled persons admitted any time during the reference year, January 1 to December 31 of 1987 or 1996. Unless otherwise noted, only differences that are statistically significant at the 0.05 level are discussed in the text. In some cases, totals on figures may not add precisely to 100% as a consequence of rounding.
MEPS data are released to the public in a number of formats, including public use data files and the printed MEPS Research Findings and MEPS Highlights series. The numbers shown in this chartbook are drawn from a variety of the MEPS Research Findings reports, as well as additional analyses conducted by the MEPS staff. The sources of information are listed in the references at the end of this report.
Return To Table Of Contents
Section 1: Overview
The dramatic growth in the number of Americans over age 75, the desire to minimize the duration of expensive inpatient hospital care, and policy developments (including the expansion of nursing home benefits under the Medicare Catastrophic Coverage Act of 1988) over the past decade have raised the importance of data pertaining to the nursing home market. At the same time, there are substantial regional variations that result from a variety of factors, including State regulations and demographic realities. A better understanding of current nursing home expenses and changes over the past decade can contribute to informed decisions about the provision of long-term care.
How have nursing home expenses changed from 1987 to 1996?
| Annual Expenses in billions |
| 1987 |
28 billion |
| 1996 |
70 billion |
|
| Annual Expense per resident |
| 1987 |
$13,866 |
| 1996 |
$22,561 |
|
| Expense per resident day |
| 1987 |
$56 |
| 1996 |
$118 |
|
-
Total annual expenses rose from $28 billion in 1987 to $70 billion in 1996, a 150% increase.
-
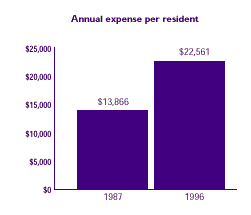
Annual expenses per resident (mean total annual nursing home expenses per nursing home resident) increased by 63%—from $13,866 in 1987 to $22,561 in 1996.
-
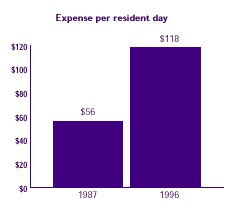
Annual expenses per resident day (mean total payments per resident day) rose from $56 in 1987 to $118 in 1996, representing a 111% increase.
See Technical Notes 1 and 2. See the “Definitions of Terms” section for more detailed definitions.
Return To Table Of Contents
Have sources of payment for nursing home care changed?
| Payment Sources |
| |
Medicaid |
Medicare |
Self-payment |
Private insurance |
Other |
| 1987 |
48.8% |
1.9% |
44.9% |
1.6% |
2.8% |
| 1996 |
44.0% |
18.9% |
30.3% |
3.5% |
3.3% |
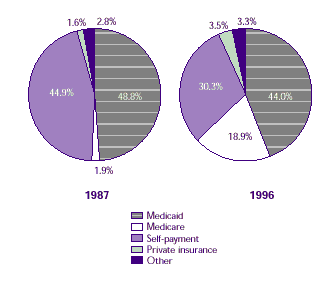
The major sources of payment for total annual nursing home expenses shifted from 1987 to 1996. The share of total expenses paid by Medicaid was 48.8% in 1987 and 44.0% in 1996. Self-payment (out-of- pocket payments) fell from 44.9% in 1987 to 30.3% in 1996. Medicare payments represent the greatest change between the two years— almost a 900% increase, from 1.9% of total payments in 1987 to 18.9% in 1996.
See Technical Notes 3 and 4.
Return To Table Of Contents
What regional trends can be seen in daily nursing home expenses?
- Annual expenses per resident day were highest in the Northeast and West for both 1987 ($73 and $59, respectively) and 1996 ($144 and $151, respectively).
- The biggest increase in daily expenses took place in the West—an increase of 156% over the 9-year period. Daily expenses in the Northeast rose 97% over the same period.
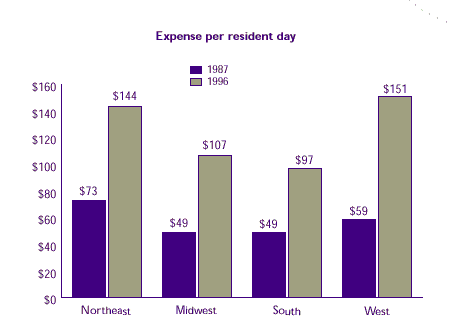
| Expense per resident day |
| |
Northeast |
Midwest |
South |
West |
| 1987 |
$73 |
$49 |
$49 |
$59 |
| 1996 |
$144 |
$107 |
$97 |
$151 |
Return To Table Of Contents
How have sources of payment varied by region over time?
The proportion of nursing home expenses paid for by Medicare rose in all regions.
The greatest change in sources of payment was observed in the West, where Medicare’s share increased from 4.1% to 34.7% while there were decreases in both self-payment (47.5% to 26.2%) and Medicaid (41.9% to 29.8%)
Return To Table Of Contents
Section 2: Facility Characteristics
Facility Characteristics While the trend in long-term care is toward expansion of community-based care for people with functional limitations, some people need 24-hour skilled nursing care. The need for different types and levels of long-term care has resulted in an increasing number of options for obtaining care. Given these changes in the long-term care market, it becomes increasingly important to make clear and consistent distinctions among the different kinds of facilities that lie along the continuum of care.
Return To Table Of Contents
Have daily expenses changed for different types of nursing homes?
-
The greatest increase in annual expenses per resident day has been for hospital-based nursing homes. Daily expenses for hospital-based nursing homes rose from $83 in 1987 to $212 in 1996—a 155% increase.
-
Annual expenses per resident day increased 106% for freestanding nursing homes and 76% for nursing homes with multiple levels of care.
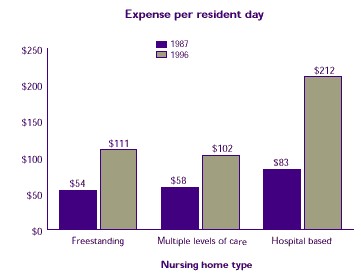
Expense per resident day |
| |
Freestanding |
Multiple levels of care |
Hospital based |
| 1987 |
$54 |
$58 |
$83 |
| 1996 |
$111 |
$102 |
$212 |
Return To Table Of Contents
How have sources of payment changed for hospital-based nursing homes?
- The proportion of total annual expenses paid by Medicare and Medicaid changed the most for hospital-based nursing homes between the two years. There was an increase in the proportion of total annual expenses paid for by Medicare (from 6.2% in 1987 to 44.2% in 1996) with an accompanying downward trend in the proportion paid for by Medicaid (from 59.3% to 19.4%).
- In comparison, for freestanding nursing homes, the proportion of total annual expenses paid by Medicare increased from 1.6% in 1987 to 15.2% in 1996 while the proportion paid by Medicaid (49.6%) was unchanged in both years (data not shown).
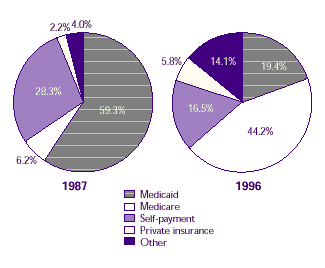
| Payment changes for hospital-based nursing homes |
| |
Medicaid |
Medicare |
Self-payment |
Private insurance |
Other |
| 1987 |
59.3% |
6.2% |
28.3% |
2.2% |
4.0% |
| 1996 |
19.4% |
44.2% |
16.5% |
5.8% |
14.1% |
Return To Table Of Contents
How have sources of payment varied by nursing home size over time?
For smaller nursing homes (3- 74 beds), the share of total annual nursing home expenses paid for by Medicare increased dramatically. Medicare covered 2.4% of total annual expenses in these homes in 1987, rising to 37.3% in 1996. There was a corresponding downward trend for self-payment (from 55.2% to 28.1%) and Medicaid (from 36.5% to 28.9%, not significant) over the same time period.
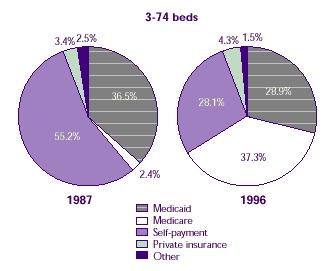
| Sources of payment variations by nursing home size over time |
| |
Medicaid |
Medicare |
Self-payment |
Private Insurance |
Other |
| 1987 |
36.5% |
2.4% |
55.2% |
3.4% |
2.5% |
| 1996 |
28.9% |
37.3% |
28.1% |
4.3% |
1.5% |
Return To Table Of Contents
How have sources of payment varied by nursing home size over time? (continued)
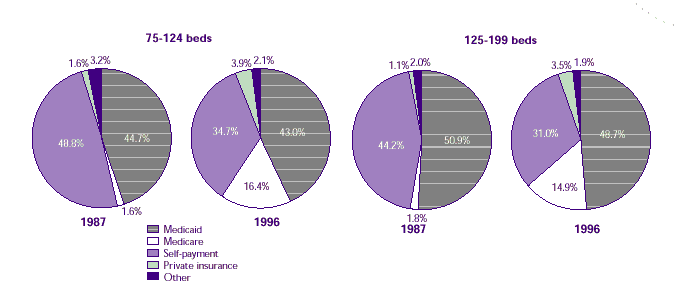
| 75 - 124 beds |
| |
Medicaid |
Medicare |
Self-payment |
Private Insurance |
Other |
| 1987 |
44.7% |
1.6% |
48.8% |
1.6% |
3.2% |
| 1986 |
43.0% |
16.4% |
34.7% |
3.9% |
2.1% |
|
| 75 - 124 beds |
| |
Medicaid |
Medicare |
Self-payment |
Private Insurance |
Other |
| 1987 |
44.7% |
1.6% |
48.8% |
1.6% |
3.2% |
| 1986 |
43.0% |
16.4% |
34.7% |
3.9% |
2.1% |
|
Return To Table Of Contents
How have sources of payment varied by nursing home size over time? (continued)
The pattern was less dramatic for the other nursing homes, particularly the largest (200 beds or more). For these largest homes, the Medicare share increased only from 2.2% to 10.4%. The declines for self-payment (from 33.1% to 24.4%) and Medicaid (from 60.9% to 54.3%, not significant) were also less dramatic for the largest nursing homes.
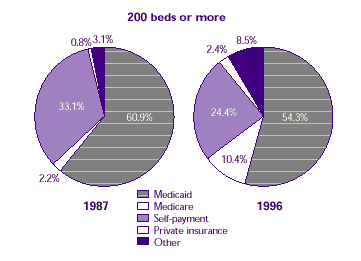
200 beds or more |
| |
Medicaid |
Medicare |
Self-payment |
Private insurance |
Other |
| 1987 |
60.9% |
2.2% |
33.1% |
0.8% |
3.1% |
| 1996 |
54.3% |
10.4% |
24.4% |
2.4% |
8.5% |
Return To Table Of Contents
Section 3: Resident Characteristics
Despite the increasing availability of long-term care alternatives, such as community-based care and personal care facilities, nursing homes continue to be an important part of the long-term care system. The nursing home population represents a small proportion of both the elderly population and the general population of people with disabilities. Nursing homes primarily serve members of these populations who have severe medical and disability problems that require the intensity of care available in a nursing home. A lack of financial resources or family caregivers contributes to the need for these institutions (Congressional Budget Office, 1991).
Is the age of nursing home residents associated with sources of payment?
-
For both 1987 and 1996, the general trend was for individuals (and their families) to pay a greater proportion of the nursing home bill as the resident’s age increased. For example, in 1996, 15.4% of total annual nursing home expenses for residents age 64 and under were self-payments (out-of-pocket payments made by nursing home residents or their families). In the same year, 38.0% of total annual nursing home expenses for residents age 85 and over were self-payments.
-
The proportion of total annual nursing home expenses per resident paid for by Medicare increased for all age groups from 1987 to 1996. At the same time, the proportion paid for by Medicaid decreased for age groups 65-74 and 75-84.
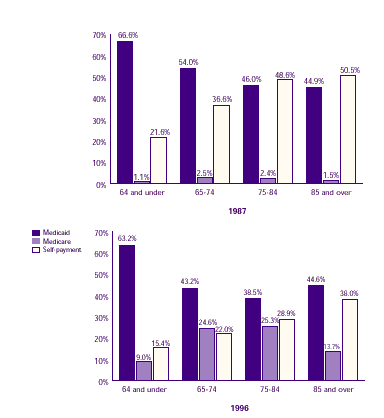 |
| 1987 |
| |
64 and under |
65 - 74 |
75 -84 |
85 and over |
| Medicaid |
66.6% |
54.0% |
46.0% |
44.9% |
| Medicare |
1.1% |
2.5% |
2.4% |
1.5% |
| Self-payment |
21.6% |
36.6% |
48.6% |
50.5% |
|
| 1996 |
| |
64 and under |
65 - 74 |
75 -84 |
85 and over |
| Medicaid |
63.2% |
43.2% |
38.5% |
44.6% |
| Medicare |
9.0% |
24.6% |
25.3% |
13.7% |
| Self-payment |
15.4% |
22.0% |
28.9% |
38.0% |
|
Return To Table Of Contents
Do nursing home expenses per person vary for different racial/ethnic groups?
-
There was a statistically significant increase in both annual expenses per resident and annual expenses per resident day for all ethnic and racial groups from 1987 to 1996, with the exception of annual expenses per resident for Hispanics.
-
Annual expenses per resident increased by approximately $10,000 for whites and others and for blacks while the increase for Hispanics was only about $4,500. Annual expenses per resident day essentially doubled for all ethnic and racial groups from 1987 to 1996.
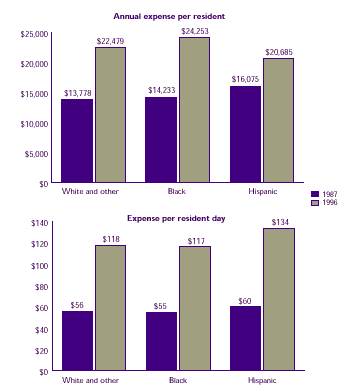 |
| Annual expense per resident |
| |
White and other |
Black |
Hispanic |
| 1987 |
$13,778 |
$14,233 |
$16,075 |
| 1996 |
$22,479 |
$24,253 |
$20,685 |
|
| Expense per resident day |
| |
White and other |
Black |
Hispanic |
| 1987 |
$56 |
$55 |
$60 |
| 1996 |
$118 |
$117 |
$134 |
|
Return To Table Of Contents
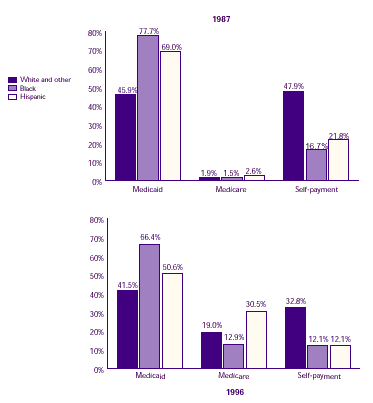
How have sources of payment varied by race/ethnicity over time?
-
The white and other group had the highest percentage of self-payments for nursing home care in both 1987 and 1996.
-
The proportion of annual nursing home expenses per resident paid for by Medicare increased in all groups from 1987 to 1996. The rise in the share paid by Medicare was greater for Hispanics (from 2.6% to 30.5%) than for whites and others (from 1.9% to 19.0%) and blacks (from 1.5% to 12.9%).
-
The share paid for by Medicaid decreased for all groups— Hispanics (from 69.0% to 50.6%), whites and others (from 45.9% to 41.5%), and blacks (from 77.7% to 66.4%)
 |
| 1987 |
| |
Medicaid |
Medicare |
Self-payment |
| White and other |
45.9% |
1.9% |
47.9% |
| Black |
77.7% |
1.5% |
16.7% |
| Hispanic |
69.0% |
2.6% |
21.8% |
|
| 1996 |
| |
Medicaid |
Medicare |
Self-payment |
| White and other |
41.5% |
19.0% |
32.8% |
| Black |
66.4% |
12.9% |
12.1% |
| Hispanic |
50.6% |
30.5% |
12.1% |
|
Return To Table Of Contents
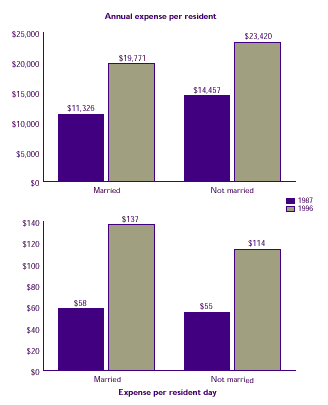
Are nursing home expenses different for married and unmarried residents?
-
In both 1987 and 1996, residents who were not married (widowed, divorced, separated, or never married) had higher annual expenses per resident than married residents. In 1996, unmarried residents had lower annual expenses per resident day than married residents. The combination of higher annual expenses per resident and lower annual expenses per resident day indicates that unmarried residents tended to have longer lengths of stay than married residents, and possibly received care of a more custodial nature.
-
Annual expenses per resident increased by approximately $9,000 for both married and unmarried residents from 1987 to 1996.
 |
| Annual expense per resident |
| |
Married |
Not married |
| 1987 |
$11,326 |
$14,457 |
| 1996 |
$19,771 |
$23,420 |
|
| Expense per resident day |
| |
Married |
Not married |
| 1987 |
$58 |
$55 |
| 1996 |
$137 |
$114 |
|
Return To Table Of Contents
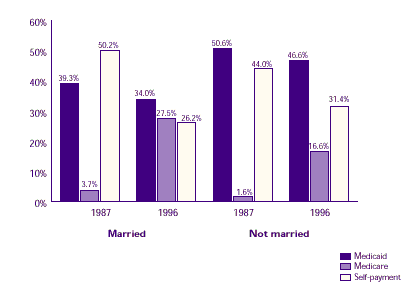
How do sources of payment for nursing home residents vary by marital status?
-
In both 1987 and 1996, unmarried residents relied more on Medicaid than married residents did.
-
For both married and unmarried residents Medicare paid a greater portion of the nursing home bill in 1996 than in 1987. The proportion paid for by Medicaid did not change significantly for either group.
| Married |
| |
Medicaid |
Medicare |
Self- payment |
| 1987 |
39.3% |
3.7% |
50.2% |
| 1996 |
34.0% |
27.5% |
26.2% |
|
| Not Married |
| |
Medicaid |
Medicare |
Self- payment |
| 1987 |
50.6% |
1.6% |
44.0% |
| 1996 |
46.6% |
16.6% |
31.4% |
|
Return To Table Of Contents
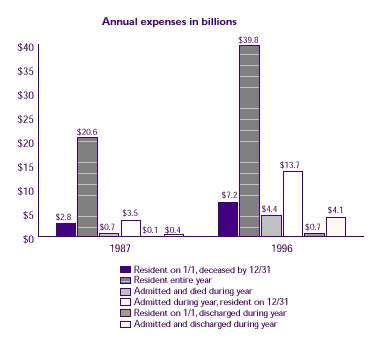
How do nursing home expenses vary by resident's institutional status?
- Total annual expenses were greatest for those residing in a nursing home for the entire year.
- Total expenses increased significantly for all groups from 1987 to 1996.
 |
| Annual expenses in billions |
| |
1987 |
1996 |
| Resident on 1/1, deceased by 12/31 |
$2.8 |
$7.2 |
| Resident entire year |
$20.6 |
$39.8 |
| Admitted and died during year |
$0.7 |
$4.4 |
| Admitted during year; resident on 12/31 |
$3.5 |
$13.7 |
| Resident on 1/1, discharged during year |
$0.1 |
$0.7 |
| Admitted and discharged during year |
$0.4 |
$4.1 |
|
Return To Table Of Contents
How do nursing home expenses vary by resident's institutional status? (continued)
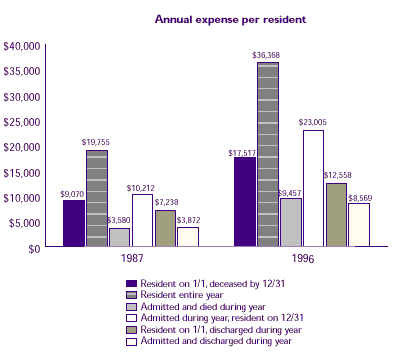
For both years, annual expenses per resident were highest for the people who resided in nursing homes for the longest period of time—those in the nursing home all year or admitted during the year and not discharged during the year. Annual expenses for an individual residing in a nursing home all year totaled $36,368 in 1996. The residents with the lowest annual per-person expenses were individuals admitted during the year who died or were discharged during the year.
 |
| Annual expense per resident |
| |
1987 |
1996 |
| Resident on 1/1, deceased by 12/31 |
$9,070 |
$17,517 |
| Resident entire year |
$19,755 |
$36,368 |
| Admitted and died during year |
$3,580 |
$9,457 |
| Admitted during year; resident on 12/31 |
$10,212 |
$23,005 |
| Resident on 1/1, discharged during year |
$7,238 |
$12,558 |
| Admitted and discharged during year |
$3,872 |
$8,569 |
|
Return To Table Of Contents
How do nursing home expenses vary by residents' institutional status?
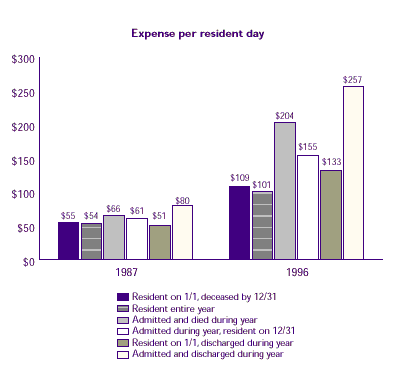
Annual expenses per resident day present a different pattern. In 1996, those with the shortest nursing home stays (individuals admitted during the year who died or were discharged during the year) had the highest annual expenses per resident day. For example, people admitted and discharged from the nursing home in 1996 had a high annual expense per resident day of $257 while having a low annual expense per resident of $8,569. The observed relationship is also consistent with such residents receiving nursing home services of a higher intensity, supported by the fact that those with the shortest nursing home stays relied most heavily on Medicare as a source of payment.
 |
| Annual expense per resident day |
| |
1987 |
1996 |
| Resident on 1/1, deceased by 12/31 |
$55 |
$109 |
| Resident entire year |
$54 |
$101 |
| Admitted and died during year |
$66 |
$204 |
| Admitted during year; resident on 12/31 |
$61 |
$155 |
| Resident on 1/1, discharged during year |
$51 |
$133 |
| Admitted and discharged during year |
$80 |
$257 |
|
Return To Table Of Contents
Do nursing home expenses vary by residents' income?
-
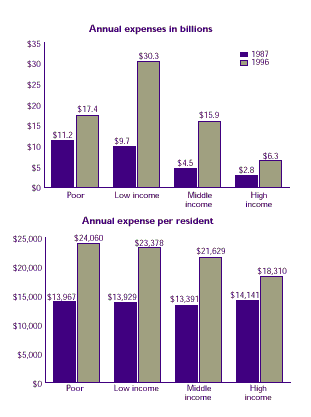
In 1987, total annual expenses were greatest for residents who were poor; in 1996, they were highest for residents in the low-income category.
-
In 1996, annual nursing home expenses per resident declined as income increased. The lowest annual expense per resident, $18,310, was for residents with the highest income.
-
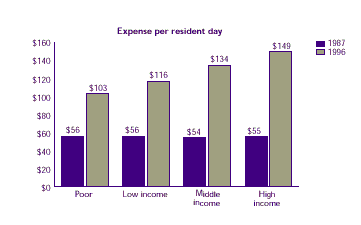
In 1996, annual expenses per resident day rose as income rose, from $103 for poor residents to $149 for high-income residents.
 |
| Annual expenses in billions |
| |
Poor |
Low income |
Middle income |
High Income |
| 1987 |
$11.2 |
$9.7 |
$4.5 |
$2.8 |
| 1996 |
$17.4 |
$30.3 |
$15.9 |
$6.3 |
|
| Annual expenses per resident |
| |
Poor |
Low income |
Middle income |
High Income |
| 1987 |
$13,967 |
$13,929 |
$13,391 |
$14,141 |
| 1996 |
$24,060 |
$23,378 |
$21,629 |
$18,310 |
|
Return To Table Of Contents
Do nursing home expenses vary by residents' income? (continued)
| Expense per resident day |
| |
Poor |
Low income |
Middle income |
High income |
| 1987 |
$56 |
$56 |
$54 |
$55 |
| 1996 |
$103 |
$116 |
$134 |
$149 |
Return To Table Of Contents
How does Medicare figure as a source of payment for residents with shorter stays?
People who were admitted and died during the year and those who were discharged during the year, especially in 1996, had Medicare as a major payer for nursing home care. In 1996, 54.7% of annual expenses for residents who were admitted and died during the year and 62.8% of expenses for residents who were admitted and discharged during the year were paid for by Medicare.
See the "Definitions of Terms" section for more information on the institutional status categories.
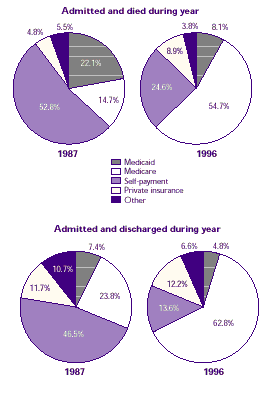
|
Admitted and died during year |
|
Medicaid |
Medicare |
Self- payment |
Private insurance |
Other |
1987 |
22.1% |
14.7% |
52.8% |
4.8% |
5.5% |
1996 |
8.1% |
54.7% |
24.6% |
8.9% |
3.8% |
|
Admitted and discharged during year |
|
Medicaid |
Medicare |
Self- payment |
Private insurance |
Other |
1987 |
7.4% |
23.8% |
46.5% |
11.7% |
10.7% |
1996 |
4.8% |
62.8% |
13.6% |
12.2% |
6.6% |
|
Return To Table Of Contents
What trends can be seen in Medicare payments for various income levels?
Residents with the highest income relied the most heavily on Medicare as a source of payment, indicating that they may have received the most concentrated nursing home services. Nursing home residents having care reimbursed by Medicare are the most likely to be recovering from conditions that require a greater intensity of service (Shaughnessy and Kramer, 1990).
The proportion of annual expenses per resident paid for by Medicare was markedly higher in 1996 than in 1987 for each income category, and the increase from 1987 to 1996 was greater with higher income.
The proportion of annual nursing home expenses per resident paid for by Medicaid (data not shown) fell for the two highest income categories.
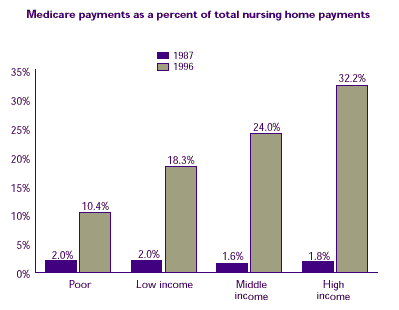
| Medicare payments as a percent of total nursing home payments |
| |
Poor |
Low income |
Middle income |
High income |
| 1987 |
2.0% |
2.0% |
1.6% |
1.8% |
| 1996 |
10.4% |
18.3% |
24.0% |
32.2% |
Return To Table Of Contents
Do nursing home expenses vary by whether residents own a home?
- In both 1987 and 1996, residents who did not own a home had higher annual nursing home expenses per resident than residents who did own a home. In 1996 only, residents who did not own a home had lower annual expenses per resident day than residents who did own a home. Non-homeowners tended to have longer lengths of stay than homeowners (data not shown) and possibly received care of a more custodial nature. This relationship appears to be more pronounced in 1996 than in 1987.
- From 1987 to 1996, annual expenses per resident day increased 141% for homeowners and 105% for non-homeowners. Annual expenses per resident increased by 39% for homeowners and by 69% for non-homeowners.
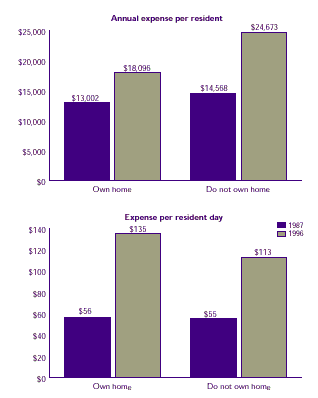 |
Annual expense per resident |
| |
Own home |
Do not own home |
| 1987 |
$13,002 |
$14,568 |
| 1996 |
$18,096 |
$24,673 |
|
Expense per resident day |
| |
Own home |
Do not own home |
| 1987 |
$56 |
$55 |
| 1996 |
$135 |
$113 |
|
Return To Table Of Contents
How do nursing home expenses vary by residents' Medicaid status?
- In 1987 and 1996, residents covered by Medicaid had higher annual nursing home expenses per resident but, at the same time, lower annual expenses per resident day, than residents not covered by Medicaid. This relationship appears to be more pronounced in 1996. Residents with Medicaid tended to have longer lengths of stay (data not shown).
- From 1987 to 1996, annual expenses per resident day increased 94% for those with Medicaid and 159% for those not covered by Medicaid. Annual expenses per resident increased for both groups, but they increased more for those with Medicaid (74%) than for those without Medicaid (53%).
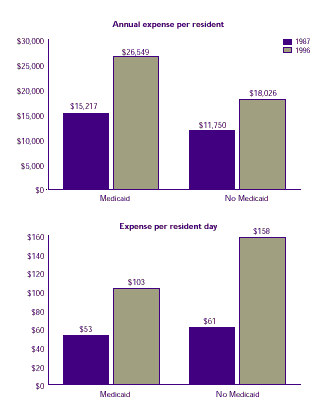 |
| Annual expense per resident |
| |
Medicaid |
No Medicaid |
| 1987 |
$15,217 |
$11,750 |
| 1996 |
26,549 |
$18,026 |
|
| Annual expense per resident day |
| |
Medicaid |
No Medicaid |
| 1987 |
$53 |
$61 |
| 1996 |
$103 |
$158 |
|
Return To Table Of Contents
What are the nursing home expenses for residents with different levels of functional disability?
Functional disability was measured by whether residents received help with activities of daily living (ADLs)—bathing, dressing, walking, transferring, feeding, and toileting. See the “Definitions of Terms” section for more information.
-
Residents with the most ADL limitations had the greatest total annual expenses in both 1987 and 1996.
-
The annual cost of nursing home care per resident was significantly greater in 1996 than in 1987 for all levels of functional disability, but not for residents with no ADL limitations.
-
In both 1987 and 1996, there was a general trend upward in annual expenses per resident day as the number of ADL limitations increased. However, in 1996, residents with no ADL limitations had expenses per resident day of $141, the highest of any category.
Return To Table Of Contents
What are the nursing home expenses for residents with different levels of functional disability? (continued)
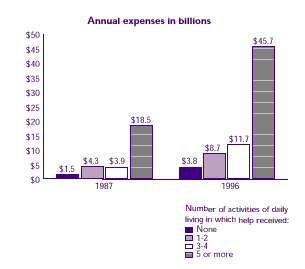 |
Annual expenses in billions
Number of activities of daily living in which help received: |
| |
None |
1 - 2 |
3 - 4 |
5 or more |
| 1987 |
$1.5 |
$4.3 |
$3.9 |
$18.5 |
| 1996 |
$3.8 |
$8.7 |
$11.7 |
$45.7 |
|
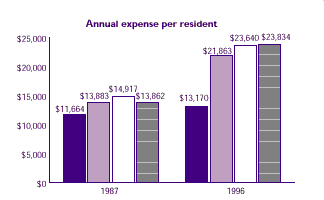 |
Annual expense per resident
Number of activities of daily living in which help received: |
| |
None |
1 - 2 |
3 - 4 |
5 or more |
| 1987 |
$11,664 |
$13,883 |
$14,917 |
$13,862 |
| 1996 |
$13,170 |
$21,863 |
$23,640 |
$23,834 |
|
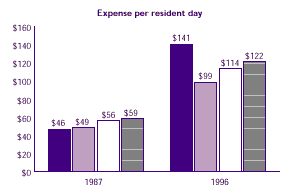 |
Expense per resident day
Number of activities of daily living in which help received: |
| |
None |
1 - 2 |
3 - 4 |
5 or more |
| 1987 |
$46 |
$49 |
$56 |
$59 |
| 1996 |
$141 |
$99 |
$114 |
$122 |
|
Return To Table Of Contents
Has the share of expenses paid by public funding changed for residents with different levels of functional disability?
Functional disability was measured by whether residents received help with activities of daily living (ADLs)—bathing, dressing, walking, transferring, feeding, and toileting. See the “Definitions of Terms” section for more information.
-
In 1996, residents with no ADLs tended to rely more heavily on Medicare and private insurance as sources of payment and less on Medicaid and self-payment when compared to residents with ADL limitations (private insurance and self-payment data not shown). This population was also more likely than the functionally disabled population to reside in hospital-based nursing homes as opposed to other types of nursing homes (data not shown).
-
Medicare paid a significant portion of the nursing home bill in 1996, although it played only a minor role in 1987. In particular, residents with no ADLs or with three or more ADLs had approximately one-fifth to one-quarter of their bill paid for by Medicare in 1996. The proportion of annual expenses per resident paid by Medicaid was generally relatively stable.
-
In both years Medicaid paid for approximately half of the expenses for all functional limitation categories with one exception. In 1996, Medicaid paid for only 29.1% of expenses for residents with no ADLs, a decrease from 43.6% in 1987.
Return To Table Of Contents
Has the share of expenses paid by public funding changed for residents with different levels of functional disability? (continued)
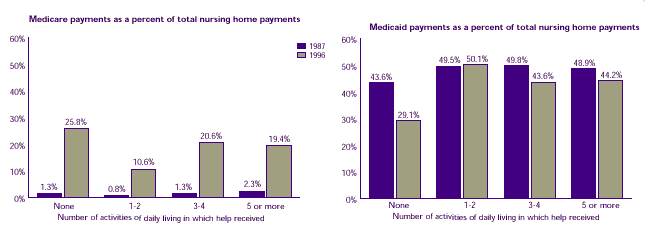 |
Medicare payments as a percent of total nursing home payments
Number of activities of daily living in which help received: |
| |
None |
1 - 2 |
3 - 4 |
5 or more |
| 1987 |
1.3% |
0.8% |
1.3% |
2.3% |
| 1996 |
25.8% |
10.6% |
20.6% |
19.4% |
|
Medicaid payments as a percent of total nursing home payments
Number of activities of daily living in which help received: |
| |
None |
1 - 2 |
3 - 4 |
5 or more |
| 1987 |
43.6% |
49.5% |
49.8% |
48.9% |
| 1996 |
29.1% |
50.1% |
43.6% |
44.2% |
|
Return To Table Of Contents
Do nursing home expenses vary by residents' mental health status?
-
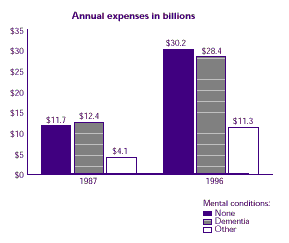
Total annual expenses for residents having either no mental conditions or dementia increased from 1987 to 1996. Residents with other mental conditions had the lowest total annual expenses for both years.
-
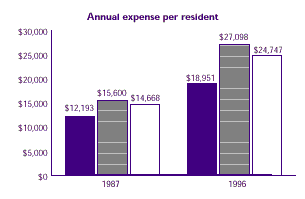
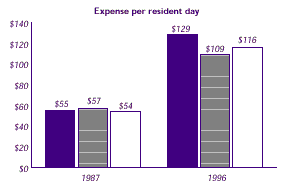
Annual expenses per resident increased by over $10,000 from 1987 to 1996 for both residents with dementia and those with other mental conditions, and annual expenses per resident day increased by approximately $55 for these two groups. While annual expenses per resident for those with no mental conditions increased by 55% (slightly less than $7,000), annual expenses per resident day for this group increased at a much higher rate, by more than 130% (almost $75).
-
Residents with no mental conditions had the lowest annual nursing home expenses per resident of any group for both years, but their 1996 annual expenses per resident day were the highest of any category in either year ($129). This relationship is consistent with such residents receiving nursing home services of a greater intensity than other residents.
Return To Table Of Contents
Do nursing home expenses vary by residents' mental health status? (continued)
 |
Annual expenses in billions
Mental conditions: |
| |
None |
Dementia |
Other |
| 1987 |
$11.7 |
$12.4 |
$4.1 |
| 1996 |
$30.2 |
$28.4 |
$11.3 |
|
 |
Annual expense per resident
Mental conditions: |
| |
None |
Dementia |
Other |
| 1987 |
$12,193 |
$15,600 |
$14,668 |
| 1996 |
$18,951 |
27,098 |
$24,747 |
|
 |
Expenses per resident day
Mental conditions: |
| |
None |
Dementia |
Other |
| 1987 |
$55 |
$57 |
$54 |
| 1996 |
$129 |
$109 |
$116 |
|
Return To Table Of Contents
Does the share of expenses paid by public funding vary by residents' mental health status?
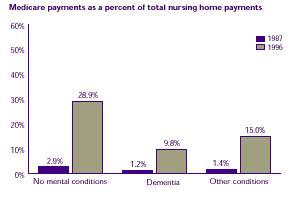
- In 1996, Medicare paid a greater portion (28.9%) of annual nursing home expenses per resident for those with no mental conditions than it paid for residents with dementia or other mental conditions in either year. Reimbursement by Medicare is indicative of nursing home residents who are more likely than those whose care is reimbursed by other sources to be recovering from conditions requiring a greater intensity of services: acute illness, trauma, or surgery (Shaughnessy and Kramer, 1990).
- The share of annual nursing home expenses that Medicaid paid for residents with no mental conditions declined from 45.2% in 1987 to 35.9% in 1996.
 |
Medicare payments as a percent of total nursing home payments
Mental conditions: |
| |
None |
Dementia |
Other conditions |
| 1987 |
2.9% |
1.2% |
1.4% |
| 1996 |
28.9% |
9.8% |
15.0% |
|
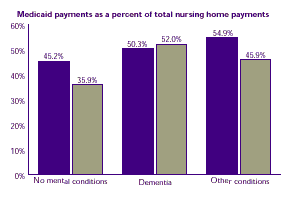 |
Medicaid payments as a percent of total nursing home payments
Mental conditions: |
| |
None |
Dementia |
Other conditions |
| 1987 |
45.2% |
50.3% |
54.9% |
| 1996 |
35.9% |
52.0% |
45.9% |
|
Return To Table Of Contents
Conclusions
The data presented in this report show the following:
- Total annual expenses increased by 150% from 1987 to 1996 ($28 billion to $70 billion) and annual expenses per resident day increased by a little over 111% ($56 to $118).
- The share of total annual nursing home expenses paid for by Medicare rose from 1.9% in 1987 to 18.9% in 1996.
- Annual expenses per resident day were greatest in hospital-based nursing homes and smaller nursing homes. Nursing homes in the Northeast and West had higher annual expenses per resident day than nursing homes in the South and Midwest in both 1987 and 1996.
- Minorities relied more heavily on public sources of funding for nursing home care than the group of whites and others did. Medicare increased as a source of funding for all ethnic and racial groups, especially Hispanics, in 1996.
- Residents with higher annual expenses per person tended to have lower annual expenses per resident day and longer lengths of stay. This may indicate that such residents received nursing home care of a lesser intensity, and of a more custodial nature, than other residents. These residents include women and residents who are not married, do not own a home, or are covered by Medicaid.
- Residents with no functional limitations and those with no mental conditions tended to have higher annual expenses per resident day and lower annual expenses per resident, as well as shorter lengths of stay. Such residents may have received a greater intensity and concentration of nursing home services than others did. Medicare was a major source of payment for these residents.
Return To Table Of Contents
References
Congressional Budget Office (US). Policy choices for long-term care. Washington: Congressional Budget Office; 1991.
Laliberte L, Mor V, Berg K, et al. Impact of the Medicare Catastrophic Coverage Act on nursing homes. The Milbank Quarterly 1997; 75(2):203-33.
Levit K, Lazenby H, Braden B, et al. National Health Expenditures, 1996. Health Care Financing Review 1997 Fall; 19(1):161-200.
Porter M, Witek J. The nursing home industry: past, present, and future. Topics in Health Care Finance 1991; 17(4):42-8.
Shaughnessy P, Kramer A. The increased needs of patients in nursing homes and patients receiving home health care. The New England Journal of Medicine 1990; 322(1):21-7.
Strahan B. Nursing home characteristics: preliminary data from the 1985 National Nursing Home Survey. Hyattsville (MD): National Center for Health Statistics, 1987. Advance Data From Vital and Health Statistics, No. 131. DHHS Pub. No. (PHS) 87-1250.
Strahan B. An overview of nursing homes and their current residents: data from the 1995 National Nursing Home Survey. Hyattsville (MD): National Center for Health Statistics, 1997. Advance Data From Vital and Health Statistics, No. 280. DHHS Pub. No. (PHS) 97-1250.
Please consult the MEPS Web site at
http://www.meps.ahrq.gov/
for an updated publications list or additional copies of this publication.
Return To Table Of Contents
Technical Notes
Note 1: Annual expenses per resident day increased 111% from 1987 to 1996. This increase from $56 to $118 represents an average annual increase of 8.6%. Annual price inflation accounts for 6.4 percentage points of the increase in annual expenses per resident day. According to the Bureau of Labor Statistics, the Medical Care Consumer Price Index for all urban consumers was 130.1 for 1987 and 228.2 for 1996, with the 36-month period between 1982 and 1984 serving as a baseline. The 2.2 percentage point difference between the rate of increase of annual expenses per resident day (8.6%) and the inflation rate (6.4%) over the same period may reflect, in part, an increase in the intensity and concentration of nursing home services delivered to residents. This is supported by the observation that while the number of residents increased by 53.7%, from 2.0 million in 1987 to 3.1 million in 1996 (and concurrently the population 65 and over increased 13.7%), the average length of stay declined by 23.0% (from 248 days to 191 days). At the same time, the number of hospital-based nursing home beds increased by 85.5%, and beds in freestanding nursing homes increased 8.0%. In 1996, daily expenses in hospital-based nursing homes were $212 and daily expenses in freestanding nursing homes were $111.
Note 2: The MEPS estimate of national expenses for services in nursing homes is $70 billion, considerably less than the $89 billion estimate for 1996 expenses from the National Health Expenditures (NHE) of the Health Care Financing Administration (HCFA). The NHE figure includes approximately $1.5 billion in nonpatient revenues, including philanthropic expenses, and $9 billion in Medicaid payments to intermediate care facilities for the mentally retarded (ICF-MR expenses). These are excluded from the MEPS estimate of nursing home expenses. Thus the NHE estimate most comparable to the MEPS estimate would be about $78.5 billion, or $8.5 billion more than the MEPS estimate.
One must consider the following as possible sources of the observed discrepancy in expenditure estimates.
- NHE estimates are facility-based estimates. If a facility is defined as providing nursing care, then all revenues/receipts to that facility are included in NHE expenditure estimates. Expenses for unlicensed nursing home beds (e.g., assisted living beds in an assisted living unit) that are contained within or associated with the nursing home might be included in NHE expenditure estimates. For MEPS, approximately 10% of beds contained within sampled nursing homes or associated with them as part of a larger facility were excluded from expenditure estimates because they were identified as unlicensed nursing home beds.
- The NHE estimates are more inclusive with respect to how a nursing home is defined. The following facilities were included in the NHE but not in MEPS: establishments primarily engaged in providing some (but not continuous) nursing and/or health-related care, such as convalescent homes with health care for psychiatric patients; convalescent homes with health care; domiciliary care with health care; personal care facilities with health care; personal care homes with health care; and rest homes with health care. NHE estimates do not provide expenditure totals for such facilities separately.
- MEPS excludes nursing homes with fewer than three beds, while NHE estimates have no limitation specifically related to the number of nursing home beds.
- MEPS estimates are based on 16,760 facilities, while NHE estimates are based on 18,600—an additional 1,840 facilities.
There are also differences in expense estimate methodology. The MEPS estimate of nursing home expenses is based on information obtained from the billing records of each facility used by a sampled person. Total expenses for each person and the amounts paid out of pocket and by third parties were obtained from these records.
HCFA-generated NHE estimates involve several steps:
- The Census Bureau collects information on State-level receipt/revenue for taxable and tax-exempt private nursing and personal care facilities from the 1992 Census of Service Industries.
- Expenses for 1996 are then generated from the 1992 data by applying the Census Bureau’s estimated annual growth in taxable and tax-exempt receipts/revenues for nursing and personal care facilities. The Census estimate is based on data obtained from the Service Annual Survey.
- An estimate of expenses for government facilities is added to the estimated expenses for private facilities. Expenses for government facilities were estimated from Bureau of Labor Statistics wage data for government nursing homes. Government nursing home wages were inflated to revenues based on wage-to-revenue ratios for private nursing homes that were developed from data collected by the National Center for Health Statistics in the 1977 National Nursing Home Survey.
Note 3: “Other” sources of payment for 1987 are Supplemental Security Income, Department of Veterans Affairs, other State or local governments, and charity. “Other” sources of payment for 1996 consist of Department of Veterans Affairs, health maintenance organization contracts, and others.
Note 4: There are several possible reasons for the observed shift in the major sources of payment for total annual nursing home expenses from 1987 to 1996 (almost a 900% increase in Medicare). The Medicare Catastrophic Coverage Act (MCCA) of 1988 (later repealed) altered eligibility and coverage for skilled nursing facility (SNF) care. The relaxed SNF eligibility criteria clearly allowed for a substantial increase in Medicare coverage of nursing home care. Other factors may have contributed to Medicare’s increased role in financing nursing home care beyond the MCCA period. First, the 1988 clarification of the definition of skilled care under the Medicare SNF benefit may have resulted in more covered services and fewer payment denials by fiscal intermediaries. Second, the 1987 Omnibus Budget Reconciliation Act (OBRA) mandated assessments of residents, which went into effect in 1990, and required that SNFs provide services to maintain the “highest practicable level of physical, mental, and psycho-social well-being” for residents. The mandated Resident Assessment System may have helped facilities to better document Medicare SNF eligibility and to increase the number of resident days for which they received Medicare reimbursement. Third, OBRA also equalized staffing requirements for Medicare and Medicaid. This eliminated the incentive to remain a Medicaid-only nursing facility because the same conditions of participation applied to both programs, providing a catalyst for bringing more Medicare SNFs into the market. Fourth, nursing homes, having geared up to provide Medicare services to a larger proportion of residents because of the MCCA, may have had an incentive to continue providing those services even after its repeal. Finally, these data may reflect what has been described as an increase in the number of individuals requiring subacute and post-acute treatment settings in response to hospitals’ continuing efforts to reduce length of stay (Laliberte, Mor, Berg, et al., 1997).
Return To Table Of Contents
Definitions of Terms
Expenses
Expenses for nursing home care refer to payments received for both basic services (room and board) and ancillary services (special supplies and services). Total annual expenses are the sum of all sources of payment received from or on behalf of individuals who resided in a nursing home for at least 1 day during 1987 or 1996.
Annual expenses per resident are derived by dividing total annual nursing home expenses by the total number of nursing home residents. For example, annual expenses per resident of $22,561 in 1996 were derived (using unrounded values) by dividing the approximately $70 billion in total annual expenses by the approximately 3.1 million total number of nursing home residents for 1996.
Annual expenses per resident day were derived by dividing total annual expenses by the total number of resident days. For example, annual expenses per resident day of $118 in 1996 were derived by dividing the approximately $70 billion in total annual expenses by approximately 592 million resident days.
Self-payment refers to total out-of-pocket payments made by nursing home residents or their families.
Return To Table Of Contents
Type of nursing home
Freestanding nursing homes consist of nursing homes with only nursing home beds. Nursing homes with multiple levels of care include continuing care retirement communities and retirement centers that have independent living and/or personal care units in addition to nursing home beds.
Hospital-based nursing homes are nursing homes that are part of a hospital or are a hospital-based Medicare skilled nursing facility.
Institutional status
Institutional status consists of six mutually exclusive groups:
- Sample persons residing in the nursing home at midnight December 31, 1986 or 1995 who died by December 31, 1987 or 1996, respectively.
- Sample persons residing in the nursing home at midnight December 31, 1986 or 1995 who remained in the nursing home the entire year other than for short-term hospital stays.
- Sample persons residing in the nursing home at midnight December 31, 1986 or 1995 who were discharged from the nursing home during 1987 or 1996, respectively.
- Sample persons admitted to the nursing home during either 1987 or 1996 who died by December 31, 1987 or 1996, respectively.
- Sample persons admitted to the nursing home during either 1987 or 1996 who remained in the nursing home for the remainder of the year other than for short-term hospital stays.
- Sample persons admitted to the nursing home during either 1987 or 1996 who were discharged from the nursing home during 1987 or 1996, respectively.
Return To Table Of Contents
Income
- Poverty status is the ratio of family income to Federal poverty thresholds, which vary by family size and age of the head of the family. The categories are:
- Poor—This category refers to persons in families with income less than 100% of the poverty line.
- Low income—This category includes persons in families with income from 100% through 199% of the poverty line.
- Middle income—This category includes persons in families with income from 200% through 399% of the poverty line.
- High income—This category includes persons in families with income of 400% of the poverty line or more.
Activities of Daily Living
Functional disability was measured by whether residents received help with activities of daily living (ADLs)—bathing, dressing, walking, transferring, feeding, and toileting.
When it was reported that an ADL did not occur (e.g., the resident was unable to perform the activity of daily living or was comatose), residents were classified as receiving assistance with the activity. In order to be classified as independent in toileting, residents who used wheelchairs had to be able to transfer independently and those who did not use wheelchairs had to be independently mobile.
Return To Table Of Contents
| Suggested Citation: Chartbook #6: Nursing Home Expenses, 1987 and 1996. August 2001. Agency for Healthcare Research and Quality, Rockville, MD.
http://www.meps.ahrq.gov/data_files/publications/cb6/cb6.shtml
|
|
