Chartbook #7:
State Differences in Job-Related Health Insurance, 1998
By James M. Branscome, M.S., Erwin Brown, Jr., B.S.
Contents
The estimates in this report are based on the most recent data available from MEPS at the time the report was written. However, selected elements of MEPS data may be revised on the basis of additional analyses, which could result in slightly different estimates from those shown here. Please check the MEPS Web site for the most current file releases — www.meps.ahrq.gov
Return To Table Of Contents
Definitions of Terms Used in This Chartbook
Establishment—A particular workplace or location.
Firm—A company or business. A firm can have many establishments or only one.
Small firm—A firm with fewer than 50 employees.
Large firm—A firm with 50 or more employees.
Single coverage—Health insurance that covers the employee only.
Family coverage—Health insurance that covers the employee and the employee’s family. If a plan offers more than one arrangement for family coverage, premium information for a family of four is used.
Total premium—Total amount paid for insurance, consisting of contributions by both the employee and employer.
Conventional indemnity plan—A type of health insurance plan that allows the enrollee the choice of any provider without effect on reimbursement. These plans reimburse the patient and/or provider as expenses are incurred. The plan does not have a specific network of health insurance providers associated with it.
Managed care plan—A type of health insurance plan that generally provides comprehensive health services to its enrollees and offers financial incentives for patients to use the providers who belong to the plan. Managed care plans include both exclusive provider plans and preferred provider plans.
Exclusive provider plan—A managed care plan, such as a health maintenance organization, in which enrollees must use providers from the specified network of physicians and hospitals to receive coverage; there is no coverage for care received from a non-network provider, except in an emergency.
Preferred provider plan—A managed care plan, such as a preferred provider organization, where coverage is provided to enrollees through a network of selected health care providers (such as hospitals and physicians). The enrollees may go outside the network, but they would pay a greater percentage of the cost of the coverage than if they stayed within the network.
Level of significance—States where the estimates are statistically significantly different from the national average at the 0.05 level are noted with a star on the maps. The alpha level of 0.05 is based on simultaneously testing whether each State is different from the national average.
Return To Table Of Contents
Executive Summary
This report presents estimates of workers’ access to job-related health insurance, the cost of that insurance, and the choice of plans available to workers in 1998. (See Note 1.) Key findings include:
Access
Establishments in Hawaii were the most likely to offer job-related insurance to at least some of their employees. State law in Hawaii mandates that employers offer health insurance and pay for at least half of the premium for most workers. (See Note 2.)
In every State, establishments in large firms were more likely to offer health insurance than those in small firms. Differences in health insurance offer rates between the States are driven primarily by offer rates in small firms in those States.
Establishments in Alaska, Idaho, Wyoming, Arkansas, Mississippi, Oklahoma, Nebraska, Louisiana, New Mexico, and Texas were the least likely to offer insurance to their employees.
Cost
The national average premium was $2,174 for single coverage and $5,590 for family coverage.
For both single and family coverage, total premiums were highest in the Northeastern United States. Premiums tended to be lowest in the South and Midwest.
Employees in Massachusetts made the highest contributions for single coverage. For family coverage, the highest contributions were made by employees in the District of Columbia, Florida, and Texas.
Choice
Approximately 68% of establishments in the Nation offered workers only one plan. Establishments in California and Hawaii were the most likely to offer a choice of health insurance plans to their employees.
Conventional indemnity plans were most common in Wyoming, Alaska, and Idaho. Managed care plans do not have a strong presence in these States.
In general, exclusive provider health insurance plans (such as health maintenance organizations) were most commonly offered in the Northeast and on the West coast. Preferred provider plans (such as preferred provider organizations) were more frequently offered in the South and Midwest.
Return To Table Of Contents
Introduction
Employer-sponsored health insurance is the primary source of health insurance for most Americans. While enrollment in public health insurance programs has increased from 1987 to 1998, job-related coverage remains the most crucial aspect of insurance coverage for Americans today. Job-related coverage can vary significantly based on employer characteristics such as type of industry, length of time in business, number of full- and part-time workers, salary levels of the workers, and the physical location of the establishment—the last of which is the focus of this report.
Employer-sponsored coverage varies significantly across States, so data on trends in coverage at the State level are critical to understanding who is and who is not covered by employer sponsored health insurance. In recent years, States have been increasingly active in crafting policies for their residents who lack health insurance coverage. In the early 1990s, most States established reforms to encourage more small firms to offer insurance to their workers. At the same time, States expanded Medicaid’s eligibility thresholds. In 1997, Congress enacted the State Children’s Health Insurance Program (SCHIP), which gave States the funding and flexibility to extend public insurance coverage to more uninsured children. This report addresses three key aspects of State differences in employer-sponsored health insurance.
The first section looks at workers’ access to job-related health insurance. The cost of insurance, which may be a factor in whether employers offer coverage and whether workers accept it, is examined in the second section. Finally, the report presents data on the choice of plans offered to employees.
Return To Table Of Contents
Data in this Report
The data in this report come from the private-sector sample of the Medical Expenditure Panel Survey Insurance Component (MEPS IC), conducted for the Agency for Healthcare Research and Quality by the U.S. Census Bureau. The MEPS IC is an annual survey with more than 29,000 responding private-sector establishments and State and local governmental units. It provides estimates of job-related insurance both at the national level and at the State level for 40 States in any given year. The data shown in this chartbook refer exclusively to the 27,000 responding private-sector establishments and are drawn from more detailed tables that appear on the MEPS Web site.
The MEPS IC is an annual survey, but State-level estimates cannot be produced in every State for every survey year because of budget constraints. Although data are collected in each State each year in order to make a reliable national estimate, sample sizes in States with smaller populations can support State-level estimates only in years when their samples are specifically increased for that purpose. The survey began in 1996 and produced estimates that year for the 40 States with the largest populations. In 1997, the MEPS IC sample started a rotation of the 20 least populated States so that every State would have an adequate sample size to make State-level estimates at least once every 4 years.
The following States do not have estimates for 1998: Alaska, the District of Columbia (which is treated by the MEPS IC survey as a State), Hawaii, Maine, Mississippi, Montana, Nevada, North Dakota, Rhode Island, South Dakota, and Vermont. However, in order to provide the most current information available, 1997 State-level estimates for the District of Columbia, Alaska, Hawaii, Maine, Mississippi, Nevada, and Rhode Island are included in this chartbook. For analytical consistency, the maps show the 1997 estimates for these States in comparison to the 1997 national estimates, not 1998. For example, the percentage of establishments offering health insurance in Rhode Island in 1997 (54.0%) was slightly above the 1997 national average (52.4%). In 1998, the national average increased to 55.2%. However, the map will show Rhode Island as being above the national average because it was above the national average in 1997.
There are no State-level estimates from previous survey years for the four remaining States—Montana, North Dakota, South Dakota, and Vermont. The MEPS IC survey for 1999 will provide estimates for Montana and Vermont, and the 2000 survey will provide estimates for North and South Dakota. For each map, the 47 States for which estimates are available (40 States with 1998 estimates and 7 States with 1997 estimates) are classified based on whether they are at or above the national average or below the national average. They are shaded accordingly. States where the estimates are statistically significantly different from the national average at the 0.05 level are noted with a star. For statistical purposes, these significance tests are performed on all 47 States at the same time. (See Note 3.)
Unless otherwise noted, only differences that are statistically significant at the 0.05 level are discussed in the text. When a State is described as having one of the highest or lowest rates, this means that it is significantly above or below the national average, but not necessarily that it is significantly different from other States. For example, New York had the highest average family premium ($6,453) in 1998. While this is statistically different from the national average ($5,590), it is not statistically larger than the average family premiums for a number of other States, such as Connecticut ($6,380), New Jersey ($6,332), and New Hampshire ($6,185). However, one could say that New York had the highest family premiums for job-based health insurance.
It is also important to note that differences among States in the size of the standard errors for estimates can result in what appear to be inconsistent results. For example, Alaska has the highest single yearly premium ($2,558), but this premium is not significantly above the national average of $2,174 because of the large standard error for the Alaska estimate ($217). However, the District of Columbia, with a yearly single premium of $2,455, is significantly above the national average because it has a much smaller standard error ($45) than Alaska, even though the District of Columbia estimate is smaller than the Alaska estimate.
All comparisons made in this chartbook are between State and national estimates. This is the second MEPS Chartbook to present State-level data on job-related health insurance. The first—MEPS Chartbook Number 4: “State Differences in Job-Related Health Insurance, 1996,” by Peterson and Vistnes—was based on the initial set of 1996 MEPS IC tables. Subsequent to the publication of that chartbook, the 1996 tables were expanded and revised based on:
- Improved imputation methods that used additional data collected during the second year of the survey.
- Modifications of the weighting methodology to better control for known industry totals.
- Availability from the Census Bureau’s Standard Statistical Establishment List of more precise values for firm size for the time period covered.
The general findings presented in that first chartbook are still valid, but many of the percentages reported changed slightly between the preliminary and final tables. Unlike the first chartbook, all references to 1996 data in this report specifically pertain to estimates from the final 1996 tables.
The premium data in MEPS do not assume a standardized package of benefits for all health insurance plans. Because plans offer various benefits, higher premiums in a State may indicate that the plans in that State offer more generous benefits. The variations in premiums by State also may reflect differences in medical costs, enrollment patterns, State regulations, and plan types.
In this report, “establishment” refers to a particular workplace or location. “Firm” refers to a company or business. A firm can have many establishments or only one. “Single coverage” refers to insurance that covers only the employee. “Family coverage” is for the employee and the employee’s family. If a plan offers more than one arrangement for family coverage, the survey asks for premium information for a family of four.
Specific sources for additional information presented in the discussion are listed in the references section. Besides the Insurance Component, MEPS includes components on households, medical providers, and nursing homes. With all of its components, MEPS is a nationally representative group of surveys that collect detailed information on health status, health care use and expenses, and health insurance coverage of individuals and families in the United States.
Return To Table Of Contents
Section 1: Access
Job-related health insurance plays a critical role in covering American workers and their families. Yet many workers may not receive needed medical care and are exposed to catastrophic financial risks because they do not have access to such coverage. In fact, among working-age Americans who are uninsured, more than two thirds are employed (Vistnes and Monheit, 1997).
In which States are establishments most likely to offer health insurance to their workers?
-
Establishments were most likely to offer insurance to at least some of their employees in Hawaii (83.3%), where employers are mandated by State law to offer coverage to most workers. (See Note 2.)
-
The other States where establishments were most likely to offer health insurance were the District of Columbia (73.7%), New Hampshire (66.1%), Massachusetts 63.9%), and Pennsylvania (63.3%).
-
Ten States were significantly below the national average for establishments offering health insurance. They were Alaska 42.2%), Idaho (42.4%), Wyoming 44.1%), Arkansas (44.4%), Mississippi (45.3%), Oklahoma 46.0%), Nebraska (46.2%), Louisiana (46.8%), New Mexico 47.5%), and Texas (49.6%).
-
Nationally, the percentage of establishments offering health insurance was 55.2% in 1998, up from 52.4% in 1997.
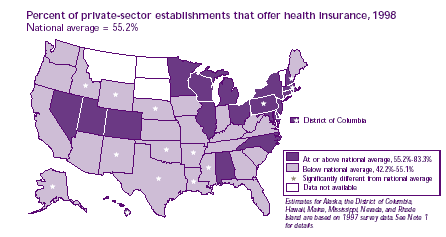
| Percent of private-sector establishments that offer health insurance, 1998 |
States |
At or above national average, 55.2%-83.3% |
Alabama, Colorado, Connecticut, Delaware, Illinois, Maryland, Michigan, Minnesota, Nevada, New Jersey, New York, North Carolina, Ohio, Rhode Island, Utah, Wisconsin |
| At or above national average, 55.2%-83.3% and Significantly different from national average |
District of Columbia, Hawaii, Massachusetts, New Hampshire, Pennsylvania |
| Below national average, 42.2%-55.1% |
Arizona, California, Georgia, Florida, Indiana, Iowa, Kansas, Kentucky, Maine, Missouri, Oregon, South Carolina, Tennessee, Virginia, Washington, West Virginia |
| Below national average, 42.2%-55.1% and Significantly different from national average |
Alaska, Arkansas, Idaho, Louisiana, Mississippi, Nebraska, New Mexico, Oklahoma, Texas, Wyoming |
| Data not available |
Montana, North Dakota, South Dakota, Vermont |
| Estimates for Alaska, the District of Columbia, Hawaii, Maine, Mississippi, Nevada, and Rhode Island are based on 1997 survey data. See Note 1 for details. |
Return To Table Of Contents
Are large-firm establishments more likely to offer health insurance?
- In every State, establishments that were part of large firms (50 or more employees) were more likely than those in small firms to offer health insurance.
- Most of the State differences in health insurance offer rates occur in small firms (fewer than 50 employees).
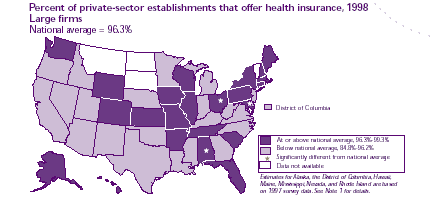
| Percent of private-sector establishments that offer health insurance, 1998 Large firms |
States |
At or above national average, 96.3%-99.3% |
Alaska, Arkansas, Colorado, Connecticut, Florida, Hawaii, Illinois, Kansas, Iowa, Maine, Massachusetts, Missouri, New Hampshire, New York, Pennsylvania, Rhode Island, South Carolina, Tennessee, Washington, Wisconsin, Wyoming |
| At or above national average, 96.3%-99.3% and Significantly different from national average |
Alabama, Maryland, Ohio |
| Below national average, 84.8%-96.2% |
Arizona, California, Delaware, District of Columbia, Georgia, Idaho, Indiana, Kentucky, Louisiana, Michigan, Minnesota, Mississippi, Nebraska, Nevada, New Jersey, New Mexico, North Carolina, Oklahoma, Oregon, Texas, Utah, Virginia, West Virginia |
| Below national average, 84.8%-96.2% and Significantly different from national average |
|
| Data not available |
Montana, North Dakota, South Dakota, Vermont |
| Estimates for Alaska, the District of Columbia, Hawaii, Maine, Mississippi, Nevada, and Rhode Island are based on 1997 survey data. See Note 1 for details. |
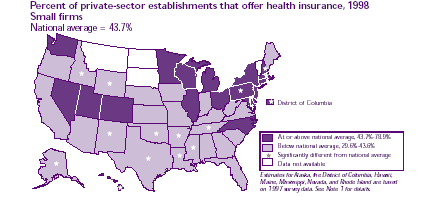
| Percent of private-sector establishments that offer health insurance, 1998 Small firms |
States |
At or above national average, 43.7%-78.9% |
Colorado, Connecticut, Delaware, Illinois, Maryland, Michigan, Minnesota, Nevada, New Jersey, New York, North Carolina, Ohio, Rhode Island, Utah, Washington, Wisconsin |
| At or above national average, 43.7%-78.9% and Significantly different from national average |
District of Columbia, Hawaii, Massachusetts, New Hampshire, Pennsylvania |
| Below national average, 29.6%-43.6% |
Alabama, Arizona, California, Florida, Georgia, Indiana, Iowa, Kansas, Kentucky, Maine, Missouri, Nebraska, Oregon, South Carolina, Virginia, West Virginia |
| Below national average, 29.6%-43.6% and Significantly different from national average |
Alaska, Arkansas, Idaho, Louisiana, Mississippi, New Mexico, Oklahoma, Tennessee, Texas, Wyoming |
| Data not available |
Montana, North Dakota, South Dakota, Vermont |
| Estimates for Alaska, the District of Columbia, Hawaii, Maine, Mississippi, Nevada, and Rhode Island are based on 1997 survey data. See Note 1 for details. |
Return To Table Of Contents
When health insurance is offered at the workplace, does the likelihood that workers will be eligible for coverage vary by State?
When an establishment offers insurance, not all of its workers may be eligible for coverage. Part-time employees may be ineligible. New employees may be excluded until they have completed a waiting period. Workers with pre-existing conditions may not be eligible for coverage immediately. (See Note 4.)
- Employees in establishments offering insurance were most likely to be eligible for coverage in the District of Columbia (86.4%). None of the other States were significantly different from the national average.
- Nationwide, the percent of employees eligible for insurance in establishments that offer health insurance has decreased from 81.3% in 1996 to 77.6% in 1998.
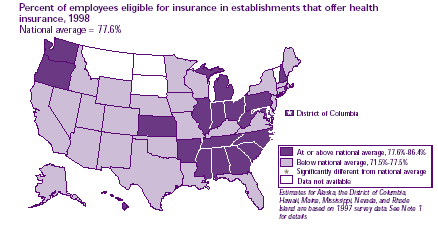
| Percent of employees eligible for insurance establishments that offer health insurance, 1998 |
States |
At or above national average, 77.6%-86.4% |
Alabama, Arkansas, Georgia, Hawaii, Illinois, Indiana, Kansas, Maryland, Michigan, Mississippi, New Hampshire, North Carolina, Ohio, Oregon, Pennsylvania, Rhode Island, South Carolina, Tennessee, Washington, West Virginia |
| At or above national average, 77.6%-86.4% and Significantly different from national average |
District of Columbia |
| Below national average, 71.5%-77.5% |
Alaska, Arizona, California, Colorado, Connecticut, Delaware, Florida, Idaho, Iowa, Kentucky, Louisiana, Maine, Massachusetts, Minnesota, Missouri, Nebraska, Nevada, New Jersey, New Mexico, New York, Oklahoma, Texas, Utah, Virginia, Wisconsin, Wyoming |
| Below national average, 71.5%-77.5% and Significantly different from national average |
|
| Data not available |
Montana, North Dakota, South Dakota, Vermont |
| Estimates for Alaska, the District of Columbia, Hawaii, Maine, Mississippi, Nevada, and Rhode Island are based on 1997 survey data. See Note 1 for details. |
Return To Table Of Contents
Are full-time employees more likely than part-time employees to be eligible for coverage?
- The difference in eligibility between full-time and part-time employees was significant in every State.
- The gaps in the eligibility rates between full- and part-time employees were smallest in Hawaii (92.0% for full-time, 51.5% for part-time) and Tennessee (85.2% for full-time, 44.7% for part-time), although these differences were still significant.
- The gaps were greatest in Mississippi, Arkansas, and Alaska, where the differences in eligibility rates between full- and part-time employees were 75.3, 70.5, and 70.0 percentage points, respectively.
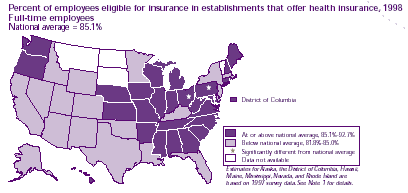
| Percent of employees eligible for insurance in establishments that offer health insurance, 1998 Full-time employees |
States |
At or above national average, 85.1%-92.7% |
Alabama, Arkansas, Connecticut, District of Columbia, Georgia, Illinois, Indiana, Iowa, Kansas, Maine, Maryland, Michigan, Mississippi, Missouri, Nebraska, New Hampshire, North Carolina, Oregon, Rhode Island, South Carolina, Tennessee, Virginia, Washington, West Virginia, Wisconsin |
| At or above national average, 85.1%-92.7% and Significantly different from national average |
Hawaii, Ohio, Pennsylvania |
| Below national average, 81.8%-85.0% |
Alaska, Arizona, California, Colorado, Delaware, Florida, Idaho, Kentucky, Louisiana, Massachusetts, Minnesota, Nevada, New Jersey, New Mexico, New York, Oklahoma, Texas, Utah, Wyoming |
| Below national average, 81.8%-85.0% and Significantly different from national average |
|
| Data not available |
Montana, North Dakota, South Dakota, Vermont |
| Estimates for Alaska, the District of Columbia, Hawaii, Maine, Mississippi, Nevada, and Rhode Island are based on 1997 survey data. See Note 1 for details. |
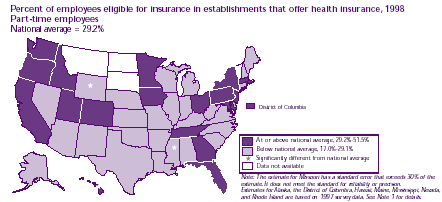
| Percent of employees eligible for insurance in establishments that offer health insurance, 1998 Part-time employees |
States |
At or above national average, 29.2%-51.5% |
California, Colorado, District of Columbia, Florida, Georgia, Hawaii, Idaho, Iowa, Maryland, Massachusetts, Minnesota, New Jersey, New York, Ohio, Oregon, Pennsylvania, Rhode Island, Tennessee, Utah, Washington |
| At or above national average, 29.2%-51.5% and Significantly different from national average |
|
| Below national average, 17.0%-29.1% |
Alabama, Alaska, Arizona, Arkansas, Connecticut, Delaware, Illinois, Indiana, Kansas, Kentucky, Louisiana, Maine, Michigan, Missouri, Nebraska, Nevada, New Hampshire, New Mexico, North Carolina, Oklahoma, South Carolina, Texas, Virginia, West Virginia, Wisconsin |
| Below national average, 17.0%-29.1% and Significantly different from national average |
Mississippi, Wyoming |
| Data not available |
Montana, North Dakota, South Dakota, Vermont |
| Estimates for Alaska, the District of Columbia, Hawaii, Maine, Mississippi, Nevada, and Rhode Island are based on 1997 survey data. See Note 1 for details. |
Return To Table Of Contents
In which States are workers who are eligible for coverage most likely to enroll?
Even when workers were eligible for job-related health insurance, they may not have chosen to enroll. A common reason for not enrolling was that they were already covered through their spouse’s employer. Others did not sign up because they felt that the amount that they would have paid for coverage was too expensive or they believed that they did not need health insurance.
- Among workers eligible for coverage through their job, those in Washington were the most likely to enroll (89.8%).
- Enrollment rates were significantly below the national average in New Mexico (80.0%), Massachusetts (79.8%), and Utah (71.9%).
-
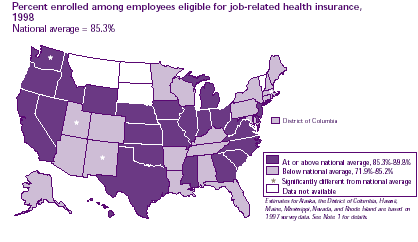
| Percent enrolled among employees eligible for job-related health insurance, 1998 |
States |
At or above national average, 85.3%-89.8% |
California, Delaware, Georgia, Hawaii, Idaho, Illinois, Indiana, Iowa, Kansas, Michigan, Mississippi, Missouri, Nebraska, Nevada, New Jersey, North Carolina, Ohio, Oklahoma, Oregon, South Carolina, Texas, Virginia, West Virginia, Wyoming |
| At or above national average, 85.3%-89.8% and Significantly different from national average |
Washington |
| Below national average, 71.9%-85.2% |
Alabama, Alaska, Arizona, Arkansas, Colorado, Connecticut, District of Columbia, Florida, Kentucky, Louisiana, Maine, Maryland, Minnesota, New Hampshire, New York, Pennsylvania, Rhode Island, Tennessee, Wisconsin |
| Below national average, 71.9%-85.2% and Significantly different from national average |
Massachusetts, New Mexico, Utah |
| Data not available |
Montana, North Dakota, South Dakota, Vermont |
| Estimates for Alaska, the District of Columbia, Hawaii, Maine, Mississippi, Nevada, and Rhode Island are based on 1997 survey data. See Note 1 for details. |
Return To Table Of Contents
Are employees in small firms less likely to enroll?
There was a significant disparity in enrollment rates between large and small firms in 14 States. In all of these cases, the enrollment rates were higher in the large firms than in the small firms.
Enrollment rates in small firms were significantly above the national average in West Virginia (92.3%), South Carolina (86.4%), Washington (86.4%), and California (84.5%).
Small firm enrollment rates were lowest in New Mexico (72.8%), Massachusetts (70.8%), Wisconsin (70.2%), and Utah (57.2%).
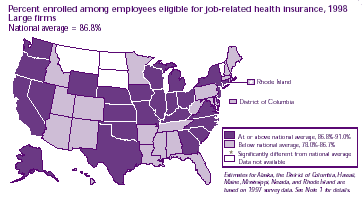
| Percent enrolled among employees eligible for job-related health insurance, 1998 Large firms |
States |
At or above national average, 86.8%-91.0% |
Alaska, California, Connecticut, Delaware, Georgia, Illinois, Indiana, Iowa, Kansas, Kentucky, Michigan, Missouri, Nebraska, Nevada, New Jersey, New York, North Carolina, Ohio, Oklahoma, Oregon, South Carolina, Texas, Virginia, Washington, Wisconsin, Wyoming, |
| At or above national average, 86.8%-91.0% and Significantly different from national average |
|
| Below national average, 78.0%-86.7% |
Alabama, Arizona, Arkansas, Colorado, District of Columbia, Florida, Hawaii, Idaho, Louisiana, Maine, Maryland, Massachusetts, Minnesota, Mississippi, New Hampshire, New Mexico, Pennsylvania, Tennessee, Utah, West Virginia |
| Below national average, 78.0%-86.7% and Significantly different from national average |
Rhode Island |
| Data not available |
Montana, North Dakota, South Dakota, Vermont |
| Estimates for Alaska, the District of Columbia, Hawaii, Maine, Mississippi, Nevada, and Rhode Island are based on 1997 survey data. See Note 1 for details. |
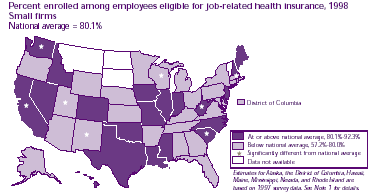
| Percent enrolled among employees eligible for job-related health insurance, 1998 Small firms |
States |
At or above national average, 80.1%-92.3% |
Colorado, Delaware, Hawaii, Idaho, Illinois, Indiana, Iowa, Louisiana, Maine, Mississippi, Missouri, Nevada, New Hampshire, New Jersey, North Carolina, Oklahoma, Texas |
| At or above national average, 80.1%-92.3% and Significantly different from national average |
California, South Carolina, Washington, West Virginia |
| Below national average, 57.2%-80.0% |
Alabama, Alaska, Arizona, Arkansas, Connecticut, District of Columbia, Florida, Georgia, Kansas, Kentucky, Maryland, Michigan, Minnesota, Nebraska, New York, Ohio, Oregon, Pennsylvania, Rhode Island, Tennessee, Virginia, Wyoming |
| Below national average, 57.2%-80.0% and Significantly different from national average |
Massachusetts, New Mexico, Utah, Wisconsin |
| Data not available |
Montana, North Dakota, South Dakota, Vermont |
| Estimates for Alaska, the District of Columbia, Hawaii, Maine, Mississippi, Nevada, and Rhode Island are based on 1997 survey data. See Note 1 for details. |
Return To Table Of Contents
Section 2: Cost
Many employers may not offer health insurance because of the cost of premiums. Even when they do offer coverage, the portion of the premium that workers must pay may place such coverage out of reach for many Americans.
Does the average total health insurance premium for single coverage vary by State?
The total health insurance premium for job-related coverage consists of contributions by both the employer and the employee. Variations in premiums by State reflect differences in medical costs, enrollment patterns, State regulations, and the generosity of health plan benefits and plan types.
- Premiums were higher than the national average in the District of Columbia ($2,455), Massachusetts ($2,392), New Hampshire ($2,356), and Rhode Island ($2,254).
- Premiums were below the national average in South Carolina ($2,070), Kentucky ($1,990), and Iowa ($1,941).
- Nationally, the average yearly premium for single coverage increased 3.0% from 1996 to 1997 and 6.0% from 1997 to 1998. The average yearly single premium was $1,992 in 1996, $2,051 in 1997, and $2,174 in 1998.
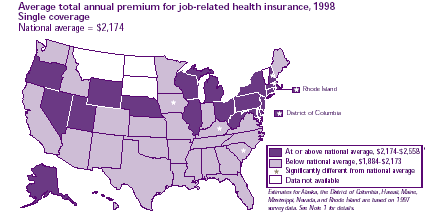
| Average total annual premium for job-related health insurance, 1998 Single coverage |
States |
At or above national average, $2,174-$2,558 |
Alaska, Connecticut, Delaware, Illinois, Maryland, Michigan, Nebraska, Nevada, New Jersey, New York, Ohio, Oregon, Pennsylvania, Utah, West Virginia, Wisconsin, Wyoming |
| At or above national average, $2,174-$2,558 and Significantly different from national average |
District of Columbia, Massachusetts, New Hampshire, Rhode Island |
| Below national average, $1,884-$2,173 |
Alabama, Arizona, Arkansas, California, Colorado, Florida, Georgia, Hawaii, Idaho, Indiana, Kansas, Louisiana, Maine, Minnesota, Mississippi, Missouri, New Mexico, North Carolina, Oklahoma, Tennessee, Texas, Virginia, Washington |
| Below national average, $1,884-$2,173 and Significantly different from national average |
Iowa, Kentucky, South Carolina |
| Data not available |
Montana, North Dakota, South Dakota, Vermont |
| Estimates for Alaska, the District of Columbia, Hawaii, Maine, Mississippi, Nevada, and Rhode Island are based on 1997 survey data. See Note 1 for details. |
Return To Table Of Contents
Where do workers pay the least for single coverage?
- Employee contributions were lowest in Hawaii ($125), Oregon ($198), Nevada ($215), Washington ($221), Idaho ($282), and Pennsylvania ($289).
- Massachusetts was the only State with an employee contribution ($531) significantly higher than the national average of $383.
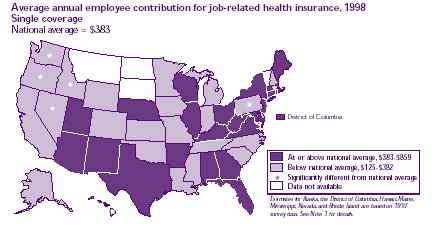
| Average annual employee contribution for job-related health insurance, 1998 Single coverage |
States |
At or above national average, $383-$859 |
Alabama, Arizona, Arkansas, Connecticut, District of Columbia, Florida, Georgia, Illinois, Kentucky, Maine, Maryland, Nebraska, New Jersey, New Mexico, New York, Ohio, Rhode Island, Texas, Utah, Virginia, West Virginia, Wisconsin |
| At or above national average, $383-$859 and Significantly different from national average |
Massachusetts |
| Below national average, $125-$382 |
Alaska, California, Colorado, Delaware, Indiana, Iowa, Kansas, Louisiana, Michigan, Minnesota, Mississippi, Missouri, New Hampshire, North Carolina, Oklahoma, South Carolina, Tennessee, Wyoming |
| Below national average, $125-$382 and Significantly different from national average |
Hawaii, Idaho, Nevada, Oregon, Pennsylvania, Washington |
| Data not available |
Montana, North Dakota, South Dakota, Vermont |
| Estimates for Alaska, the District of Columbia, Hawaii, Maine, Mississippi, Nevada, and Rhode Island are based on 1997 survey data. See Note 1 for details. |
Return To Table Of Contents
Does the average total health insurance premium for family coverage vary by State?
The total health insurance premium for job-related coverage consists of contributions by both the employer and the employee. Variations in premiums by State reflect differences in medical costs, enrollment patterns, State regulations, and the generosity of health plan benefits and plan types.
-
Family coverage premiums exceeded the national average in six States— New York ($6,453), Connecticut ($6,380), New Jersey ($6,332), New Hampshire ($6,185), Massachusetts ($6,139), and the District of Columbia ($6,050).
-
Family coverage premiums were below the national average in four States—North Carolina ($4,964), New Mexico ($4,889), Arkansas ($4,813), and Mississippi ($4,571).
-
Nationally, the average yearly premium for family coverage increased 7.6% from 1996 to 1997 and 4.8% from 1997 to 1998. The average yearly family premium was $4,954 in 1996, $5,332 in 1997, and $5,590 in 1998.
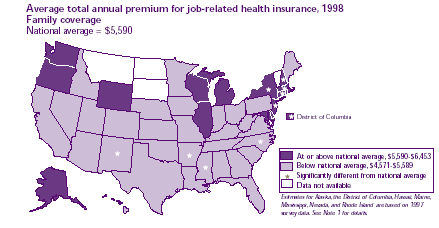
| Average total annual premium for job-related health insurance, 1998 Family coverage |
States |
At or above national average, $5,590-$6,453 |
Alaska, Delaware, Illinois, Maryland, Michigan, Oregon, Rhode Island, Washington, Wisconsin, Wyoming |
| At or above national average, $5,590-$6,453 and Significantly different from national average |
Connecticut, District of Columbia, Massachusetts, New Hampshire, New Jersey, New York |
| Below national average, $4,571-$5,589 |
Alabama, Arizona, California, Colorado, Florida, Georgia, Hawaii, Idaho, Indiana, Iowa, Kansas, Kentucky, Louisiana, Maine, Minnesota, Missouri, Nebraska, Nevada, Ohio, Oklahoma, Pennsylvania, South Carolina, Tennessee, Texas, Utah, Virginia, West Virginia |
| Below national average, $4,571-$5,589 and Significantly different from national average |
Arkansas, Mississippi, North Carolina, New Mexico |
| Data not available |
Montana, North Dakota, South Dakota, Vermont |
| Estimates for Alaska, the District of Columbia, Hawaii, Maine, Mississippi, Nevada, and Rhode Island are based on 1997 survey data. See Note 1 for details. |
Return To Table Of Contents
Do workers in different States pay the same amount for family coverage?
-
The average employee contribution was significantly above the national average in the District of Columbia ($1,877), Florida ($1,861), and Texas ($1,623).
-
It was below the national average in Pennsylvania ($1,236), Indiana ($1,107), and Ohio ($1,071).
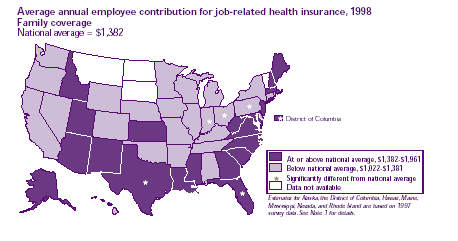
| Average annual employee contribution for job-related health insurance, 1998 Family coverage |
States |
At or above national average, $1,382-$1,961 |
Alaska, Arizona, Georgia, Idaho, Kansas, Louisiana, Maine, Maryland, Massachusetts, Mississippi, New Hampshire, New Jersey, New Mexico, North Carolina, South Carolina, Utah, Virginia, West Virginia |
| At or above national average, $1,382-$1,961and Significantly different from national average |
District of Columbia, Florida, Texas |
| Below national average, $1,022-$1,381 |
Alabama, Arkansas, California, Colorado, Connecticut, Delaware, Hawaii, Illinois, Iowa, Kentucky, Michigan, Minnesota, Missouri, Nebraska, Nevada, New York, Oklahoma, Oregon, Rhode Island, Tennessee, Washington, Wisconsin, Wyoming |
| Below national average, $1,022-$1,381 and Significantly different from national average |
Indiana, Ohio, Pennsylvania |
| Data not available |
Montana, North Dakota, South Dakota, Vermont |
| Estimates for Alaska, the District of Columbia, Hawaii, Maine, Mississippi, Nevada, and Rhode Island are based on 1997 survey data. See Note 1 for details. |
Return To Table Of Contents
What percent of the premium for single and family coverage do employees pay?
-
The average employee contribution for single coverage was significantly below the national average in Hawaii (6.2%), Oregon (8.9%), Nevada (10.1%), Washington (10.5%), and Pennsylvania (13.2%).
-
Nationally, the employee contribution rate (as a portion of the total premium) was 7.1 percentage points higher for family coverage than for single coverage.
-
The employee contribution rate was higher for family coverage than single coverage in every State except one.
-
As a portion of premiums, the national average employee contribution rates for both single and family health insurance plans did not change significantly from 1996 to 1998. Employers continued to share health insurance costs with their employees at approximately the same level in 1998 as in 1996.
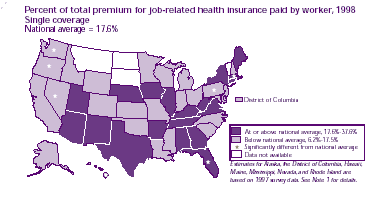
| Percent of total premium for job-related health insurance paid by worker, 1998 Single coverage |
States |
At or above national average, 17.6%-37.6% |
Alabama, Arizona, Arkansas, Connecticut, Georgia, Illinois, Iowa, Kentucky, Maine, Nebraska, New Mexico, New York, Rhode Island, Tennessee, Texas, Utah, Virginia, West Virginia |
| At or above national average, 17.6%-37.6% and Significantly different from national average |
Florida, Massachusetts |
| Below national average, 6.2%-17.5% |
Alaska, California, Colorado, Delaware, District of Columbia, Hawaii, Idaho, Indiana, Kansas, Louisiana, Maryland, Michigan, Minnesota, Mississippi, Missouri, New Hampshire, New Jersey, North Carolina, Ohio, Oklahoma, South Carolina, Wisconsin, Wyoming |
| Below national average, 6.2%-17.5% and Significantly different from national average |
Nevada, Oregon, Pennsylvania, Washington |
| Data not available |
Montana, North Dakota, South Dakota, Vermont |
| Estimates for Alaska, the District of Columbia, Hawaii, Maine, Mississippi, Nevada, and Rhode Island are based on 1997 survey data. See Note 1 for details. |
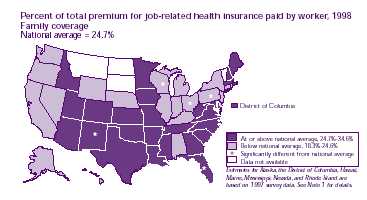
| Percent of total premium for job-related health insurance paid by worker, 1998 Family coverage |
States |
At or above national average, 24.7%-34.6% |
Arizona, Arkansas, Colorado, District of Columbia, Georgia, Idaho, Iowa, Kansas, Louisiana, Maine, Maryland, Massachusetts, Minnesota, Mississippi, Missouri, New Hampshire, North Carolina, Oklahoma, South Carolina, Tennessee, Texas, Utah, Virginia, West Virginia |
| At or above national average, 24.7%-34.6% and Significantly different from national average |
Florida, New Mexico |
| Below national average, 18.3%-24.6% |
Alabama, Alaska, California, Connecticut, Delaware, Hawaii, Illinois, Indiana, Kentucky, Michigan, Nebraska, Nevada, New Jersey, New York, Oregon, Rhode Island, Washington, Wyoming |
| Below national average, 18.3%-24.6% and Significantly different from national average |
Ohio, Pennsylvania, Wisconsin |
| Data not available |
Montana, North Dakota, South Dakota, Vermont |
| Estimates for Alaska, the District of Columbia, Hawaii, Maine, Mississippi, Nevada, and Rhode Island are based on 1997 survey data. See Note 1 for details |
Return To Table Of Contents
Section 3: Choice
Health insurance plans do not differ only in premium costs. For instance, some plans restrict enrollees’ choice of providers, while others do not. Some plans require a higher fee for a doctor’s visit than others. With a choice of plans, workers can pick the plan that best meets their needs in terms of both benefits and costs.
In which States are establishments most likely to offer a choice of health insurance plans?
-
Establishments in California (44.3%) and Hawaii (38.3%) were most likely to offer their employees a choice of health insurance plans.
-
Establishments were least likely to offer a choice of plans in Alaska (12.4%), Mississippi (17.1%), Nebraska (18.1%), Alabama (19.8%), Wyoming (21.0%), Idaho (22.0%), and Kansas (22.1%). Multiple plan offer rates were also significantly below the national average in Minnesota (23.0%), Kentucky (23.4%), Colorado (24.0%), and North Carolina (26.7%).
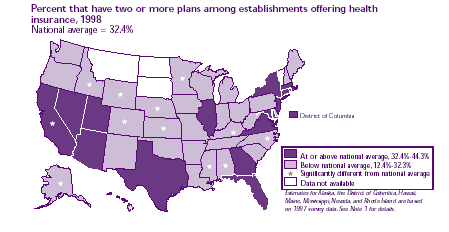
| Percent that have two or more plans among establishments offering health insurance, 1998 |
States |
At or above national average, 32.4%-44.3% |
Arizona, Connecticut, District of Columbia, Florida, Georgia, Illinois, Maryland, Massachusetts, Nevada, New Jersey, New York, Rhode Island, Texas, Utah, Virginia |
| At or above national average, 32.4%-44.3% and Significantly different from national average |
California, Hawaii |
| Below national average, 12.4%-32.3% |
Arkansas, Delaware, Indiana, Iowa, Louisiana, Maine, Michigan, Missouri, New Hampshire, New Mexico, Ohio, Oklahoma, Oregon, Pennsylvania, South Carolina, Tennessee, Washington, West Virginia, Wisconsin |
| Below national average, 12.4%-32.3% and Significantly different from national average |
Alabama, Alaska, Colorado, Idaho, Kansas, Kentucky, Minnesota, Mississippi, Nebraska, North Carolina, Wyoming |
| Data not available |
Montana, North Dakota, South Dakota, Vermont |
| Estimates for Alaska, the District of Columbia, Hawaii, Maine, Mississippi, Nevada, and Rhode Island are based on 1997 survey data. See Note 1 for details |
Return To Table Of Contents
Where are establishments most likely to offer conventional indemnity plans?
In a conventional indemnity plan, enrollees can go to the physicians of their choice on a fee-for-service basis. The plan does not have a network of health care providers associated with it. Conventional indemnity plans were once the most common type of health insurance plan offered to employees in the United States but have become less and less common in the past decade.
-
In Wyoming (61.7%), Alaska (55.0%), and Idaho (50.5%), more than half the establishments offering insurance offered an indemnity plan.
-
Establishments in West Virginia (45.7%), Maine (39.7%), Rhode Island (36.4%), Iowa (33.1%), Michigan (32.5%), and Pennsylvania (30.9%) also offered conventional indemnity plans at rates significantly above the national average.
-
Conventional indemnity plans were least likely to be offered by employers in Colorado (12.3%), Missouri (12.9%), California (14.7%), District of Columbia (15.5%), Massachusetts (15.9%), New Jersey (17.8%), and Nevada (18.6%).
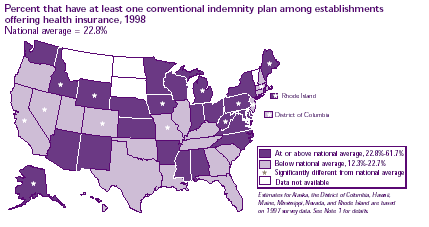
| Percent that have at least one conventional indemnity plan among establishments offering health insurance, 1998 |
States |
At or above national average, 24.7%-34.6% |
Alabama, Arizona, Arkansas, Delaware, Indiana, Kansas, Maryland, Minnesota, Mississippi, Nebraska, New Mexico, New York, North Carolina, Ohio, Virginia, Washington, Wisconsin |
| At or above national average, 24.7%-34.6% and Significantly different from national average |
Alaska, Idaho, Iowa, Maine, Michigan, Pennsylvania, Rhode Island, West Virginia, Wyoming |
| Below national average, 18.3%-24.6% |
Connecticut, Florida, Georgia, Hawaii, Illinois, Kentucky, Louisiana, New Hampshire, Oklahoma, Oregon, South Carolina, Tennessee, Texas, Utah |
| Below national average, 18.3%-24.6% and Significantly different from national average |
California, Colorado, District of Columbia, Massachusetts, Missouri, Nevada, New Jersey |
| Data not available |
Montana, North Dakota, South Dakota, Vermont |
| Estimates for Alaska, the District of Columbia, Hawaii, Maine, Mississippi, Nevada, and Rhode Island are based on 1997 survey data. See Note 1 for details |
Return To Table Of Contents
Where are establishments most likely to offer managed care plans?
In a managed care plan, enrollees are restricted in their choice of providers or have a financial incentive to go to a preferred provider. Managed care plans include both exclusive provider plans such as health maintenance
organizations (HMOs) and preferred provider plans such as preferred provider organizations (PPOs) and point-of-service (POS) plans.
-
In 10 States, managed care plans were available in more than 9 out of 10 establishments. Establishments in Tennessee (94.5%), California (93.5%), Massachusetts (92.2%), and the District of Columbia (90.9%) all offered managed care plans at rates significantly above the national average.
-
Less than half of the establishments that offered health insurance in Wyoming (45.5%) and Alaska (48.9%) included a managed care plan. Other States where managed care plans were offered less frequently than nationwide include Idaho (57.6%), West Virginia (64.6%), Maine (68.6%), Iowa (75.3%), Michigan (77.2%), and Pennsylvania (79.2%).
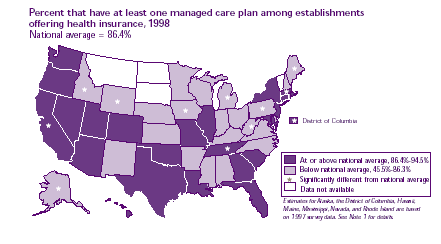
| Percent that have at least one managed care plan among establishments offering health insurance, 1998 |
States |
At or above national average, 86.4%-94.5% |
Arizona, Colorado, Connecticut, Florida, Georgia, Hawaii, Illinois, Louisiana, Maryland, Missouri, Nevada, New Jersey, New York, Oklahoma, Oregon, South Carolina, Texas, Utah, Washington |
| At or above national average, 86.4%-94.5% and Significantly different from national average |
California, District of Columbia, Massachusetts, Tennessee |
| Below national average, 45.5%-86.3% |
Alabama, Arkansas, Delaware, Indiana, Kansas, Kentucky, Minnesota, Mississippi, Nebraska, New Hampshire, New Mexico, North Carolina, Ohio, Rhode Island, Virginia, Wisconsin |
| Below national average, 45.5%-86.3% and Significantly different from national average |
Alaska, Idaho, Iowa, Maine, Michigan, Pennsylvania, West Virginia, Wyoming |
| Data not available |
Montana, North Dakota, South Dakota, Vermont |
| Estimates for Alaska, the District of Columbia, Hawaii, Maine, Mississippi, Nevada, and Rhode Island are based on 1997 survey data. See Note 1 for details |
Return To Table Of Contents
Where are establishments most likely to offer exclusive provider plans?
Exclusive provider plans (for example, HMOs) require that enrollees go to providers associated with the plan except in an emergency. There is typically no cost or a small fixed cost for each physician visit.
- The States where employers were most likely to offer an exclusive provider plan were Massachusetts (62.8%), California (60.5%), New Hampshire (58.7%), Oregon (56.5%), New York (51.9%), Hawaii (51.1%), and Arizona (48.6%).
- In general, exclusive provider plans were most commonly offered in the Northeast and on the West coast.
- Exclusive provider plans were much less common in the South and Midwest.
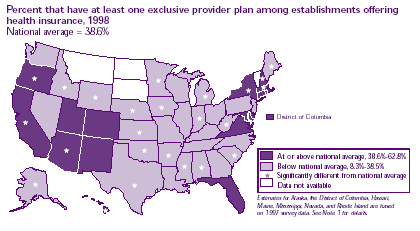
| Percent that have at least one exclusive provider plan among establishments offering health insurance, 1998 |
States |
At or above national average, 86.4%-94.5% |
Colorado, Connecticut, Delaware, District of Columbia, Florida, Maryland, New Mexico, Rhode Island, Utah, Virginia |
| At or above national average, 86.4%-94.5% and Significantly different from national average |
Arizona, California, Hawaii, Massachusetts, New Hampshire, New York, Oregon |
| Below national average, 45.5%-86.3% |
Georgia, Illinois, Kentucky, Louisiana, Missouri, Nevada, New Jersey, North Carolina, Ohio, Pennsylvania, Tennessee, Washington, Wisconsin |
| Below national average, 45.5%-86.3% and Significantly different from national average |
Alabama, Alaska, Arkansas, Idaho, Indiana, Iowa, Kansas, Maine, Michigan, Minnesota, Mississippi, Nebraska, Oklahoma, South Carolina, Texas, West Virginia, Wyoming |
| Data not available |
Montana, North Dakota, South Dakota, Vermont |
| Estimates for Alaska, the District of Columbia, Hawaii, Maine, Mississippi, Nevada, and Rhode Island are based on 1997 survey data. See Note 1 for details |
Return To Table Of Contents
Where are establishments most likely to offer preferred provider plans?
In preferred provider plans (for example, PPOs), enrollees can go to a network of “preferred” providers associated with the plan or to other providers of their choice. If they choose a non-preferred provider, they face higher out-of-pocket costs.
-
Preferred provider plans were most frequently offered by employers in the South and Midwest. In nine States, more than 70% of the establishments that offered health insurance included a preferred provider type plan.
-
In New Hampshire (35.5%), Massachusetts (42.5%), Rhode Island (48.2%), Oregon (48.7%), New York (50.1%), and California (54.3%), the prevalence of preferred provider plans was below the national average. Note that these States were above average when it came to offering exclusive provider plans.
-
Wyoming (38.9%), Idaho (46.1%), Alaska (46.4%), and West Virginia (51.6%) were below the national average in offering both preferred provider and exclusive provider plans.
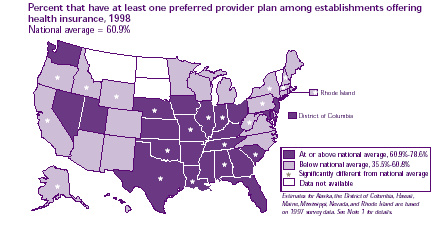
| Percent that have at least one preferred provider plan among establishments offering health insurance, 1998 |
States |
At or above national average, 60.9%-78.6% |
Arkansas, District of Columbia, Florida, Georgia, Iowa, Kansas, Kentucky, Maryland, Mississippi, Nevada, New Jersey, Ohio, Utah, Washington |
| At or above national average, 60.9%-78.6% and Significantly different from national average |
Alabama, Illinois, Indiana, Louisiana, Missouri, Nebraska, Oklahoma, South Carolina, Tennessee, Texas |
| Below national average, 35.5%-60.8% |
Arizona, Colorado, Connecticut, Delaware, Hawaii, Maine, Michigan, Minnesota, New Mexico, North Carolina, Virginia, Wisconsin |
| Below national average, 35.5%-60.8% and Significantly different from national average |
Alaska, California, Idaho, Massachusetts, New Hampshire, New York, Oregon, Pennsylvania, Rhode Island, West Virginia, Wyoming |
| Data not available |
Montana, North Dakota, South Dakota, Vermont |
| Estimates for Alaska, the District of Columbia, Hawaii, Maine, Mississippi, Nevada, and Rhode Island are based on 1997 survey data. See Note 1 for details |
Return To Table Of Contents
Looking Ahead
Future MEPS Data on Job- Related Health Insurance
MEPS data on job-related health insurance for 1996, 1997, 1998, and 1999 are currently available on the MEPS Web site. The Insurance Component of MEPS is conducted annually. As additional years of data become available, trends such as the effects of Federal and State regulations on employer-sponsored health insurance can be studied in greater detail.
Return To Table Of Contents
References
All the data shown in this chartbook are available on the MEPS Web site in the Summary Data Tables.
The tables of data on the Web site are also available for free on CD-ROM AHRQ No. 01-DP04). In addition to the tables, the Web site provides an interactive tool called MEPSnet that allows users to make queries about trends in health insurance offered by private establishments and State and local governments across all available years. The confidential microdata are accessible for research purposes through the Census Bureau’s Center for Economic Studies. For additional information, see their Web site at http://www.ces.census.gov
The following references were used for the descriptions and discussion in this report.
Branscome JM, Cooper PF, Sommers JP, et al. Private employer-sponsored health insurance: new estimates by State. Health Affairs 2000 Jan-Feb;19(1): 139-47.
Cohen JW, Monheit AC, Beauregard KM, et al. The Medical Expenditure Panel Survey: a national health information resource. Inquiry 1996-97;33:373-89.
Cooper PF, Schone BS. More offers, fewer takers for employment-based health insurance: 1987 and 1996. Health Affairs 1997 Nov-Dec;16(6):142-9.
Peterson CL, Vistnes JP. State differences in job-related health insurance, 1996. Rockville (MD): Agency for Healthcare Research and Quality; 2000. MEPS Chartbook No. 4. AHRQ Pub. No. 00-0017.
Sommers JP. List sample design of the 1996 Medical Expenditure Panel Survey Insurance Component. Rockville (MD): Agency for Health Care Policy and Research; 1999. MEPS Methodology Report No. 6. AHCPR Pub. No. 99-0037.
Sommers JP. Construction of weights for the 1996 Medical Expenditure Panel Survey Insurance Component list sample. Rockville (MD): Agency for Health Care Policy and Research; 1999. MEPS Methodology Report No. 8. AHCPR Pub. No. 00-0005.
Sommers JP. Imputation of employer information for the 1996 Medical Expenditure Panel Survey Insurance Component. Rockville (MD): Agency for Healthcare Research and Quality; 2000. MEPS Methodology Report No. 10. AHRQ Pub. No. 00-0039.
State of Hawaii Department of Labor and Industrial Relations. Digest of Chapters 386, 392, and 393: Hawaii Workers’ Compensation, Temporary Disability Insurance and Prepaid Health Care Laws. Form DC-1, revised Oct 1992.
Vistnes JP, Monheit AC. Health insurance status of the civilian noninstitutionalized population: 1996. Rockville (MD): Agency for Health Care Policy and Research; 1997. MEPS Research Findings No. 1. AHCPR Pub. No. 97-0030.
Return To Table Of Contents
Notes
Note 1: State-level estimates for 1997 were used in this chartbook for seven States. State-level estimates for 11 States were not available for 1998 because of cost constraints. However, 1997 data were available for seven of these States—Alaska, District of Columbia, Hawaii, Maine, Mississippi, Nevada, and Rhode Island—and these data have been included in the report. For analytical consistency, all 1997 estimates were compared to the national totals for 1997. Currently, no data are available for the four remaining States—Montana, North Dakota, South Dakota, and Vermont.
Note 2: Private employers in Hawaii are not required to offer health insurance to the following workers: Federal, State, and county workers; workers employed for less than 20 hours a week; agricultural seasonal workers; insurance and real estate salesmen paid solely by commission; individuals working for a son, daughter, or spouse; children under the age of 21 working for father or mother; workers covered as dependents under a qualified health care plan; workers covered by State-governed medical assistance; or workers receiving public assistance. To be covered under the mandate, workers must have worked four consecutive weeks of 20 or more hours a week and earned monthly wages of at least 86.67 times the Hawaii minimum hourly wage, which is currently $5.25. Employers are required to pay at least half of the premium cost (State of Hawaii Department of Labor and Industrial Relations, 1992). Estimates shown here for Hawaii are based on 1997 data.
Note 3: When conducting several tests simultaneously on the same data set, it is important to control the overall significance level of the tests. Failure to do so can lead to an increased number of tests with “false significance” results. Multiple comparison procedures are used to address this problem. For this chartbook, a multiple-comparison procedure using the Bonferroni inequality was used when simultaneously testing whether each of the States differs from the national average.
Note 4: The first MEPS IC data were obtained in 1996, prior to the implementation of the Health Insurance Portability and Accountability Act (HIPAA). The 1998 data presented in this chartbook were collected after HIPAA implementation. HIPAA requires that insurers not deny coverage to a worker on the basis of health status. Employers may refuse to cover a pre-existing condition for up to 12 months for new employees, but employees can reduce the length of that waiting period by the length of prior coverage.
Return To Table Of Contents
Order your free CD-ROM:
MEPS IC-002: 1996/1997/1998 Employer-Sponsored Health Insurance Data
AHRQ No. 01-DP04
Write:
AHRQ Publications Clearinghouse
Attn: 01-DP04
P.O. Box 8547
Silver Spring, MD 20907
Or call:
1-800-358-9295 and ask for AHRQ 01-DP04.
For these and other data, visit the MEPS Web site at:
http://www.meps.ahrq.gov
Return To Table Of Contents
| Suggested Citation: Chartbook #7: State Differences in Job-Related Health Insurance, 1998. October 2001. Agency for Healthcare Research and Quality, Rockville, MD.
http://www.meps.ahrq.gov/data_files/publications/cb7/cb7.shtml |
|
