Chartbook #9: The Uninsured in America, 1996-2000
By Jeffrey A. Rhoades, Ph.D., Jessica P. Vistnes, Ph.D., Joel W. Cohen, Ph.D.
Contents
The estimates in this report are based on the most recent data available from MEPS at the time the report was written. However, selected elements of MEPS data may be revised on the basis of additional analyses, which could result in slightly different estimates from those shown here. Please check the MEPS Web site for the most current file releases — www.meps.ahrq.gov
AHRQ is the lead Federal agency charged with supporting research designed to improve the quality of health care, reduce its cost, address patient safety and medical errors, and broaden access to essential services.AHRQ sponsors and conducts research that provides evidence-based information on health care outcomes; quality; and cost, use, and access.The information helps health care decisionmakers—patients and clinicians, health system leaders, and policymakers—make more informed decisions and improve the quality of health care services.
Executive Summary
This report shows changes between 1996 and 2000 in the non-elderly population's risk of being uninsured.
Overview
The number of uninsured Americans under age 65 varied up to twofold depending on the time period used to define being uninsured. Numbers were highest for Americans uninsured at some point during the year, lowest for those uninsured all year, and in between for those uninsured throughout the first half of the year.
The percent of the population uninsured at some point during the year declined from 27.0% in 1996 to 25.1% in 1999.
Age
The percent of children who were uninsured all year declined from 10.4% in 1996 to 7.8% in 1999.
Of all age groups, young adults (ages 18-24) are the most likely to be uninsured. In each year 1996-99, 5 to 6 million young adults were uninsured all year and roughly 11 million were uninsured at some point during the year.
Racial/Ethnic Groups
Hispanics were the racial/ethnic group most at risk of lacking coverage. In 1996, close to 30% of non-elderly Hispanics were uninsured all year, compared to 10% of whites.
Estimates for both whites and blacks indicate an improvement from 1996 to 1999 in the risk of being uninsured, but Hispanics did not experience any improvement.
Employment
In early 2000, wage-earners with low hourly wages were about 10 times more likely to be uninsured than those with high hourly wages.
In each year from 1996 through 2000, wage earners in small establishments were at much greater risk of being uninsured than those in larger establishments.
Return To Table Of Contents
Introduction
Estimates of the health insurance status of the U.S. civilian noninstitutionalized (community) population are critical to policymakers and others concerned with access to medical care and the cost and quality of that care. Health insurance helps people get timely access to medical care and protects them against the risk of expensive and unanticipated medical events. Compared to people with health care coverage, uninsured people are less likely to visit a doctor, have a usual source of medical care, receive preventive services, or have a recommended test or prescription filled (Taylor, Cohen, and Machlin, 2001; Weinick, Zuvekas, and Drilea, 1997).
Timely and reliable estimates of the population's health insurance status are essential to evaluate the costs and expected impact of public policy interventions in this area, such as efforts to expand coverage or to alter the way in which private and public insurance is financed. Identification of population groups particularly likely to lack coverage is essential for developing efficient and targeted policy interventions.
The Medical Expenditure Panel Survey (MEPS), a household survey that is conducted annually, provides critical data for evaluating trends in the health insurance status of the population. This chartbook presents data from the first year of the survey, 1996, through 2000. Unless otherwise noted, only differences that are statistically significant at the 0.05 level are discussed in the text.
Following an overview of the uninsured in America (Section 1), this chartbook examines the problem of lack of insurance in terms of predictors of insurance status: age (Section 2), race/ethnicity (Section 3), and employment status (Section 4).Visit the MEPS Web site for recent data and publications — www.meps.ahrq.gov
MEPSnet, on the MEPS Web site, provides easy access to statistics on the Nation’s health care use, expenses, sources of payment, and insurance coverage.
Return To Table Of Contents
Source of Data
MEPS
The estimates presented in this report come from the Medical Expenditure Panel Survey (MEPS) Household Component. MEPS is cosponsored by the Agency for Healthcare Research and Quality (AHRQ) and the National Center for Health Statistics (NCHS). It is a nationally representative survey of the U.S. civilian noninstitutionalized population that collects data on medical expenses for both individuals and households. MEPS collects detailed data on demographic characteristics, health conditions, health status, use of medical care services, charges and payments, access to care, satisfaction with care, health insurance coverage, income, and employment. Other MEPS components collect data on the use, charges, and payments reported by medical care providers; data on residents of licensed or certified nursing homes; and data on the supply side of the health insurance market.
The sample for the MEPS Household Component is representative of the U.S. community population. It was designed to sample enough Hispanics and blacks to allow valid estimates for these subpopulations. For a detailed description of the MEPS survey design, see J. Cohen (1997) and S. Cohen (1997).
MEPS data are released to the public in a number of formats, including public use data files and the printed MEPS Research Findings and MEPS Highlights series. The numbers shown in this chartbook are drawn from analyses conducted by the MEPS staff from the following public use files: 1996-98 Full Year Consolidated Data Files, HC-012, HC-020, and HC-028, respectively; 1999 Full Year Population Characteristics Data File HC-031; and 1996-2000 Point in Time Data Files (HC-001, HC-005, HC-009, HC-013,HC-022).
Comparisons with other surveys
Estimates of the uninsured vary among surveys depending on the definition each survey uses of being uninsured (e.g., the time period and types of coverage counted as insurance) and the methods by which the data are collected. Although estimates from MEPS, the Census Bureau's Current Population Survey (CPS), and the National Health Interview Survey (NHIS), conducted by the National Center for Health Statistics, are different for a given year, the trends tend to be similar. For example, both MEPS and the CPS show that the percentage of the population that was uninsured the entire year declined from 1997 to 1999.
For a detailed explanation of possible reasons for differences among survey estimates, see "Understanding Estimates of the Uninsured: Putting the Differences in Context" (Department of Health and Human Services, 2002) at http://aspe.hhs.gov/health/reports/hiestimates.htm.
Return To Table Of Contents
Section 1: Overview
MEPS produces estimates of the uninsured for different periods of time within a year. This chartbook provides national estimates of the percent and number of non-elderly (under age 65) people in the U.S. community population who were without health insurance:
- For the entire year.
- At some point during the year.
- Throughout the first half of the year.
The estimates of the uninsured are highest for people uninsured at some point in the year, some of whom are insured at other times during the year. They are lowest for people uninsured all year. Estimates for people uninsured during the first half of the year fall somewhere in between.
What percent of the non-elderly U.S. population were uninsured each year from 1996 to 2000?
- The estimate of the percent of the population who were uninsured depends heavily on the time period used in calculating the estimates—the first half of the year, some time during the year, or the entire year.
- In 1999, the latest year for which all three measures are available, MEPS data indicate that 25.1% of the population under age 65 were uninsured at some point during the year, 17.9% were uninsured throughout the first half of the year, and 12.2% were uninsured throughout the entire year.
- From 1996 to 1999, the percent of the population uninsured at some point during the year declined from 27.0% to 25.1% and the percent uninsured all year declined from 13.8% to 12.2%. From 1996 to 1998, the percent of the population uninsured during the first half of the year declined from 19.2% to 17.8%.
 |
Percent Uninsured |
| |
Any time
in year |
First half
of year |
Full year |
| 1996 |
27.0% |
19.2% |
13.8% |
| 1997 |
26.8% |
18.9% |
13.9% |
| 1998 |
25.3% |
17.8% |
13.3% |
| 1999 |
25.1% |
17.9% |
12.2% |
| 2000 |
|
18.2% |
|
|
Return To Table Of Contents
How many non-elderly people in the U.S. were uninsured each year?
- The number of people uninsured varied up to twofold, depending on the time period used to define being uninsured. In 1999, 28.9 million people were uninsured all year, while 59.2 million were uninsured at some point during the year. The number uninsured throughout the first half of 1999 fell between these two estimates (42.6 million).
- Although the percent uninsured declined from 1996 to 1999, there was no statistically significant decline in the number of uninsured people over this time period.
 |
Number uninsured in millions |
| |
Any time
in year |
First half
of year |
Full year |
| 1996 |
62.0 |
44.5 |
31.6 |
| 1997 |
62.2 |
44.2 |
32.1 |
| 1998 |
59.1 |
42.0 |
31.0 |
| 1999 |
59.2 |
42.6 |
28.9 |
| 2000 |
|
43.8 |
|
|
Return To Table Of Contents
Section 2: Age
Policymakers have focused their attention on the insurance status of a number of different age groups in recent years, including children under age 18 and the near-elderly (ages 55-64). For example, in 1997, Congress passed the State Children's Health Insurance Program (SCHIP), which was designed to reduce the number of uninsured children. Because the period 1997-99 covered the early stages of implementation of the SCHIP program, examination of these data provides some indication of how the number of uninsured children changed during the early phase of the program. Policymakers have also been concerned about the difficulties near-elderly people may face in getting and keeping health insurance coverage, given the increased risk of illness with age.
The next set of charts examines the risk of being uninsured by age and shows whether the decline for the overall non-elderly population was experienced by all or only some age groups.
Which age groups were most likely to lack health insurance in 1996?
- Young adults, ages 18-24, were most likely to be uninsured in 1996. Close to one-quarter of young adults lacked coverage throughout 1996 and a little over 45% were uninsured any time during the year. The comparable figures for all nonelderly people were 13.8% and 27.0%, respectively.
- Children under age 18 and near elderly people (55-64) had the lowest rates of being uninsured all year: 10.4% and 10.8%, respectively.
 |
Percent Uninsured all year |
| |
Any time in year |
Full year |
| Total |
27.0% |
13.8% |
| Under 18 |
24.0% |
10.4% |
| 18-24 |
45.5% |
22.7% |
| 25-54 |
26.5% |
14.4% |
| 55-64 |
17.9% |
10.8% |
|
Return To Table Of Contents
How has the percent of children who are uninsured changed from 1996 to 1999?
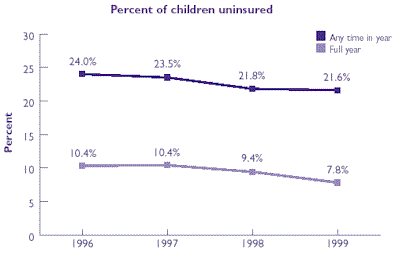
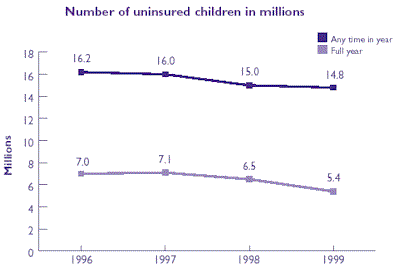
- The percent of children uninsured all year declined from 10.4% in 1996 to 7.8% in 1999. The number of uninsured children declined by 1.6 million, from 7.0 million in 1996 to 5.4 million in 1999.
- The number and percent of children uninsured at some point during the year also declined over this time period, but these changes were not statistically significant.
- In each year, the number and percent of children uninsured sometime during the year were more than double the estimates for children uninsured all year. For example, in 1999, 14.8 million children were uninsured at some point during the year but only 5.4 million children were uninsured all year.
 |
Percent of children uninsured |
| |
Any time in year |
Full year |
| 1996 |
24.0% |
10.4% |
| 1997 |
23.5% |
10.4% |
| 1998 |
21.8% |
9.4% |
| 1999 |
21.6% |
7.8% |
|
 |
Number of uninsured children
in millions |
| |
Any time in year |
Full year |
| 1996 |
16.2 |
7.0 |
| 1997 |
16.0 |
7.1 |
| 1998 |
15.0 |
6.5 |
| 1999 |
14.8 |
5.4 |
|
Return To Table Of Contents
Did the decline in the number of uninsured children between 1996 and 1999 come from a change in public or private coverage?
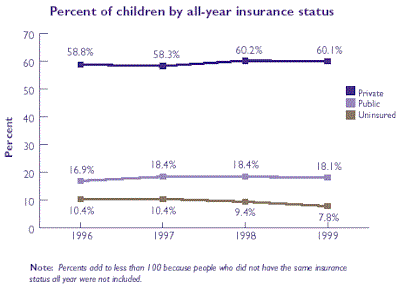
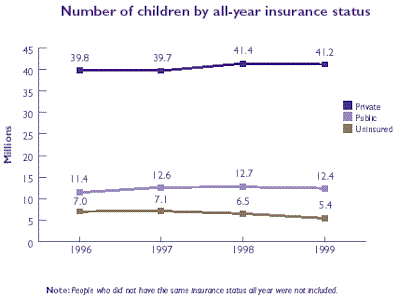
- The percent of children under age 18 who were uninsured all year declined by 2.5 percentage points, with public coverage and private coverage contributing 1.2 and 1.3 percentage points, respectively, to that decline. While the overall decline was significant, the individual changes in public and private coverage were not statistically significant.
- The increase in the number of insured children came from increases in both public and private coverage: 1.0 million and 1.4 million, respectively. Again, however, the individual changes for public and private coverage were not statistically significant.
 |
Percent of children by all-year insurance status |
| |
Private |
Public |
Uninsured |
| 1996 |
58.8% |
16.9% |
10.4% |
| 1997 |
58.3% |
18.4% |
10.4% |
| 1998 |
60.2% |
18.4% |
9.4% |
| 1999 |
60.1% |
18.1% |
7.8% |
Note: Percents add to less than 100 because people who did not have the same insurance status all year were not included. |
 |
Number of children by all-year insured status |
| |
Private |
Public |
Uninsured |
| 1996 |
39.8 |
11.4 |
7.0 |
| 1997 |
39.7 |
12.6 |
7.1 |
| 1998 |
41.4 |
12.7 |
6.5 |
| 1999 |
41.2 |
12.4 |
5.4 |
Note: People who did not have the same insurance status all year were not included |
Return To Table Of Contents
Has the insurance status of the age group most at risk of being uninsured, young adults, improved over time?
- In 1996, close to one-half of all young adults ages 18-24 experienced a period of being uninsured during the year and close to one-quarter were uninsured all year.
- There was no significant change in the health insurance status of this age group from 1996 to 1999.
- In each year from 1996 to 1999, about 51/2 million young adults were uninsured all year and roughly 11 million were uninsured at some point during the year.
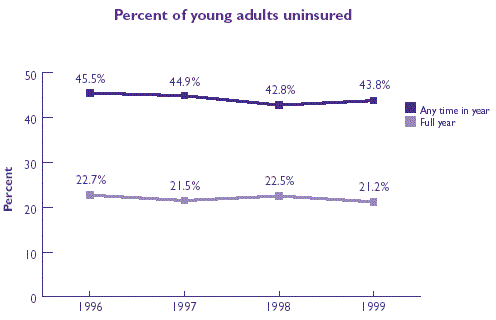 |
Percent of young adults uninsured |
| |
Any time in year |
Full year |
| 1996 |
45.5% |
22.7% |
| 1997 |
44.9% |
21.5% |
| 1998 |
42.8% |
22.5% |
| 1999 |
43.8% |
21.2% |
|
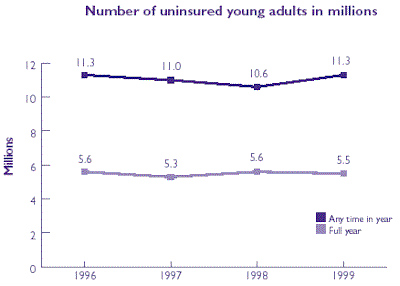 |
Number of uninsured young adults in millions |
| |
Any time in year |
Full year |
| 1996 |
11.3 |
5.6 |
| 1997 |
11.0 |
5.3 |
| 1998 |
10.6 |
5.6 |
| 1999 |
11.3 |
5.5 |
|
Return To Table Of Contents
Has the insurance status of adults ages 25-54 changed between 1996 and 1999?
- In each year from 1996 to 1999, about one-quarter of all adults ages 25-54 experienced a period of being uninsured during the year. Between 13% and 15% were uninsured throughout the year.
- Roughly 29 to 31 million adults this age were without insurance at some point during the year, and 15-17 million were uninsured all year. These numbers represent close to half of the total non-elderly uninsured population.
- The percent of adults ages 25-54 uninsured either all year or at some point during the year declined between 1997 and 1999. There was no significant change in the number of uninsured adults in this age group.
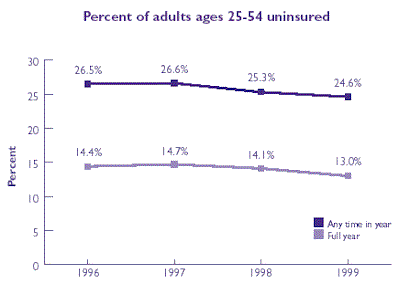 |
Percent of young adults uninsured |
| |
Any time in year |
Full year |
| 1996 |
26.5% |
14.4% |
| 1997 |
26.6% |
14.7% |
| 1998 |
25.3% |
14.1% |
| 1999 |
24.6% |
13.0% |
|
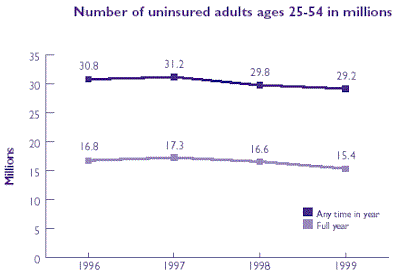 |
Number of uninsured young adults in millions |
| |
Any time in year |
Full year |
| 1996 |
30.8 |
16.8 |
| 1997 |
31.2 |
17.3 |
| 1998 |
29.8 |
16.6 |
| 1999 |
29.2 |
15.4 |
|
Return To Table Of Contents
Did the insurance status of near-elderly people, ages 55-64, change between 1996 and 1999?
- There was no change in the insurance status of the near elderly population over the 4-year period examined. About 10% to 11% of near-elderly people were uninsured throughout the year and 16% to 18% were uninsured at some point during the year.
- Roughly 2 to 3 million near elderly individuals were uninsured throughout each year and about 4 million were uninsured at some point during each year. These numbers do not represent a large proportion of the total uninsured population. However, people ages 55-64 have attracted policy interest because a lack of insurance coverage could be particularly serious given the increased risk of illness with age.
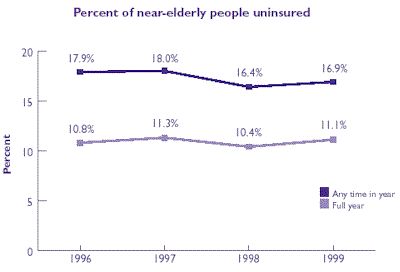 |
Percent of near-elderly people uninsured |
| |
Any time in year |
Full year |
| 1996 |
17.9% |
10.8% |
| 1997 |
18.0% |
11.3% |
| 1998 |
16.4% |
10.4% |
| 1999 |
16.9% |
11.1% |
|
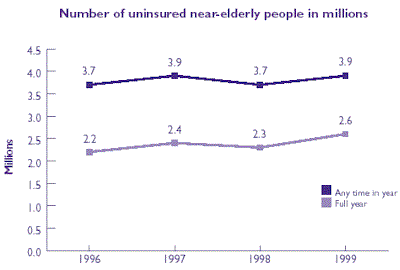 |
Number of uninsured near-elderly people in millions |
| |
Any time in year |
Full year |
| 1996 |
3.7 |
2.2 |
| 1997 |
3.9 |
2.4 |
| 1998 |
3.7 |
2.3 |
| 1999 |
3.9 |
2.6 |
|
Return To Table Of Contents
Section 3: Racial/Ethnic Groups
Historically, there have been significant disparities in rates of insurance coverage for different racial/ethnic groups. Previous research has shown that Hispanics, especially Hispanic males, are at particularly high risk of being uninsured (Monheit and Vistnes, 2000; Fronstin, Goldberg, and Robins, 1997). Previous charts indicated that the risk of being uninsured throughout an entire year declined for the population as a whole. The next set of charts examines levels of risk by race/ethnicity and whether the decline for the overall population was experienced by all or only some racial/ethnic groups.
Which racial/ethnic group was most likely to lack coverage in 1996?
- Hispanics were the most likely to lack coverage both throughout 1996 and any time during 1996. Nearly 30% of Hispanics were uninsured all year, and 46.4% were uninsured any time during the year.
- Rates of being uninsured all year for other racial/ethnic groups were substantially lower than rates for Hispanics: 17.4% for blacks, 10.5% for whites, and 16.6% for other racial/ethnic groups.
 |
Percent of uninsured all year |
| |
Any time in year |
Full Year |
| Total |
27.0% |
13.8% |
| White |
22.1% |
10.5% |
| Black |
35.9% |
17.4% |
| Hispanic |
46.4% |
28.7% |
| Other |
28.2% |
16.6% |
|
Return To Table Of Contents
How has the risk of being uninsured changed for white Americans between 1996 and 1999?
- The risk of being uninsured all year declined for whites from 10.5% in 1996 and 10.8% in 1997 to 8.8% in 1999. The estimate for being uninsured at some point during the year also fell, from 22.3% in 1997 to 20.4% in 1999.
- The number of non-elderly white people uninsured the entire year fell from 17.5 million in 1997 to 14.4 million in 1999.
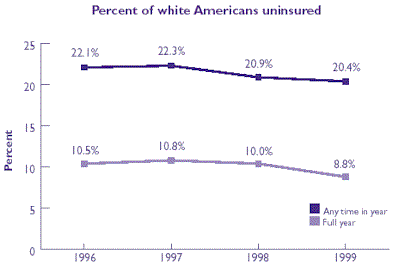 |
Percent of white Americans uninsured |
| |
Any time in year |
Full Year |
| 1996 |
22.1% |
10.5% |
| 1997 |
22.3% |
10.8% |
| 1998 |
20.9% |
10.0% |
| 1999 |
20.4% |
8.8% |
|
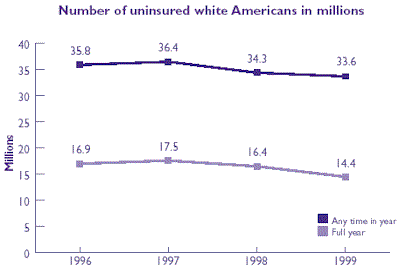 |
Number of uninsured white Americans in millions |
| |
Any time in year |
Full Year |
| 1996 |
35.8 |
16.9 |
| 1997 |
36.4 |
17.5 |
| 1998 |
34.3 |
16.4 |
| 1999 |
33.6 |
14.4 |
|
Return To Table Of Contents
How has the risk of being uninsured changed for black Americans between 1996 and 1999?
- For blacks the risk of being uninsured at some point during the year declined from 35.9% in 1996 to 29.4% in 1999.
- There was no significant change between 1996 and 1999 in the number of non-elderly black people uninsured either at some point during the year or all year.
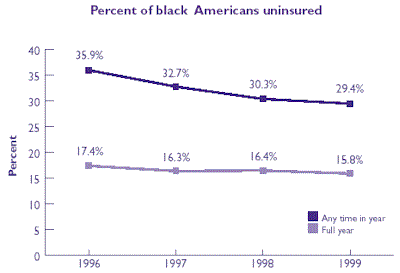 |
Percent of black Americans uninsured |
| |
Any time in year |
Full Year |
| 1996 |
35.9% |
17.4% |
| 1997 |
32.7% |
16.3% |
| 1998 |
30.3% |
16.4% |
| 1999 |
29.4% |
15.8% |
|
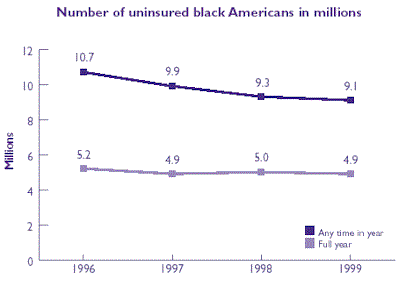 |
Number of uninsured black Americans in millions |
| |
Any time in year |
Full Year |
| 1996 |
10.7 |
5.2 |
| 1997 |
9.9 |
4.9 |
| 1998 |
9.3 |
5.0 |
| 1999 |
9.1 |
4.9 |
|
Return To Table Of Contents
How has the risk of being uninsured changed for Hispanic Americans between 1996 and 1999?
- Hispanics, the racial/ethnic group most at risk of being uninsured, did not experience a statistically significant change in the percent uninsured (either all year or any time during the year) over this time period.
- There was no statistically significant change between 1996 and 1999 in the number of nonelderly Hispanic people uninsured at some point during the year or all year.
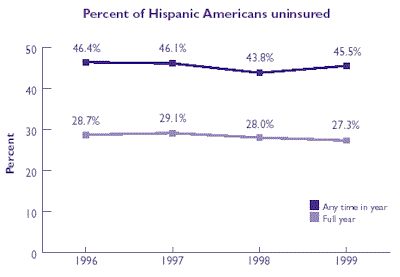 |
Percent of Hispanic Americans uninsured |
| |
Any time in year |
Full Year |
| 1996 |
46.4% |
28.7% |
| 1997 |
46.1% |
29.1% |
| 1998 |
43.8% |
28.0% |
| 1999 |
45.5% |
27.3% |
|
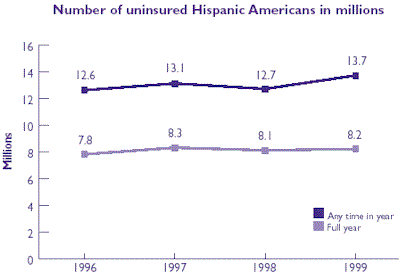 |
Number of uninsured Hispanic Americans in millions |
| |
Any time in year |
Full Year |
| 1996 |
12.6 |
7.8 |
| 1997 |
13.1 |
8.3 |
| 1998 |
12.7 |
8.1 |
| 1999 |
13.7 |
8.2 |
|
Return To Table Of Contents
How has the risk of being uninsured changed for other racial/ethnic groups between 1996 and 1999?
- There was no significant change from 1996 to 1999 in the percent uninsured (either all year or any time during the year) for other racial/ethnic groups, which include American Indians, Alaska Natives, Asians or Pacific Islanders, and other groups.
- There were no significant changes in the number of uninsured non-elderly people in other racial/ethnic groups over this time period.
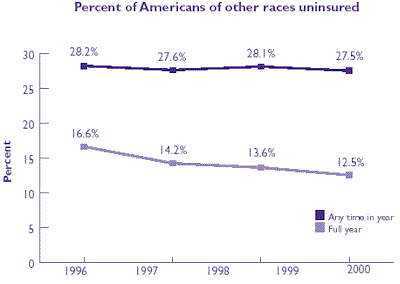 |
Percent of Americans of other races uninsured |
| |
Any time in year |
Full Year |
| 1996 |
28.2% |
16.6% |
| 1997 |
27.6% |
14.2% |
| 1998 |
28.1% |
13.6% |
| 1999 |
27.5% |
12.5% |
|
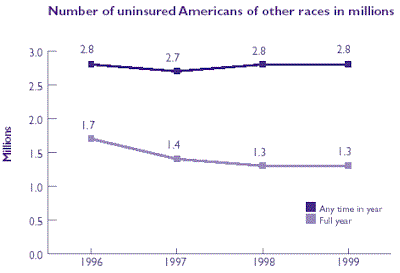 |
Number of uninsured Americans of other races in millions |
| |
Any time in year |
Full Year |
| 1996 |
2.8 |
1.7 |
| 1997 |
2.7 |
1.4 |
| 1998 |
2.8 |
1.3 |
| 1999 |
2.8 |
1.3 |
|
Return To Table Of Contents
Within racial/ethnic groups, were men or women more likely to be uninsured?
- Overall, women were less likely to be uninsured all year than men in both 1996 and 1999. For example, in 1999, 10.9% of women were uninsured compared to 13.6% of men.
- In both years, Hispanic and white women were less likely to be uninsured than their male counterparts. In 1999, 24.6% of Hispanic women were uninsured all year compared to 30.0% of Hispanic men, and 7.7% of white women were uninsured compared to 9.9% of white men. The differences between black women and men and between women and men of other racial/ethnic groups were not statistically significant in either 1996 or 1999.
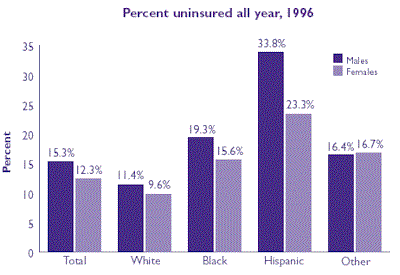 |
Percent of uninsured all year, 1996 |
| |
Male |
Female |
| Total |
15.3% |
12.3% |
| White |
11.4% |
9.6% |
| Black |
19.3% |
15.6% |
| Hispanic |
33.8% |
23.3% |
| Other |
16.4% |
16.7% |
|
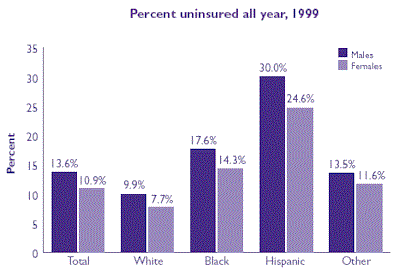 |
Percent of uninsured all year, 1999 |
| |
Male |
Female |
| Total |
13.6% |
10.9% |
| White |
9.9% |
7.7% |
| Black |
17.6% |
14.3% |
| Hispanic |
30.0% |
24.6% |
| Other |
13.5% |
11.6% |
|
Return To Table Of Contents
Section 4: Employment
The primary source of health insurance coverage for Americans is the workplace. However, despite the fact that most Americans obtain their health insurance through employers, employment does not necessarily lead to health insurance for many working Americans and their families. Policymakers have been particularly concerned about the difficulties in obtaining health insurance faced by workers who earn low wages or are employed by small firms. The following charts examine the risk of being uninsured throughout the first half of the year in 1996 through 2000 for working age adults (ages 16-64). Concentrating on this one type of estimate of the uninsured makes it easier to classify workers according to employment characteristics and allows the use of the most recent MEPS data available.
How is employment status associated with uninsured status from 1996 to 2000?
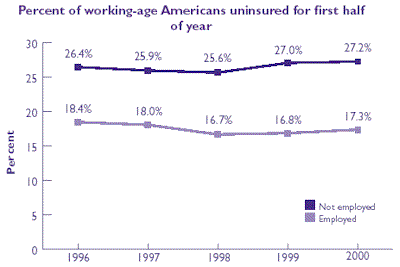
- In each year, working-age adults who were not employed were more likely to be uninsured than those who were employed. In 2000, the percent uninsured throughout the first half of the year was about 10 percentage points higher for people who were not employed (27.2%) than for those who were (17.3%).
- Between 1996 and 2000, the risk of being uninsured throughout the first half of the year did not change for working-age adults who were not employed. However, it declined from 18.4% in 1996 to 16.7% in 1998 for employed individuals.
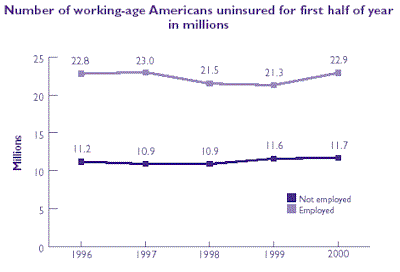
- Many more working-age Americans are employed than not employed (132.5 million vs. 43.2 million individuals in 2000, data not shown). As a result, the number of people uninsured was about twice as high for employed people (22.9 million in 2000) as for people who were not employed (11.7 million).
 |
Percent of working-age wage-earners uninsured for first half of year |
| |
Not employed |
Employed |
| 1996 |
26.4% |
18.4% |
| 1997 |
25.9% |
18.0% |
| 1998 |
25.6% |
16.7% |
| 1999 |
27.0% |
16.8% |
| 2000 |
27.2% |
17.3% |
|
 |
Number of working-age wage-earners uninsured for first half of year in millions |
| |
Not employed |
Employed |
| 1996 |
11.2 |
22.8 |
| 1997 |
10.9 |
23.0 |
| 1998 |
10.9 |
21.5 |
| 1999 |
11.6 |
21.3 |
| 2000 |
11.7 |
22.9 |
|
Return To Table Of Contents
Has the risk of being uninsured changed for part-time and full-time workers?
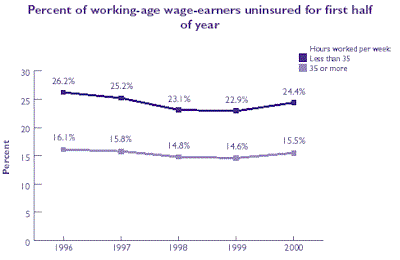
- Because part-time workers are less likely to be offered health insurance, they are much more likely than full-time workers to be uninsured. This pattern is evident in each year from 1996 to 2000, with part-time workers about 8 to 10 percentage points more likely to be uninsured than full-time workers.
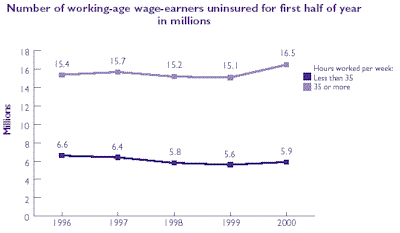
- Many more workers are employed full time than part time (107.3 million vs. 24.5 million individuals in 2000, data not shown). As a result, there were more than 21/2 times as many full-time as part-time uninsured workers in 2000 (16.5 million and 5.9 million, respectively) even though full-time workers were at lower risk of being uninsured.
- There were no statistically significant changes in the percent or number of either part-time or full-time workers who were uninsured over this period.
 |
Percent of working-age wage-earners uninsured for first half of year |
| Year |
Hours worked per week |
| Less than 35 |
35 or more |
| 1996 |
26.2% |
16.1% |
| 1997 |
25.2% |
15.8% |
| 1998 |
23.1% |
14.8% |
| 1999 |
22.9% |
14.6% |
| 2000 |
24.4% |
15.5% |
|
 |
Number of working-age wage-earners uninsured for first half of year in millions |
| Year |
Hours worked per week |
| Less than 35 |
35 or more |
| 1996 |
6.6 |
15.4 |
| 1997 |
6.4 |
15.7 |
| 1998 |
5.8 |
15.2 |
| 1999 |
5.6 |
15.1 |
| 2000 |
5.9 |
16.5 |
|
Return To Table Of Contents
How does the risk of being uninsured differ for wage-earners in establishments of different sizes? Has that risk changed over time?
An establishment is a particular workplace (as opposed to a firm, which can have many establishments or only one). A wage-earner is a worker who is not self-employed.
- Each year from 1996 through 2000, wage-earners in small establishments (less than 25 employees) were much more likely to be uninsured throughout the first half of the year than those in larger establishments. About one quarter of wage-earners in small establishments were uninsured each year, compared to 14-15% of wage-earners in medium-size establishments (25-99 employees) and 7-8% in large establishments (100 or more employees).
 |
Percent of working-age wage-earners uninsured for first half of year |
| Year |
Establishment size |
Less than 25
employees |
25-99
employees |
100 or more
employees |
| 1996 |
26.7% |
14.2% |
8.0% |
| 1997 |
25.2% |
14.9% |
8.2% |
| 1998 |
24.6% |
14.0% |
7.3% |
| 1999 |
22.6% |
14.1% |
8.0% |
| 2000 |
26.0% |
14.1% |
7.1% |
|
Return To Table Of Contents
How does the risk of being uninsured differ for wage-earners in establishments of different sizes? Has that risk changed over time? (continued)
- The percent of wage-earners in small establishments who were uninsured declined from 26.7% in 1996 to 22.6% in 1999. By 2000, it had returned to about the same level as in 1996.
- The percent uninsured among wage-earners in medium-size and large establishments did not change significantly between 1996 and 2000.
- There were about two to three times as many uninsured wage earners in small establishments as in medium-size or large establishments.
 |
Number of working-age wage-earners uninsured for first half of year |
| Year |
Establishment size |
Less than 25
employees |
25-99
employees |
100 or more
employees |
| 1996 |
9.4 |
3.9 |
3.3 |
| 1997 |
9.1 |
4.0 |
3.5 |
| 1998 |
8.9 |
3.7 |
3.2 |
| 1999 |
8.1 |
3.8 |
3.6 |
| 2000 |
9.6 |
3.8 |
3.2 |
|
Return To Table Of Contents
How does the risk of being uninsured differ for low-wage and high-wage workers?
- Being uninsured was about 10 times as likely for workers with the lowest hourly wages (under $10 per hour) as for those with the highest hourly wages ($20 or more per hour), 28.5% vs. 2.8% in 2000.
- Low-wage workers accounted for about two-thirds of all uninsured wage-earners (10.9 million out of a total of 16.7 million uninsured wage-earners in 2000), although they made up only roughly one third of all wage-earners.
- Using inflation-adjusted wages (adjusted to the year 2000), the only group of wage-earners whose risk of being uninsured changed significantly were those earning $10 to $14.99 per hour. For this group, the likelihood of being uninsured increased from 10.6% in 1996 to 12.9% in 2000. However, the number of uninsured wage-earners increased for both those earning $10 to $14.99 per hour (from 3.1 million to 4.0 million) and those earning $15 to $19.99 per hour (from 0.7 million to 1.2 million).
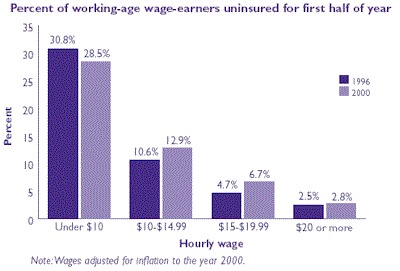 |
Percent of working-age wage-earners uninsured for first half of year |
| Hourly wage |
Year |
| 1996 |
2000 |
| Under $10 |
30.8% |
28.5% |
| $10-$14.99 |
10.6% |
12.9% |
| $15-$19.99 |
4.7% |
6.7% |
| $20 or more |
2.5% |
2.8% |
Note: Wages adjusted for inflation to the year 2000. |
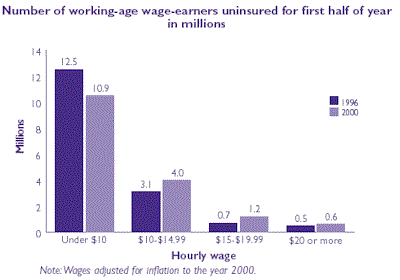 |
Number of working-age wage-earners uninsured for first half of year in millions |
| Hourly wage |
Year |
| 1996 |
2000 |
| Under $10 |
12.5 |
10.9 |
| $10-$14.99 |
3.1 |
4.0 |
| $15-$19.99 |
0.7 |
1.2 |
| $20 or more |
0.5 |
0.6 |
Note: Wages adjusted for inflation to the year 2000. |
Return To Table Of Contents
Conclusions
The data presented in this report show the following:
The percent of the population that is uninsured depends heavily on the time period used in calculating the estimate. MEPS allows for multiple definitions of time periods, including the first half of the year, on average; some point during the year; and the entire year. In 1999, the latest year for which all three measures are available, MEPS data indicate that 25.1% of the population were uninsured at some point during the year, 17.9% were uninsured throughout the first half of the year, and 12.2% were uninsured throughout the entire year.
Examining trends in insurance status, the MEPS data indicate that the percent of the population uninsured at some point during the year declined from 27.0% in 1996 to 25.1% in 1999. The percent uninsured all year declined from 13.8% in 1996 to 12.2% in 1999.
The percent of children uninsured all year declined from 10.4% in 1996 to 7.8% in 1999. The number of children uninsured all year declined by 1.6 million, from 7.0 million in 1996 to 5.4 million in 1999. In each year from 1996 through 1999, the number and percent of children who were uninsured for at least one month during the year were more than double the number and percent uninsured all year.
The risk of being uninsured all year declined for white Americans, from 10.5% in 1996 and 10.8% in 1997 to 8.8% in 1999. For black Americans, the risk of being uninsured at some point during the year declined from 35.9% in 1996 to 29.4% in 1999. Neither measure declined significantly over this time period for Hispanics, the racial/ethnic group most at risk of being uninsured.
Workers with the lowest hourly wages (under $10 per hour) were about 10 times as likely to be uninsured as those with the highest hourly wages ($20 or more per hour), 28.5% vs. 2.8% in 2000. The only wage-earners whose risk of being uninsured changed significantly were those earning $10 to $14.99 per hour. For this group, the likelihood of being uninsured increased from 10.6% in 1996 to 12.9% in 2000.
Return To Table Of Contents
References
Cohen J. Design and methods of the Medical Expenditure Panel Survey Household Component. Rockville (MD): Agency for Health Care Policy and Research; 1997. MEPS Methodology Report No. 1. AHCPR Pub. No. 97-0026.
Cohen S. Sample design of the 1996 Medical Expenditure Panel Survey Household Component. Rockville (MD): Agency for Health Care Policy and Research; 1997. MEPS Methodology Report No. 2. AHCPR Pub. No. 97-0027.
Department of Health and Human Services [US], Assistant Secretary of Planning and Evaluation. Understanding Estimates of the Uninsured: Putting the Differences in Context. Web site:http://aspe.hhs.gov/health/reports/hiestimates.htm.
Accessed March 28, 2002.
Fronstin P, Goldberg L, Robins P. Differences in private health insurance coverage for working male Hispanics. Inquiry 1997; 34(2):171-80.
Monheit A, Vistnes J. Race/ethnicity and health insurance status: 1987 and 1996. Med Care Res Rev 2000; 57(suppl 1):11-35.
Taylor A, Cohen J, Machlin S. Being uninsured in 1996 compared to 1987: how has the experience of the uninsured changed over time? Health Serv Res 2001; 36:16-31.
Weinick R, Zuvekas S, Drilea S. Access to health care—sources and barriers, 1996. Rockville (MD): Agency for Health Care Policy and Research; 1997. MEPS Research Findings No. 3. AHCPR Pub. No. 98-000l.
Please consult the MEPS Web site at http://www.meps.ahrq.gov/ for an updated publications list or additional copies of this publication.
Return To Table Of Contents
Definitions of Terms
Uninsured—People classified as uninsured throughout the first half of the year did not have coverage during the period from January of the survey year through the time of the first interview in that year. These interviews were typically conducted from March to July. People uninsured for the entire year did not have insurance coverage at any time during the survey year. People classified as uninsured at some point during the survey year lacked coverage for at least 1 month during the year
Insured—People were classified as insured if they were covered by Medicare, TRICARE (Armed-Forces-related coverage), Medicaid, other public hospital/physician programs, or private hospital/physician insurance (including Medigap coverage). Individuals covered only by noncomprehensive State specific programs (e.g., Maryland Kidney Disease Program) or private single-service plans (e.g., coverage for dental or vision care only, coverage for accidents or specific diseases) were not considered insured.
Public coverage—For this chartbook, people were considered to have public coverage if they were covered by Medicare, Medicaid, TRICARE, or other public hospital and physician coverage. Private coverage—Private health insurance was defined as nonpublic insurance that provides coverage for hospital and physician care (including Medigap coverage).
Employment status—Working-age people (ages 16-64) were considered to be employed if they had a job for pay, owned a business, or worked without pay in a family business during the first half of the year. Individuals with missing values on employment status (less than 1% of people ages 16-64 in 1996) are excluded from the numbers presented in this report.
Establishment size—An establishment is a particular workplace location. (It differs from a firm, which can have many establishments or just one establishment.) Establishment size is the number of employees at one location rather than the number of employees at all locations for a firm. Individuals with missing values on establishment size (5-7% of wage-earners for each year) are excluded from the numbers presented in this report.
Hourly wages—Hourly wages are presented for wage-earners only, not for the self-employed. They are adjusted for inflation (to the year 2000) using the Consumer Price Index. Individuals with missing values on hourly wages (5-7% of wage-earners for each year) are excluded from the numbers presented in this report.
Return To Table Of Contents
| Suggested Citation: Chartbook #9: The Uninsured in America, 1996-2000. June 2002. Agency for Healthcare Research and Quality, Rockville, MD.
http://www.meps.ahrq.gov/data_files/publications/cb9/cb9.shtml |
|
