Research
Findings #13: Expenses and Sources of Payment for Nursing Home Residents,
1996
by Jeffrey Rhoades, Ph.D., and John Sommers,
Ph.D., Agency for Healthcare Research and Quality
Abstract This report from the Agency for Healthcare Research and Quality presents estimates of total nursing home expenses during 1996. Data are derived from the 1996 Nursing Home Component of the Medical Expenditure Panel Survey (MEPS). Separate estimates are presented for mean expenses per person and per day. The distribution of sources of payment is shown by demographic, financial, and health status characteristics of nursing home users. Differences in expenses by selected personal characteristics are discussed. Expenses for different types of nursing homes are also shown. In 1996, Medicaid contributed 44 percent to total annual nursing home expenditures, Medicare contributed 19 percent, and out-of-pocket payments contributed 30 percent. People with the shortest nursing home stays had the highest annual expenses per patient day.
Introduction
Data pertaining
to the nursing home industry are of critical importance
because of the dramatic growth
in the number of Americans over age 75 and the desire to minimize
the duration of expensive inpatient hospital care. The trend
in long-term care is toward expansion of community-based care
for people with functional limitations. However, there continues
to be a subset of individuals who need sophisticated 24-hour
skilled nursing supervision. A better understanding of the
current nursing home market can contribute to informed decisions
about the provision of long-term care.
National expenses for services in nursing
homes amounted to about $70 billion in 1996, according to
data from the 1996 Medical Expenditure Panel Survey (MEPS)
Nursing Home Component (NHC).1 Thirty
percent of the total was paid out of pocket from Social Security
or pension income or from other income or assets of the sample
person or sample person's family. A small amount (4 percent)
was paid for through private insurance. The Medicaid program
financed most of the remainder (44 percent), Medicare paid
19 percent, and 3 percent of expenditures were paid by other
sources (Department of Veterans Affairs, health maintenance
organization contract, or other). Because most nursing home
care is financed out of pocket or through Medicaid, the prospect
of rapid increases in the number of Americans who are elderly
and at risk for nursing home care has turned the financing
of these services into a matter of intense private and public
concern. State and Federal Medicaid budgets will be stretched
to cover nursing home services for those who cannot afford
this type of care.
The 1996 MEPS NHC, conducted by the Agency
for Healthcare Research and Quality (AHRQ), was a national,
year-long panel survey of nursing homes and their residents
designed to provide estimates of expenses and sources of payment
for all people using nursing homes at any time in 1996. MEPS
is the third in a series of AHRQ-sponsored surveys to collect
information on the health care use and spending of the American
public. The first survey was the 1977 National Medical Care
Expenditure Survey (NMCES), and the second was the 1987 National
Medical Expenditure Survey (NMES). NMES was the first national
expenditure survey to contain an institutional component designed
explicitly to collect detailed medical expense information
on people in long-term care facilities (Potter, 1998).
The estimates
reported here describe the distribution and rates of spending
over the course of a calendar
year from a variety of perspectives for nursing homes and
their residents. First, all people who used a nursing home
during 1996 that is, the people who account for 1996 nursing
home expenses were categorized with respect to their institutional
experience over the course of the year. Those who were institutionalized
all year are distinguished from 1996 admissions, and those
alive at the end of 1996 are distinguished from those who
died in 1996. These distinctions take into account the fact
that people who stayed in a nursing home during the entire
12-month reference period were long-stay patients, but 1996
admissions also include a heavy representation of patients
who were in the nursing home for relatively short periods
of time (often less than 3 months). A more detailed discussion
is provided in the section "Type of Stay."
Previous research has shown that long-stay
and short-stay patients are significantly different in health
status, sociodemographic characteristics, and use and expense
patterns (Dunkle and Kart, 1990; Kemper, Spillman, and Murtaugh,
1991; Spence and Wiener, 1990; Wayne, Rhyen, Thompson, et
al., 1991). Average annual expenses in 1996, annual out-of-pocket
expenses, average daily expenses, and the share of expenses
paid by various third-party sources vary across subgroups
defined by their institutional experience and vital status
at the end of the year. There is also substantial variation
in expense patterns according to the demographic characteristics,
income, and health status of nursing home residents.
To shed light on variations in nursing
home expenses, this report describes average daily nursing
home expenses classified by payment source, geographic location,
and type of facility.
The technical appendix presents details
concerning sample selection, the sources of data, and questionnaire
items, and explains how the estimates were derived. It also
provides information on the construction of variables used
in the analysis and on estimates of standard errors for assessing
the confidence level of the national estimates. Definitions
of terms used in this report are also included. Except as
indicated, only statistically significant differences between
estimates are discussed in the text.
^top
Type of Stay
Resident on January 1, 1996
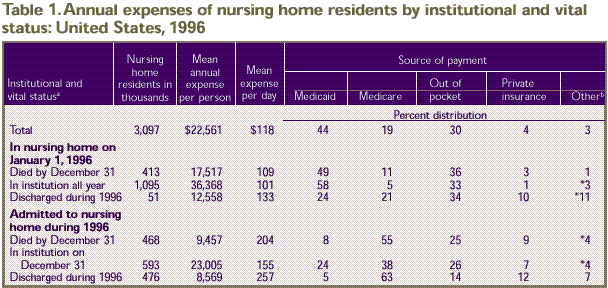
Over one-third of nursing home residents
(1,095,000) were in a nursing home at the beginning of the
year and remained institutionalized through December 31, 1996 (Table
1). Expenses for these residents amounted to $36,368 per
person for the year, or $101 per nursing home day. (This annual
estimate includes fewer than 366 nursing home days for some
full-year nursing home residents with short-term hospital
stays.) Medicaid financed 58 percent of expenses for this
group; 33 percent was paid out of pocket. In addition, 413,000
people residing in nursing homes at the beginning of 1996
had died by the end of the year. Their 1996 average expenses
($17,517) were less than half the expenses of those who survived
in a nursing home beyond 1996. Their average expense per day
($109) was greater and their reliance on Medicaid (49 percent)
as a source of payment was less when compared to full-year
residents.
Admitted During 1996
Of residents admitted to nursing homes
in 1996, 593,000 people remained institutionalized beyond
the end of the year. Their average expense per day ($155)
was higher than the expense for full-year residents. The share
of their annual expense paid out of pocket (26 percent) was
similar to the average for all residents (30 percent), while
the share paid by Medicaid was lower (24 percent, compared
to 44 percent for all nursing home residents). Another 468,000
people admitted in 1996 had died by the end of the year. Their
average daily expense ($204) was higher than the average for
all nursing home users ($118), and the proportion paid by
Medicaid was considerably lower (8 percent) than for full-year
residents. A relatively large share was paid by Medicare (55
percent), and 25 percent was paid out of pocket.
Most of the
527,000 nursing home users who were discharged to the community
during 1996 were part
of the 1996 admissions cohort (476,000). The average daily
nursing home expenses for those admitted and discharged during
the year were high—$257. At $8,569, their annual nursing
home expenses were less than half the average ($22,561), indicating
a shorter nursing home stay. In 1996 such individuals averaged
a length of stay of just 33 days, compared to an average stay
of 191 days for the total nursing home population (data not
shown). The high daily expenses could reflect, in part, an
increased intensity and concentration of nursing home services.
The majority of the expenses for this group (63 percent) were
paid for by Medicare. The Medicare share was similar to that
for the 1996 admissions who had died by the end of the year
(55 percent). Medicaid coverage (5 percent) was virtually
the same as that for 1996 admissions who had died by the end
of the year (8 percent). Private health insurance paid for
12 percent of nursing home expenses for residents admitted
and discharged during the year.
In percentage terms (derived from Table
1), 35 percent of nursing home users were institutionalized
all year and 13 percent died during 1996 after beginning
the year in a nursing home. Nineteen percent of the total
nursing home population were admitted in 1996 and survived
beyond the end of the year, and 15 percent of the total
were admitted in 1996 and had died by the end of the year.
The remainder of the nursing home population (17%) were
discharged during the year.
^top
Characteristics
of Residents
The variation in expenses and sources
of payment across subgroups of nursing home residents is only
partly explained by differences in institutional status over
the year. Tables 2–4 show
variation by other nursing home resident characteristics.
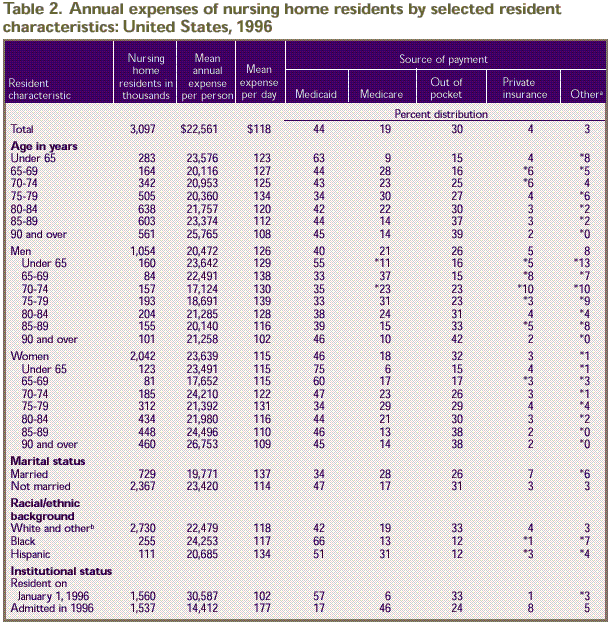
Annual nursing home expenses, except those for people under
65, tended to increase with increasing age, while the average
expense per nursing home day tended to decrease. Higher annual
expenses coupled with lower daily expenses for older residents
indicates that nursing home stays were longer for such residents (Table
2). In 1996 the average length of stay ranged from 158
days for residents ages 65–69 to 239 days for those 90
and over (data not shown). In addition, nursing home care
was possibly of a more custodial nature as the age of the
nursing home resident increased. Women age 85 and over were
the age-sex group most likely to be institutionalized all
year (data not shown), but compared with women under age 70,
a smaller share of their expenditures was financed by Medicaid
and a larger share was paid out of pocket.
Demographic Characteristics
In general, the proportion of expenses
paid for by the different sources of payment varied more with
age than annual and daily expenses did (Table
2). Women were more likely than men to have longer stays
in 1996 (206 and 163 days, respectively; data not shown).
This is reflected in women's annual expenses, which were substantially
higher ($23,639 vs. $20,472), while their daily expenses were
lower than those for men ($115 vs. $126). Lower daily expenses
for women may also indicate that women received a less concentrated
delivery of nursing home services than men. The share of expenditures
paid by Medicare was similar for women and men. In contrast,
women paid a greater proportion of their expenses with Medicaid
and out-of-pocket sources of payment
The expenses of married residents averaged
$137 per day, compared to $114 for unmarried residents. However,
married residents averaged $19,771 in annual expenses (in
contrast to $23,420 for unmarried residents) because married
residents tended to have shorter stays in 1996 (144 days,
as opposed to 205 days for unmarried residents). The higher
daily expense for married residents could also be a function
of a greater intensity in the use of nursing home services.
Thirty-four percent of the expenses of married residents were
paid for by Medicaid, compared to 47 percent for the unmarried.
In contrast, married residents relied to a greater extent
on Medicare (28 percent) and private insurance (7 percent)
when compared to unmarried users (17 and 3 percent, respectively).
Sources of payment varied with respect
to race and ethnicity, although there were no differences
in annual or daily expenses by racial/ethnic groups. Whites
and others (others are included with whites because of small
sample size) paid for 33 percent of their nursing home expenses
out of pocket. Blacks and Hispanics both paid 12 percent of
their expenses out of pocket.
Annual expenses, daily expense, and sources
of payment varied by institutional status. People residing
in a nursing home on January 1, 1996, had greater annual expenses
than those admitted during the year ($30,587 vs. $14,412)
and lower daily expenses ($102 vs. $177), and they relied
more heavily on Medicaid (57 percent vs. 17 percent) and out
of pocket (33 percent vs. 24 percent) as sources of payment.
Nursing home residents admitted in 1996 had a greater proportion
of their nursing home bill paid for by Medicare than continuing
residents had (46 percent compared to 6 percent) and also
relied more on private insurance (8 percent compared to 1
percent).
Poverty Level, Home Ownership, and Medicaid
Status
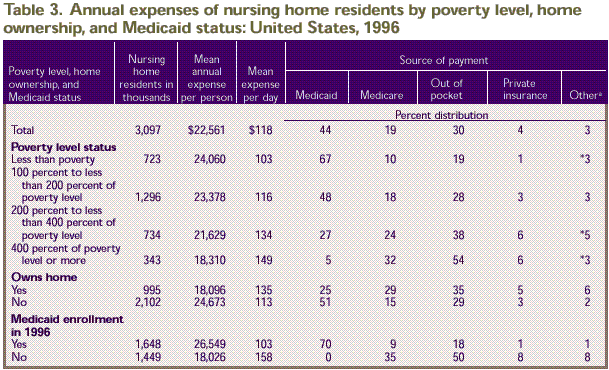
Average expenses per day increased
with annual income, from $103 per day in the lowest income group
to $149 in the highest income group (Table 3).
Annual expenses exhibited just the opposite pattern, decreasing
from $24,060 for the lowest income group to $18,310 for the highest
income group. The share of expenses paid out of pocket increased
with income. Medicaid paid 67 percent of 1996 nursing home expenses
for the lowest income group, compared to just 5 percent for nursing
home residents with incomes of four times or more the poverty
level. While the Medicaid share of expenses for people in the
lowest income group was substantial, they still paid for 19 percent
of nursing home expenses out of pocket.
Residents who owned a home at the date
of interview had lower annual but higher daily expenses than
those who did not own a home. Home owners had annual expenses
of $18,096 and daily expenses of $135, compared to $24,673
and $113, respectively, for residents who were not home owners.
Sources of payment also varied by home ownership. Home owners
paid a greater proportion of their expenses through Medicare
(29 percent vs. 15 percent) and out of pocket (35 percent
vs. 29 percent) and relied less on Medicaid (25 percent vs.
51 percent) than residents who did not own a home.
Medicaid enrollees averaged more in annual
nursing home expenses than people not on Medicaid ($26,549
per year vs. $18,026) but had a lower daily expenditure rate
($103 vs. $158). Residents without Medicaid support paid 50
percent of their expenses out of pocket, for an average of
$9,013 per person for the year. Those enrolled in Medicaid
at some point in 1996 paid 18 percent of their own expenses
($4,779). In addition to paying more out of pocket, residents
without Medicaid relied more heavily on Medicare (35 percent
vs. 9 percent for Medicaid enrollees), private insurance (8
percent vs. 1 percent), and other sources of payment (8 percent
vs. 1 percent).
Functional and Mental Health Status
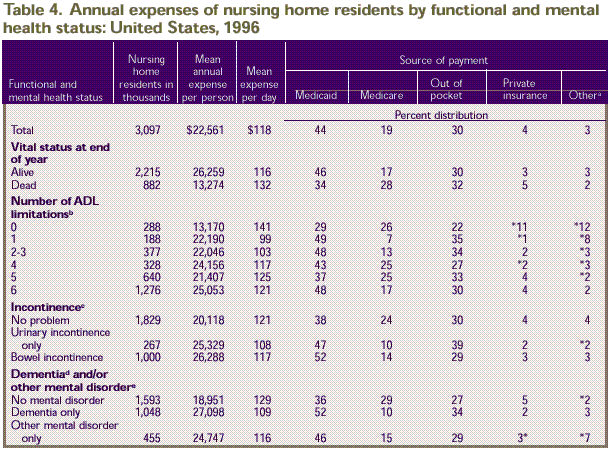
Residents who died during the year had
lower annual nursing home expenses ($13,274) and higher daily
expenses ($132) than residents who were alive at the end of
the year ($26,259 and $116, respectively), as shown in Table
4. Those who died during the year also relied less on
Medicaid (34 percent) and more on Medicare (28 percent) when
compared to those alive at the end of the year (46 and 17
percent, respectively).
Mean annual expenses were lowest ($13,170)
for residents with no limitations in activities of daily living
(ADLs), while their daily expense ($141) was high, reflecting
the fact that these individuals tended to have short stays
(93 days on average in 1996; data not shown) and may have
required a greater concentration of nursing home services.
For residents having one to six ADL limitations, the trend
was for a general increase in average daily expenses, ranging
from $99 for people with one ADL limitation to $125 for those
with five ADL limitations (Table
4).
There was no
difference between the three different categories of incontinence
with respect to daily
expenses ($108–$121). However, residents having urinary
incontinence only or bowel incontinence (with or without urinary
incontinence) had higher annual expenses than those with no
incontinence. This reflects the tendency for incontinent residents
to remain in the nursing home for longer periods of time.
In 1996, average length of stay was 234 days for those with
urinary incontinence only and 225 days for those with bowel
incontinence, compared to 166 days for those without incontinence
(data not shown).
Annual expenses were less for nursing
home residents without mental disorders ($18,951 per person)
than for residents with dementia but no other mental disorder
($27,098). However, those without mental disorders had a higher
daily expense than those with dementia alone, $129 vs. $109.
Residents with no mental disorder had only 36 percent of their
annual expenses paid for by Medicaid, a smaller portion than
for residents with some type of mental disorder. However,
residents with no mental disorders had a greater portion of
annual expenses paid for by Medicare (29 percent) than any
other group.
Figure 1 shows
the distribution of nursing home residents by their out-of-pocket
expenses. Forty-three percent of all users spent $1,000 or
less out of pocket, including 36 percent who incurred no out-of-pocket
expenses; 20 percent spent between $1,001 and $5,000, and
18 percent spent between $5,001 and $10,000. Twelve percent
spent between $10,001 and $30,000, and 7 percent exceeded
$30,000.
^top
Facility Characteristics
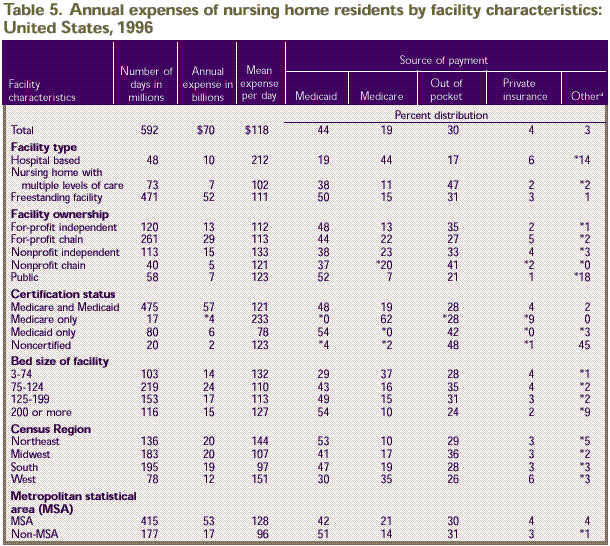
Estimates of average daily expenses indicate
variations in nursing home rates by type of nursing home (Table
5). Individuals in hospital-based nursing homes had a
higher daily expense ($212) than those in freestanding nursing
homes ($111) or nursing homes with multiple levels of care
($102). In addition, residents in hospital-based facilities
were more likely than residents in other types of nursing
homes to rely on Medicare (44 percent) and other (14 percent)
sources of payment and less likely to have their expenses
paid by Medicaid (19 percent) or out of pocket (17 percent).
With respect to nursing home ownership, total annual expenses
were highest in for-profit chain-affiliated nursing homes
($29 billion).
Total annual and average daily expenses
also varied by nursing home certification status. As would
be expected, residents in nursing homes certified by Medicaid
had the largest proportion of their annual expenses paid for
by Medicaid, whether solely Medicaid certified (54 percent)
or dually certified for Medicaid and Medicare (48 percent).
Residents of Medicare-only certified nursing homes had the
highest daily expense ($233), but such payments represented
only a small proportion of the Nation's total annual nursing
home expenditures. For residents in noncertified nursing homes,
the major payers were out of pocket and other source-of-payment
categories. The other source-of-payment category consisted
largely of Department of Veterans Affairs and health maintenance
organization contractual payers.
With regard
to bed size, residents in the smallest nursing homes, 3–74 beds, had a greater
proportion of their annual expenses paid for by Medicare (37
percent) than residents in larger homes. Individuals residing
in the remaining size categories had a greater proportion
of their annual expenses paid for by Medicaid (from 43 to
54 percent) than residents in the smallest homes did. The
greatest proportion of the $70 billion in annual expenses
($24 billion) was represented by residents in homes with 75–124
beds.
^top
Summary
MEPS NHC findings indicate that 1996 annual
nursing home expenses per person with a nursing home stay
averaged $22,561, for an average daily expense of $118. Total
expenses for services in nursing homes amounted to about $70
billion. There was considerable variation in the expenses
and sources of payment for different types of nursing home
residents in different types of facilities.
Thirty-five percent of the 3,097,000 nursing
home residents in 1996 remained in an institution for the
entire year, paying an average of $12,001 per person out of
pocket and incurring total expenses of $36,368 per year. Fifteen
percent of residents were admitted and died in 1996. Their
daily expense was $103 greater than the expense for those
who remained in the nursing home the entire year, but their
total expenses averaged only $9,457 for the year.
Average annual expenses were highest for
women age 90 and over, Medicaid enrollees, residents with
dementia and/or other mental disorders, residents with bowel
incontinence (with or without urinary incontinence), and those
who remained in the nursing home for the entire year. Annual
expenditures were lowest for residents who were discharged
from the nursing home during the year ($8,569).
Average daily expenses were in excess
of $200 for admissions who died during 1996, admissions who
were discharged during the year, and people residing in hospital-based
homes or homes certified for Medicare only. Average expenses
per day were less than $100 for residents with one ADL limitation,
those in facilities certified only for Medicaid, and those
in nursing homes located in the South and in nonmetropolitan
areas.
Medicaid payments for nursing home care
exceeded public payments from any other source, amounting
to 44 percent of the national total and $18,584 (derived from Table
3) per Medicaid enrollee who used a nursing home in 1996.
Medicaid enrollees represented 53 percent of all 1996 nursing
home residents. Medicaid figured most importantly as a payment
source for nursing home residents under age 65, for blacks,
for those who remained in the nursing home the entire year,
and for those with family income less than the poverty level.
While the Medicaid share of nursing home
expenses was substantial, 30 percent of nursing home expenditures
were covered by out-of-pocket payments. Private insurance
contributions to nursing home care amounted to 4 percent of
the total and were concentrated on residents admitted and
discharged from the nursing home during the year (for whom
they constituted 12 percent of total payments) and those with
no ADL limitations (11 percent of total expenses). Nineteen
percent of all nursing home users spent more than $10,000
out of pocket in 1996, and 7 percent spent more than $30,000.
^top
References
Bethel J, Broene
P, Sommers JP. Sample design of the 1996 Medical Expenditure
Panel Survey Nursing
Home Component. Rockville (MD): Agency for Health Care Policy
and Research; 1998. MEPS Methodology Report No. 4. AHCPR Pub.
No. 98–0042.
Dunkle R, Kart C. Long-term care. In:
Ferraro K, editor. Gerontology: perspectives and issues. New
York: Springer Publishing Company; 1990.
Kemper P, Spillman
B, Murtaugh C. A lifetime perspective on proposals for financing
nursing home care.
Inquiry 28:333–344, 1991.
Levit K, Lazenby
H, Braden B, et al. National Health Expenditures, 1996.
Health Care Financing Review 19(1):161–200,
1997.
Potter DEB.
Design and methods of the 1996 Medical Expenditure Panel
Survey Nursing Home Component.
Rockville (MD): Agency for Health Care Policy and Research;
1998. MEPS Methodology Report No. 3. AHCPR Pub. No. 98–0041.
Shah BV, Barnwell BG, Bieler GS. SUDAAN
user's manual: software for the statistical analysis of correlated
data. Research Triangle Park (NC): Research Triangle Institute;
1995.
Spence D, Wiener
J. Nursing home length of stay patterns: results from the
1985 National Nursing Home
Survey. The Gerontologist 30(1):16–20, 1990.
U.S. Bureau of the Census. Statistical
abstract of the United States: 1996 (116th edition). Washington;
1996.
Wayne S, Rhyen
R, Thompson R, et al. Sampling issues in nursing home research.
Journal of the American Geriatrics
Society 39:308–311, 1991.
^top
Tables
a Vital status
by end of year.
b Other payers include Department of Veterans
Affairs, health maintenance organizations, and other sources
of payment.
* Relative standard error is equal to or greater than 30 percent.
Source: Center for Financing, Access,
and Cost Trends, Agency for Healthcare Research and Quality:
Medical Expenditure Panel Survey Nursing Home Component.
a Other payers include Department
of Veterans Affairs, health maintenance organizations, and
other sources of payment.
b Includes other racial/ethnic groups not shown
separately.
* Relative standard error is equal to or greater than 30 percent.
Note: 0 indicates greater than
zero but less than 0.5.
Source: Center for Financing, Access,
and Cost Trends, Agency for Healthcare Research and Quality:
Medical Expenditure Panel Survey Nursing Home Component.
a Other payers include Department
of Veterans Affairs, health maintenance organizations, and
other sources of payment.
* Relative standard error is equal to or greater than 30 percent.
Source: Center for Financing, Access,
and Cost Trends, Agency for Healthcare Research and Quality:
Medical Expenditure Panel Survey Nursing Home Component.
a Other payers include Department
of Veterans Affairs, health maintenance organizations, and
other sources of payment.
b Receiving personal assistance with one or more
of these activities of daily living (ADLs): dressing, bathing,
eating, transferring from a bed or chair, mobility, and
toileting.
c Has difficulty controlling bladder or bowel
several times or more per week. Persons with both types
of incontinence are included in the group with bowel incontinence.
d Includes Alzheimer's and other dementias.
e Includes at least one of the following: anxiety
disorder, depression, manic depression, schizophrenia.
* Relative standard error is equal to or greater than 30 percent.
Source: Center for Financing, Access,
and Cost Trends: Agency for Healthcare Research and Quality:
Medical Expenditure Panel Survey Nursing Home Component.
a Other payers include Department
of Veterans Affairs, health maintenance organizations, and
other sources of payment.
* Relative standard error is equal to or greater than 30 percent.
Note: 0 indicates greater than
zero but less than 0.5.
Source: Center for Financing, Access,
and Cost Trends, Agency for Healthcare Research and Quality:
Medical Expenditure Panel Survey Nursing Home Component.
^top
Figure

Source: Center
for Financing, Access, and Cost Trends, Agency for Healthcare
Research and Quality: Medical Expenditure Panel Survey Nursing
Home Component, 1996.
There were substantial
regional differences in expenses. Of all the regions, the West
had the lowest total annual expenses ($12 billion), the lowest
share paid by Medicaid (30 percent), and the highest share
paid by Medicare (35 percent). Annual expenses were comparable
for individuals in the remaining regions, but daily expenses
ranged from a low of $97 in the South to a high of $151 in
the West.
Residents in metropolitan
areas had a higher average daily expense than those in less urbanized
areas ($128 vs. $96), a greater proportion of annual expenses
paid by Medicare (21 percent vs. 14 percent), and a lower proportion
paid by Medicaid (42 percent vs. 51 percent).
^top
Technical Appendix
Data Sources and Methods
of Estimation
The data in this report were obtained
from a nationally representative sample of nursing homes from
the Nursing Home Component (NHC) of the 1996 Medical Expenditure
Panel Survey (MEPS). The sampling frame was derived from the
updated 1991 National Health Provider Inventory. The NHC was
primarily designed to provide unbiased national and regional
estimates for the population in nursing homes, as well as
estimates of these facilities and a range of their characteristics.
The sample was selected using a two-stage
stratified probability design, with facility selection in
the first stage. The second stage of selection consisted of
a sample of residents as of January 1, 1996, and a rolling
sample of persons admitted during the year (Bethel, Broene,
and Sommers, 1998). Estimates in this report are based on
815 eligible responding facilities and 5,899 sample persons.
The MEPS NHC data analyzed here were collected
in person during three rounds of data collection. A computer-assisted
personal interview (CAPI) system was used for data collection.
The entire three-round data collection effort took place over
a 1 1/2 year period, with the reference period being January
1, 1996, to December 31, 1996 (Potter, 1998).
Facility data were obtained from a facility
questionnaire during Round 1 of data collection. Respondents
were facility administrators or designated staff. The facility
questionnaire collected data on facility structure and characteristics
(Potter, 1998).
The facility and community background
sections were used to collect demographic information from
records within the sampled nursing home, as well as from respondents
in the nursing home or community. The facility background
section was administered just once per person, during the
round in which the person was sampled, while the community
background section was administered in either Round 2 or 3
(Potter, 1998).
Most of the health status items collected
in the nursing home were based on the Resident Assessment
Form of the Health Care Financing Administration (HCFA), known
as the minimum data set (MDS). The CAPI application collected
the MDS information in a question format, with question wording,
response categories, and definitions of concepts derived directly
from the MDS. There are multiple versions of the MDS. MEPS
health status questions were based on wording in Version 2
of the MDS. Health status items not based on the MDS were
labeled as such so that interviewers could cue the respondent
to check medical records to obtain the information (Potter,
1998).
The expenditures section of the person-level
facility questionnaire collected data on the costs of nursing
home care during 1996. The data collected included information
on the facility's billing practices, such as the length of
the billing period, the number of days billed for each billing
period, and the rate or rates billed for a person's care.
The section also included information, by billing period,
on all payments received by the facility, the sources of payment
for those services, and the amounts paid by each source of
payment. Expenditure data were first collected in eligible
nursing homes during Round 2 and collected again during Round
3. Typical respondents were facility billing office personnel,
who referred to billing and payment records (Potter, 1998).
The MEPS estimate of national expenditures
for services in nursing homes is $70 billion, considerably
less than the $89 billion estimate for 1996 expenditures from
HCFA's National Health Expenditures (NHE). The NHE figure
includes approximately $1.5 billion in nonpatient revenues,
including philanthropic expenditures, and $9 billion in Medicaid
payments to intermediate care facilities for the mentally
retarded (ICF-MR expenditures). These are excluded from the
MEPS estimate of nursing home expenditures. Thus the NHE estimate
most comparable to the MEPS estimate would be about $78.5
billion (includes $9.0 billion for hospital-based nursing
homes from the hospital spending category of NHE), which is
$8.5 billion more than the MEPS estimate (Levit, Lazenby,
Braden, et al., 1997).
Additionally, the following are possible
sources of the observed discrepancy in expenditure estimates.
- NHE estimates are facility-based estimates.
If a facility is defined as providing nursing care, then
all revenue/receipts to that facility are included in expenditure
estimates. There is the possibility that expenditures for
unlicensed nursing home beds (e.g., assisted living beds
in an assisted living unit) contained within or associated
with the nursing home could be included in expenditure estimates.
For MEPS, approximately 10 percent of beds contained within
sampled nursing homes or associated with them as part of
a larger facility were excluded from expenditure estimates
because they were identified as unlicensed nursing home
beds.
- The NHE are more inclusive than MEPS
with respect to how a nursing home is defined. The following
facilities were included in the NHE but not MEPS: establishments
primarily engaged in providing some (but not continuous)
nursing and/or health-related care, such as convalescent
homes for psychiatric patients that have health care; convalescent
homes with health care; domiciliary care with health care;
personal care facilities with health care; personal care
homes with health care; psychiatric patient convalescent
homes; and rest homes with health care. NHE estimates do
not provide expenditure totals for such facilities separately.
- MEPS excludes nursing homes with fewer
than three beds, while NHE has no limitation because of
the number of nursing home beds.
- MEPS estimates
are based on 16,760 facilities, while NHE estimates are
based on 18,600—an additional
1,840 facilities.
There are also differences in expenditure
estimates methodology. The MEPS estimate of nursing home expenditures
is based on information obtained from the billing records
of each facility used by a sampled person. Total expenditures
for each person and the amounts paid out of pocket and by
third parties were obtained from these records. HCFA, in generating
NHE estimates, uses information collected by the Census Bureau
on State-level receipt/revenue for taxable and tax-exempt
private nursing and personal care facilities from the 1992
Census of Service Industries (CSI). Expenditures for 1996
were generated from the Census Bureau's estimated annual growth
in nursing and personal care facilities taxable and tax-exempt
receipts/revenues from the Service Annual Survey. An estimate
of expenditures for State and local government facilities
is added to the estimated expenditures for private facilities.
Expenditures for State and local government facilities were
estimated from Bureau of Labor Statistics wage data for State
and local government nursing homes. Government nursing home
wages were inflated to revenues based on wage-to-revenue ratios
for private nursing homes that were developed from data collected
by the National Center for Health Statistics in the 1977 National
Nursing Home Survey.
Facility
Eligibility
Only nursing homes were eligible for inclusion
in the MEPS NHC. To be included as a nursing home, a facility
must have at least three beds and meet one of the following
criteria:
- The facility or a distinct portion of
the facility must be certified as a Medicare skilled nursing
facility (SNF).
- The facility or a distinct portion of
the facility must be certified as a Medicaid nursing facility
(NF).
- The facility or a distinct portion of
the facility must be licensed as a nursing home by the State
health department or by some other State or Federal agency
and provide onsite supervision by a registered nurse or
licensed practical nurse 24 hours a day, 7 days a week (Bethel,
Broene, and Sommers, 1998).
By this definition, all SNF- or NF-certified
units of licensed hospitals are eligible for the sample, as
are all Department of Veterans Affairs (VA) long-term care
nursing units. In such cases, and in the case of retirement
communities with nursing facilities, only the long-term care
nursing unit(s) of the facility were eligible for inclusion
in the sample. If a facility also contained a long-term care
unit that provided assistance only with activities of daily
living (e.g., a personal care unit) or provided nursing care
at a level below that required to be classified as a nursing
facility, that unit was excluded from the sample (Potter,
1998).
Resident Sample
To allow a chance of selection for all
persons in this universe, two samples of persons were selected
within each cooperating sampled facility: (1) a cross-sectional
sample of persons who were residents on January 1, 1996 (current
residents) and (2) a sample of persons admitted to the nursing
home at any time during 1996 who had no prior admissions to
an eligible nursing home during 1996 (first admissions). For
details on sampling, refer to Bethel, Broene, and Sommers
(1998).
During Round 1 the interviewer in each
sampled facility compiled a list of current residents as of
January 1, 1996. Within each facility, a systematic random
sample of four current residents was drawn using the CAPI
system. For Rounds 2 and 3, the interviewer compiled a list
of first admissions. A systematic random sample of two first
admissions was drawn for each round and facility.
For a sampled
resident to be considered a respondent, the following questionnaires
had to have been
completed for him or her—the facility residence history
questionnaire in the sampled facility in the round in which
the person was first sampled, as well as at least three of
the following questionnaires: health status, expenditures,
prescribed medicines, and use of medical provider services.
Mean Expense Per Day
and Annual Estimates
Expenditures for nursing home services,
reported in Tables 1–5,
refer to the facility charge for both basic (room and board)
and ancillary (special supplies and services) services. These
charges are limited by the amounts allowed by third-party
payers such as Medicaid, Medicare, and private health insurers.
Missing daily basic expenditures were
imputed for all billing periods in a facility by means of
a weighted sequential hot-deck procedure. This procedure,
which was employed for less than 5 percent of all billing
periods in 1996, imputed data from individuals with expenditure
information to individuals with missing information but similar
characteristics. Groups of similar individuals were formed
according to facility location and type, sources of payment,
Medicaid and Medicare status, family income, and number of
limitations in activities of daily living. Daily expenditures
and sources of payment for persons missing data for some but
not all billing periods in a facility were assigned values
based on the available data for that person. Facilities without
charges (Department of Veterans Affairs nursing homes) were
assigned a facility-level charge based on information provided
by the VA. The VA provided facility-level nursing home rates
for all VA nursing homes within the United States. These rates
were then matched with the small number of VA nursing homes
that were sampled.
Definitions
of Variables
Age
The age of the sample person as of January
1, 1996, was calculated from the date of birth (1996 minus
year of birth) supplied by the respondent. If the date of
birth was unknown, the respondent was asked to provide the
age of the sample person. If the year of birth and age were
both missing (three sample persons), the age of the sample
person was imputed using a mean value imputation, cross-classified
by sex and institutional status.
Marital Status
A constructed
and imputed version of marital status at baseline was used
for estimates. Baseline was measured
at January 1, 1996, for current residents, and at the date
of admission for persons sampled as an admission. Marital
status was collapsed to married and not married (includes
two sample persons less than 15 years of age). The marital
status of sample persons with a value of "don't know" for
marital status (less than 1 percent) was imputed to the modal
value (not married).
Racial/Ethnic Background
Respondents
were asked if the race of each resident was best described
as American Indian, Alaska
Native, Asian or Pacific Islander, black, white, or other.
Race was unknown for eight sample persons; their race was
imputed to the modal value (white). During variable construction
and editing, the "other specified" text fields associated
with an "other race" response were reviewed and
recoded into existing categories of racial/ethnic background
as appropriate. Ethnicity was unknown for less than 1 percent
of the sample (39 sample persons). Missing values for these
cases were imputed to a modal value (non-Hispanic). Estimates
of racial/ethnic background were collapsed into three categories:
white, black, and Hispanic. Other racial/ethnic groups are
included in the white category rather than presented separately
because of small sample size.
Income and Home Ownership
Information on income was collected in
the income and assets section of the community questionnaire.
Income was constructed based on edited versions of the sample
person's gross income and spouse's gross income (if the sample
person was married). All missing values for gross household
income were imputed. The imputation model for gross household
income was run on all households with nonzero income levels.
A natural logarithmic transformation of gross household income
was used to reduce the influence of outliers. Hard boundary
categories were used based on responses to a series of unfolding
questions on income as a percent of the poverty level (based
on marital status and age of the sample person) and Medicaid
eligibility status. The soft boundaries used were marital
status (married vs. not married), education (high school graduate
vs. not), Census Region, age (less than 62 vs. 62 and over),
race (white vs. not white), and sex, in that order. Almost
50 percent of the values for gross income were imputed.
Information on home ownership status at
the date of interview was collected in the income and assets
section of the community questionnaire as well. Additional
information on home ownership was collected in the expenditure
questionnaire and the background section of both the facility
and community questionnaires. This additional information
was used to fill in any missing values. The final edited version
of home ownership reflects information from the four different
sources. When home ownership was unknown, a value was imputed
using a weighted sequential hot-deck procedure. Less than
15 percent of the values for home ownership were imputed.
The reference period for questions pertaining
to income and home ownership was determined by the round in
which the questionnaire was administered. This means that
income and home ownership variables contain values representing
two reference periods. For example, income refers to 1995
when the questionnaire was administered in Round 2 and 1996
when the questionnaire was administered in Round 3.
Poverty Status
Poverty level status was constructed from
gross household income using poverty thresholds published
annually by the U.S. Bureau of the Census. Poverty thresholds
varied by family size (one vs. two persons) and age of householder
(sample person 65 and over vs. under age 65). In the few instances
where family size was greater that two, the poverty thresholds
for family size equal to two were used. Since the reference
period for income was determined by the round of interview,
1995 poverty thresholds were used for sample persons with
responses in Round 2 and 1996 values were used for those with
responses in Round 3.
Activities of Daily Living
Respondents
were asked to indicate whether the sample person had limitations
with personal care activities
commonly known as activities of daily living (ADLs). Six activities
were included: dressing, bathing, eating, transferring from
a bed or chair, mobility, and toileting. Less than 1 percent
of all sample persons were comatose and initially had all
ADLs classified as "inapplicable." These cases,
along with all cases for whom it was indicated that the "activity
did not occur" (less than 2 percent of the total), were
reclassified as having limitations with all ADLs. Persons
with missing data (not more than 1 percent of the total sample
for any ADL) were assumed to have no difficulty with activities
and were reclassified as having no limitations.
Incontinence
Data on bladder
and bowel control were collected from the MDS and refer
to continence in the last
14 days. Residents were classified as incontinent if the response
indicated that they were incontinent or frequently incontinent.
Residents reported to be continent, usually continent, or
occasionally incontinent were classified as having no incontinence.
Responses for bladder and bowel control were collapsed into
three categories: no incontinence; urinary incontinence only;
and bowel incontinence, with or without urinary incontinence.
Less than 1 percent of the sample total were comatose and
initially classified as "inapplicable." These cases
were reclassified as incontinent. Persons with missing data
("don't know") were assumed to have no difficulty
with bowel and/or bladder control and were reclassified as
continent.
Mental Conditions
A question regarding the sample person's
diagnoses and conditions was presented in a list format similar
to that used in the MDS assessment form. It included Alzheimer's
disease; anxiety disorder; dementia, other than Alzheimer's;
depression; manic depression; and schizophrenia.
Facility Type
This variable, constructed from data from
the facility questionnaire, defines the facility's organizational
structure as one of three types:
- Hospital-based nursing home. This
indicates that the sampled nursing home was part of a hospital
or was a hospital-based Medicare SNF.
- Nursing home with multiple levels
of care. This category includes continuing care retirement
communities (CCRCs) and retirement centers that have,
in addition to a nursing home or nursing home unit, independent
living and/or personal care units. It also includes nursing
homes that contain personal care units and non-hospital-based
nursing homes with a separate unit in which personal care
assistance is provided.
- Freestanding facilities. This
category refers to nursing homes with only nursing home
beds. It includes a small number of nursing homes (less
than 1 percent) with an intermediate care unit for the mentally
retarded (ICF-MR).
The order of priority for coding facility
type followed the sequence listed above.
Facility Ownership
Respondents reported the ownership type
that best described their facility (or larger part of the
facility, if the sampled nursing home was part of a larger
facility), as follows:
- For profit (i.e., individual, partnership,
or corporation).
- Private nonprofit (e.g., religious group,
nonprofit corporation).
- One of four
types of public ownership—city/county
government, State government, VA, or other Federal agency.
Respondents also reported whether their
facility was part of a chain or group of nursing facilities
operating under common management.
Facility Certification Status
Respondents were asked whether any unit
in their facility or part of the larger facility (if the sampled
nursing home was reported to be part of a larger facility)
was certified by Medicare as an SNF and/or by Medicaid as
an NF. For the purpose of this report, facilities were assigned
to mutually exclusive categories based on their responses.
Facility Size
The size of the sampled nursing home was
determined by the number of nursing beds regularly maintained
for residents. Beds contained within the sampled nursing home
but not licensed for nursing care were excluded. Unlicensed
beds represented less than 2 percent of the beds in the sampled
nursing homes. If the sampled nursing home was part of a larger
facility, only the licensed nursing home beds were included.
Census Region
Sampled nursing
homes or units were classified in one of four regions—Northeast, Midwest, South, and
West—based on their geographic location according to
the MEPS NHC sampling frame. These regions are defined by
the U.S. Bureau of the Census.
Facility Location
A metropolitan statistical area (MSA)
is defined as including (1) at least one city with 50,000
or more inhabitants or (2) a Census Bureau-defined urbanized
area of at least 50,000 inhabitants and a total metropolitan
population of at least 100,000 (75,000 in New England) (U.S.
Bureau of the Census, 1996). MSA data were missing for 14
facilities; an MSA/non-MSA determination was made after a
review of the county's population density according to the
1990 census.
Reliability
and Standard Error Estimates
Since the statistics presented in this
report are based on a sample, they may differ somewhat from
the figures that would have been obtained if a complete census
had been taken. This potential difference between sample results
and a complete count is the sampling error of the estimate.
The chance that an estimate from the sample
would differ from the value for a complete census by less
than one standard error is about 68 out of 100. The chance
that the difference between the sample estimate and a complete
census would be less than twice the standard error is about
95 out of 100.
Tests of statistical significance were
used to determine whether differences between estimates exist
at specified levels of confidence or whether they simply occurred
by chance. Differences were tested using Z-scores having asymptotic
normal properties, based on the rounded figures at the 0.05
level of significance.
Estimates with a relative standard error
greater than 30 percent are marked with a footnote. Such estimates
cannot be assumed to be reliable.
Rounding
Estimates of percentages presented in
the tables have been rounded to the nearest percent. The rounded
estimates, including those underlying the standard errors,
will not always add to 100 percent or the full total. To avoid
conveying a false sense of precision, estimates of the number
of nursing home users have been rounded to the nearest thousand,
and estimates pertaining to expenditures have been rounded
to the nearest dollar.
Standard Errors
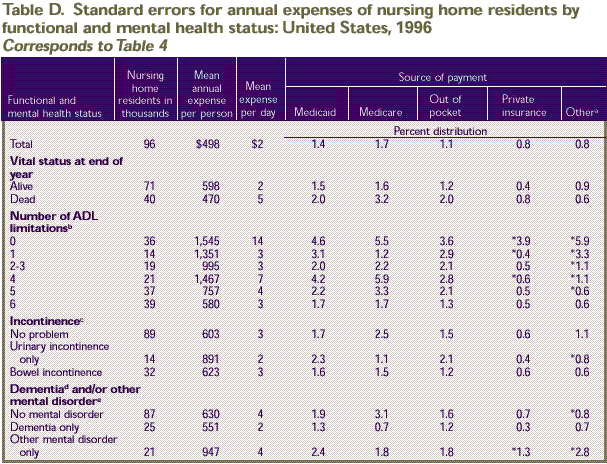
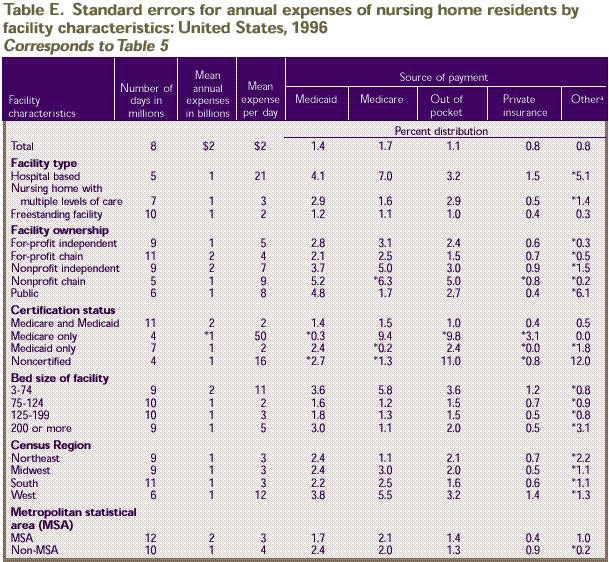
The standard errors in this report are
based on estimates of standard errors derived using the Taylor
series linearization method to account for the complex survey
design. The standard error estimates were computed using SUDAAN
(Shah, Barnwell, and Bieler, 1995). The direct estimates of
the standard errors for the estimates in Tables
1–5 are provided in Tables
A–E, respectively.
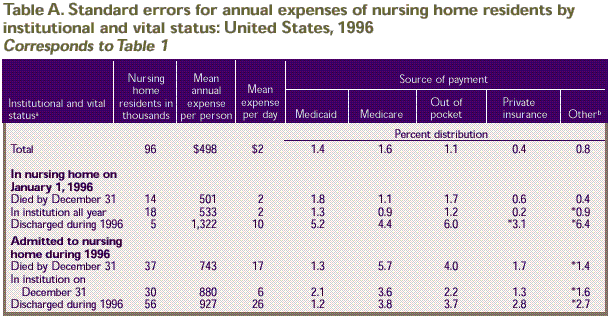
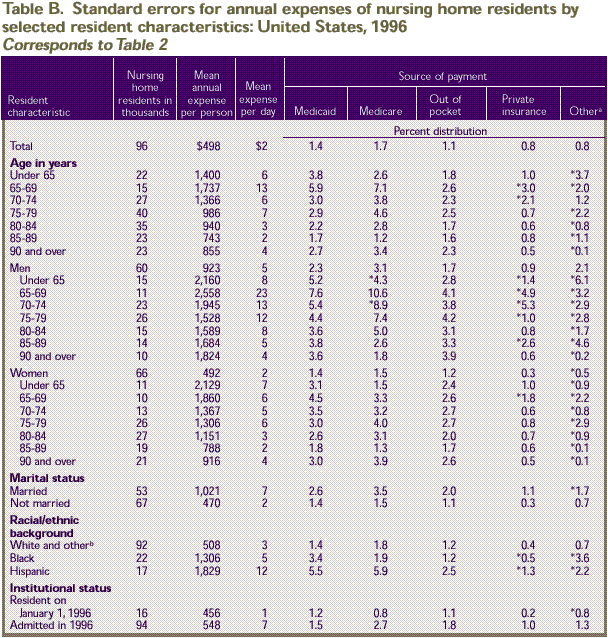
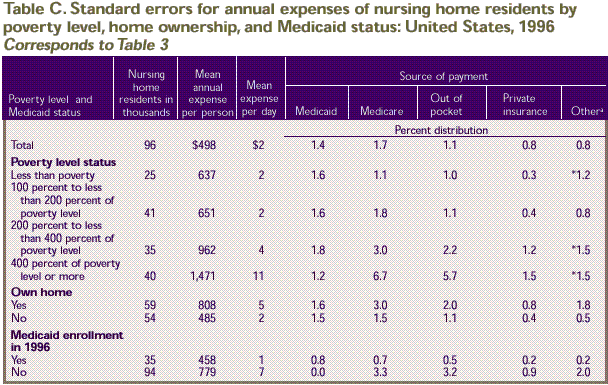
For example, the estimate of $22,561 for
the mean annual expenditure per person (Table
1) has an estimated standard error of $498 (Table
A). The estimate that 67 percent of expenditures for persons
with an income of less than poverty were paid for by Medicaid (Table
3) has an estimated standard error of 1.6 percent (Table
C).
a Vital status by end of year.
b Other payers include Department of Veterans
Affairs, health maintenance organizations, and other sources
of payment.
* Relative standard error is equal to or greater than 30 percent.
Source: Center for Financing, Access,
and Cost Trends, Agency for Healthcare Research and Quality:
Medical Expenditure Panel Survey Nursing Home Component.
a Other payers include Department
of Veterans Affairs, health maintenance organizations, and
other sources of payment.
b Includes other racial/ethnic groups not shown
separately.
* Relative standard error is equal to or greater than 30 percent.
Source: Center for Financing, Access,
and Cost Trends, Agency for Healthcare Research and Quality:
Medical Expenditure Panel Survey Nursing Home Component.
a Other payers include Department
of Veterans Affairs, health maintenance organizations, and
other sources of payment.
* Relative standard error is equal to or greater than 30 percent.
Source: Center for Financing, Access,
and Cost Trends, Agency for Healthcare Research and Quality:
Medical Expenditure Panel Survey Nursing Home Component.
a Other payers include Department
of Veterans Affairs, health maintenance organizations, and
other sources of payment.
b Receiving personal assistance with one or more
of these activities of daily living (ADLs): dressing, bathing,
eating, transferring from a bed or chair, mobility, and
toileting.
c Has difficulty controlling bladder or bowel
several times or more per week. Persons with both types
of incontinence are included in the group with bowel incontinence.
d Includes Alzheimer's and other dementias.
e Includes at least one of the following: anxiety
disorder, depression, manic depression, schizophrenia.
* Relative standard error is equal to or greater than 30 percent.
Source: Center for Financing, Access,
and Cost Trends, Agency for Healthcare Research and Quality:
Medical Expenditure Panel Survey Nursing Home Component.
a Other
payers include Department of Veterans Affairs, health maintenance
organizations, and
other sources of payment. * Relative standard error is equal
to or greater than 30 percent.
Source: Center for Costs and Financing
Studies, Agency for Healthcare Research and Quality: Medical
Expenditure Panel Survey Nursing Home Component.
Note: 1The
MEPS estimate of national expenditures in nursing homes differs
from the estimate in the National Health Expenditures of
the
Health Care Financing Administration. See the technical
appendix for details.
^top
Suggested
Citation:
Rhoades, J. and Sommers, J. Research Findings
#13: Expenses and Sources of Payment for Nursing Home Residents,
1996.
December 2000. Agency
for Healthcare Research and Quality, Rockville,
MD.
http://www.meps.ahrq.gov/data_files/publications/rf13/rf13.shtml |
| 