Research
Findings #9: Changes in the Medicaid Community Population: 1987-96
Jessica S. Banthin, Ph.D., and Joel W. Cohen,
Ph.D., Agency for Health Care Policy and Research
Abstract
This report uses data from MEPS (Medical Expenditure Panel Survey) and NMES (National Medical Expenditure Survey) to compare the composition of the noninstitutionalized Medicaid population in 1996 and 1987. The Medicaid community population grew significantly over this time period, at the same time as a number of expansions in eligibility rules extended Medicaid coverage to people not receiving cash assistance. In both years, children, the elderly, minorities, and the nonworking population were more likely than others to be enrolled in Medicaid, as were the sick and disabled. Children made up nearly half of the Medicaid community population in both years. The composition of the Medicaid community population shifted slightly but significantly over the decade. There were relatively higher proportions of whites and men and relatively lower proportions of women and blacks in 1996 than in 1987. The proportion of the total Medicaid community population made up of non-elderly adults fell during this time period, but a much greater proportion of these non-elderly Medicaid adults were employed in 1996 than in 1987. Also, in 1996 many more of the parents of Medicaid-enrolled children worked. These shifts have significant implications for the administration of Medicaid.
^top
Introduction
Medicaid is the main public program for providing
health insurance coverage to poor and low-income Americans. Traditionally,
the population served by Medicaid has also tended to be in poorer
health than higher income segments of the population (Cohen, Cornelius,
Hahn, et al., 1994). Over the past decade, however, there have
been many changes in the Medicaid community population, which is
defined here as Medicaid enrollees among the U.S. civilian noninstitutionalized
population.1 The size of
the community population served by Medicaid grew significantly
in the past decade, from 7.3 percent of the U.S. civilian noninstitutionalized
population in the first part of 1987 to 11.9 percent in the first
part of 1996. In the first part of 1987, Medicaid covered an estimated
17.5 million people, compared with 31.4 million in the first part
of 1996. This growth occurred at the same time that numerous Federal
and State legislative initiatives have expanded Medicaid eligibility
beyond the traditional populations served—people receiving
cash assistance.
This report describes the demographic, health status,
and employment characteristics of the Medicaid community population
in the first part of 1996. It also examines how the Medicaid population
changed in terms of demographic and employment measures between the
first part of 1987 and the first part of 1996. Data for this report
were derived from the 1996 Medical Expenditure Panel Survey (MEPS)
Household Component (HC) and the 1987 National Medical Expenditure
Survey (NMES) Household Survey.
With the increase in the size of the Medicaid
program have also come changes in the composition of the enrolled
Medicaid community population. These changes can have important
implications for the mix of services paid for by Medicaid, the
move to managed care plans, and the success of outreach efforts.
Changes in the format of questions on general perceived health
status and limitations in work, school, and housework between the
1987 NMES and the 1996 MEPS preclude the direct comparison of changes
in health status. Therefore, this report cannot provide direct
comparisons of health status measures between early 1987 and early
1996. However, the data show that in the first part of 1996 the
Medicaid program continued to serve a population that was in poorer
health than the overall U.S. community population.
Many factors are responsible for shifts in
the size and composition of the Medicaid community population over
time. These factors can be broadly grouped into three categories:
programmatic, demographic, and general economic trends. The most
immediate and significant expansions in Medicaid coverage rates
are often related to changes in program eligibility criteria or
administrative practices. Other factors, however, such as larger
relative increases in the number of young children in the United
States or a drop in the unemployment rate, also can affect Medicaid
coverage rates by changing the size of the pool of potentially
eligible Medicaid enrollees. It is not the intention of this report
to break down the causes of increases in the Medicaid population.
However, a brief summary of the main legislative changes is useful
for understanding the fluctuations in the Medicaid community population
between 1987 and 1996.
^top
Expansions in Medicaid
Eligibility Criteria
Until the mid-1980s, Medicaid coverage for
the community population was largely limited to poor women, children,
and disabled people receiving cash assistance (particularly AFDC
and SSI).2 Some States also
provided Medicaid coverage to other people through programs for
the medically needy. In the past decade, however, numerous legislative
initiatives at both the Federal and State levels have expanded
Medicaid coverage to certain low-income groups beyond those who
are receiving cash assistance. Beginning with the Deficit Reduction
Act of 1984 and continuing through the Omnibus Budget Reconciliation
Act (OBRA) of 1990, most of the Federal initiatives were specifically
targeted to low-income children and pregnant women. It is estimated
that the Federal and State expansions doubled the number of children
eligible for Medicaid on a national basis (Selden, Banthin, and
Cohen, 1998).
Current law as of 1996 established Medicaid
eligibility for infants, children up to age 6, and pregnant women
whose family income was not over 133 percent of the poverty level,
regardless of whether they received AFDC. Children born after September
30, 1983, whose family income was up to 100 percent of the poverty
level were also eligible for Medicaid. As of the first part of
1996, this rule covered children age 12 and under. This phased-in
expansion, referred to as the Waxman expansion, will include all
children under age 19 with incomes up to 100 percent of the poverty
level by 2002. Federal law also permits States the option of allowing
Medicaid eligibility up to 185 percent of the poverty level for
any of these groups of women and children, and some States have
done so.
The Family Support Act of 1988 expanded coverage
for whole families, including working-age men who were fathers
of AFDC- or Medicaid-eligible children. The Act mandated all States
to include the AFDC Unemployed Parents provision, which grants
cash assistance and Medicaid coverage to intact families that meet
the income requirement. It also extended Medicaid coverage for
12 months to families who lose AFDC assistance because of increased
earnings.
In addition to Federal initiatives, several States
have used Section 1115 "Research and Demonstration" waivers
to expand access to publicly sponsored health insurance to a more
broadly defined low-income and uninsured population. Programs such
as Tenncare are open to low-income families and persons beyond
the traditional Medicaid-eligible groups, including, for example,
nondisabled childless adults. Many of these programs have varying
levels of cost-sharing and premium payments for eligible families
depending on poverty status.
Another area of expansion affects certain low-income
elderly and disabled people. Sections of the Medicare Catastrophic
Coverage Act of 1988 presently in effect expanded Medicaid coverage
to the low-income elderly and the low-income disabled. The Act
requires that Medicaid pay for the Medicare cost-sharing requirements
and premium payments for certain low-income qualified Medicare
beneficiaries (the so-called dual eligibles).
Finally, growth in the SSI program also has
affected Medicaid enrollment. The definition of qualifying disabilities
was broadened for children because of legislative mandates and
through court decisions, such as the Zebley decision, that expanded
the definition of disabilities (Sullivan v. Zebley, 1990, 493 U.S.
521). SSI coverage also has grown to include people with AIDS and
people with severe substance abuse problems.
^top
Changes in Medicaid Enrollment
Rates
Age and Sex
Table 1 compares
Medicaid enrollment rates as a percentage of the total U.S. community
population in the first part of 1996 and the first part of 1987.
The first section of Table 1 shows
the distribution of Medicaid enrollees by age category. The proportion
of all children covered by Medicaid increased substantially, rising
from 12.8 percent of all children under age 19 in the first part
of 1987 to 20.5 percent of all children in the first part of 1996.
While all age groups showed an increase, the most dramatic increase
was among those targeted by Medicaid expansions—children under
age 6—whose enrollment rose from 16.2 percent in 1987 to 25.8
percent in 1996. Medicaid enrollment for children ages 6-12 rose
from 13.2 percent in 1987 to 21.0 percent in 1996. Teens ages 13-18
had lower Medicaid enrollment than younger children, but their
rates rose too—from 9.4 percent in 1987 to 14.2 percent in
1996.
There was a large increase in Medicaid coverage
of people age 65 and over, Medicare-Medicaid dual eligibles. Medicaid
coverage rates for the community population in this age group increased
from 7.6 percent in 1987 to 14.1 percent in 1996. The largest absolute
increases between 1987 and 1996 were among children (7.7 percentage
points) and among the elderly (6.5 percentage points). Relatively
small increases were seen among working-age adults (2.6 percentage
points).
The next section of Table
1 shows that the absolute increases in Medicaid coverage
rates for all ages combined were similar for females and males,
although females were covered by Medicaid at a higher rate than
males. In 1996, 13.2 percent of females were enrolled in Medicaid,
an increase of 4.3 percentage points from 1987; 10.6 percent
of males were enrolled in 1996, an increase of 4.9 percentage
points from 1987.
In the next section of Table
1, coverage rates for adults are shown by age and sex. Even
though pregnant women were targeted by Medicaid expansions, enrollment
rates for women ages 19-44 increased by only 29 percent between
1987 and 1996, rising from 8.0 to 10.3 percent. Coverage rates
for men of the same age more than doubled between 1987 and 1996,
increasing from 2.5 to 5.6 percent. As mentioned earlier, the
Family Support Act of 1988 expanded Medicaid eligibility for
low-income working-age fathers of young children.
The highest levels of coverage of adults were
among the elderly. In 1996, about 15.9 percent of elderly women
were enrolled in Medicaid, up from 9.6 percent in 1987; 11.7 percent
of elderly men were enrolled in 1996, up from 4.7 percent in 1987.
Race/Ethnicity
Differences in Medicaid enrollment rates by
racial and ethnic group are shown in the next section of Table
1. The first two columns of data show the markedly different
rates of growth in the U.S. community population by racial and
ethnic group. The number of Hispanics in the United States increased
by 51 percent between 1987 and 1996, blacks increased by 16 percent,
and whites and others (including Asians, Pacific Islanders, American
Indians, and Alaska Natives) increased by approximately 6 percent.
At the same time, Medicaid enrollment rates increased from 16.9
percent to 21.0 percent among Hispanics and from 4.1 percent to
8.4 percent among the group of whites and others, with no significant
change among blacks.
Location
The next two sections of the table look at
urban and regional differences. While there was a decrease in the
number of people in the U.S. community population living outside
metropolitan statistical areas (MSAs) from 1987 to 1996, the rate
of Medicaid enrollment grew faster in non-MSAs (rising from 8.1
percent to 13.9 percent) than in MSAs (increasing from 7.1 percent
to 11.4 percent). The West Region of the country experienced not
only an increase in overall population but also a large increase
in Medicaid coverage rates. Medicaid enrollment in the West grew
8.2 percentage points, from 5.9 percent of the population in 1987
to 14.1 percent in 1996.
Employment Status
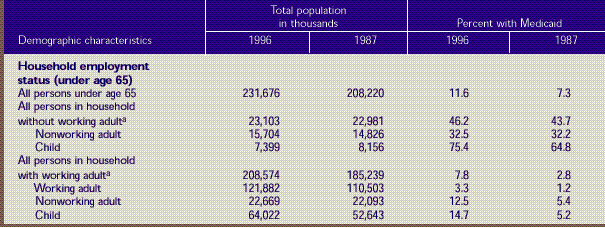
In examining how Medicaid enrollment has changed
with respect to employment status, the sample is subset to people
under age 65 in the last section of Table
1. The total number of people who lived in households without
an employed adult (ages 18-64) stayed relatively constant between
1987 and 1996 in spite of the increase in the overall U.S. population,
while the number of children living in these households fell slightly
from 8.2 million to 7.4 million. Yet, three-quarters (75.4 percent)
of all children who lived in a household without an employed adult
were enrolled in Medicaid in 1996, up from 64.8 percent in 1987.
The percent of people enrolled in Medicaid
who were living in households with an employed adult increased
overall from 2.8 percent in 1987 to 7.8 percent in 1996. The largest
increase was among children, whose rate of enrollment rose from
5.2 percent in 1987 to 14.7 percent in 1996. The change in eligibility
criteria that grants Medicaid coverage to some children and pregnant
women based on poverty status rather than AFDC eligibility may
explain this rise. In spite of holding jobs, some families still
qualify for Medicaid coverage of some or all members of the family.
^top
Demographic Changes
Table 2 shows
how the composition of the Medicaid community population changed
between early 1987 and early 1996. The distribution of enrollees
as a percentage of the total Medicaid community population is shown
by selected demographic characteristics. The overall Medicaid population
grew from 17.5 million in the first part of 1987 to 31.4 million
in the first part of 1996. In addition, the composition of the
Medicaid population shifted in some significant ways, reflecting
increases in the rates of enrollment by different subgroups as
well as changes in the overall U.S. population.
The first section of Table
2 shows that children still made up slightly less than half
(48.9 percent) of the Medicaid community population in 1996.
This percentage did not change significantly despite relatively
larger increases in children's enrollment rates as well as larger
increases in overall population numbers compared with other age
groups. The percentage of adults ages 19-44 fell by 3.2 percentage
points to 26.7 percent of the total community Medicaid population
in 1996. The percentage of elderly adults rose from 12.9 percent
in 1987 to 14.3 percent in 1996, but this is not a statistically
significant change.
Medicaid enrollees are also shown by sex and
age-sex categories. Medicaid programs were more likely to cover
men in 1996 than in 1987. The percentage of males in the Medicaid
community population grew to 43.3 percent of the total in 1996,
compared with 37.8 percent in 1987. Although the absolute number
of women ages 19-44 enrolled in Medicaid increased from 4.0 million
in 1987 to about 5.5 million in 1996, this group made up only 17.4
percent of the total Medicaid community population, down from 23.0
percent in 1987. At the same time, men ages 19-44 increased from
6.8 to 9.2 percent of the total. Although small, these changes
in composition can have implications for the mix of services paid
for by the Medicaid program, since working-age men and women have
different health care needs from each other and from the needs
of young children and the elderly.
There also have been significant changes by racial
and ethnic group. Whites and others made up more than half (54.4
percent) of the Medicaid community population in 1996, while blacks
fell to 26.6 percent of the total. This is a significant shift
from 1987, when whites and others composed 44.6 percent and blacks
composed 37.4 percent of the total Medicaid community population.
Hispanics stayed nearly constant, at 19.0 percent of the total
in 1996 and 18.1 percent of the total in 1987.
Changes by urban and geographic region are
shown in the next section of Table 2. There
were no significant shifts in the percentage of the Medicaid community
population living in urban areas. Medicaid enrollees living in
the West made up a greater percentage of the total Medicaid population
in 1996 than in 1987 (26.1 percent versus 15.8 percent).
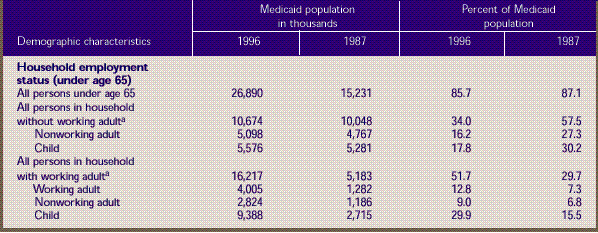
The last section of Table
2 shows only people under age 65 and compares the changes
in the Medicaid community population by household employment
status. Employed adults (ages 18-64) composed 12.8 percent of
the Medicaid community population in 1996, up from 7.3 percent
in 1987. Children who lived in a household with an employed adult
made up 29.9 percent of the total Medicaid community population
in 1996, compared with just 15.5 percent in 1987. Conversely,
children who lived in households without an employed adult made
up 17.8 percent of the total in 1996, down from 30.2 percent
in 1987.
^top
Changes in Parents' Employment
Status
Table 3 looks
at Medicaid-enrolled children specifically in terms of the employment
status of their parents. Children in both one- and two-parent households
are included. The composition of the group of Medicaid-enrolled
children changed dramatically from 1987 to 1996 in terms of their
parents' employment status. Whereas in 1987 three-quarters (74.9
percent) of Medicaid-enrolled children lived in households with
no employed parent, this group fell to less than half (47.2 percent)
of all Medicaid-enrolled children in 1996. The percentage with
one or two employed parents increased to 52.8 percent in 1996,
up from 25.1 percent in 1987.
^top
Health Status, 1996
One of the main objectives of the Medicaid
program has always been to ensure access to health care for people
who need care but cannot pay for it on their own. In addition to
being in greater economic need, the population served by Medicaid
generally has tended to be less healthy than the non-Medicaid population.
There also has been considerable interest in recent years in the
relationship between health status and health insurance. Tables
4-6 examine the relationship between health status and Medicaid
coverage for three separate populations of interest: children,
non-elderly adults, and adults age 65 and over.
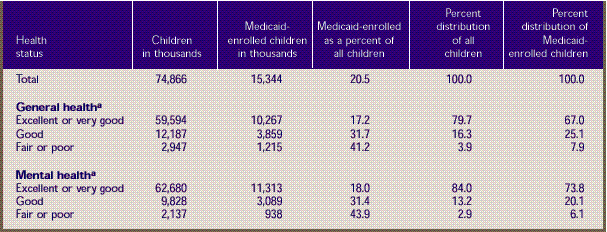
Table 4 presents
data on health status and Medicaid coverage for children age 18
and under. The probability that a child is enrolled in Medicaid
is associated with the state of both the child's general and mental
health. Children in fair or poor health are much more likely than
those in excellent or very good health to be covered by Medicaid.
In 1996, 41.2 percent of children in fair or poor general health
and 43.9 percent of those in fair or poor mental health were enrolled
in Medicaid, in contrast to the enrollment rates for children in
excellent or very good general health (17.2 percent) and excellent
or very good mental health (18.0 percent). Moreover, compared with
the total population of children ages 18 and under, those on Medicaid
were:
- Less likely to be in excellent or very good
general health (79.7 percent of the total population vs. 67.0
percent of children enrolled in Medicaid) or mental health (84.0
percent of the total population vs. 73.8 percent).
- Twice as likely to be in fair or poor general
health (3.9 percent of the total population versus 7.9 percent
for Medicaid) or mental health (2.9 percent of the total population
versus 6.1 percent).
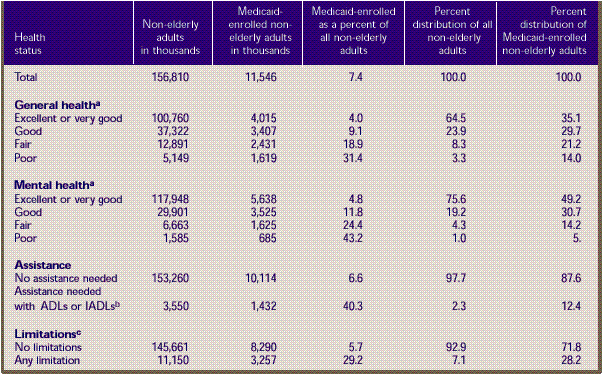
Table
5 presents similar data for the non-elderly adult
population (ages 19-64). As was the case with children,
non-elderly adults in fair or poor health are much
more likely than their healthier counterparts to be
covered by Medicaid. Non-elderly adults who need assistance
with activities of daily living (ADLs) or instrumental
activities of daily living (IADLs) and those who have
activity limitations are also more likely to be covered
by Medicaid. For each measure, the probability of being
enrolled in Medicaid increases as health status declines.
For example, only 4.0 percent of non-elderly adults
in excellent or very good general health, but nearly
one-third (31.4 percent) of non-elderly adults in poor
general health, were covered by the program in 1996.
Similarly, non-elderly adults who needed ADL or IADL
assistance were approximately six times as likely as
those who did not need such assistance to be enrolled
in Medicaid (40.3 percent compared with 6.6 percent).
Medicaid's orientation toward people
who have health problems can also be seen in the health
status of non-elderly adult program enrollees compared
with the health status of the total U.S. population this
age. For example, people in excellent or very good health
make up nearly two-thirds (64.5 percent) of the total
non-elderly adult population but only about one-third
(35.1 percent) of the Medicaid population this age. Similarly,
while only 7.1 percent of the total non-elderly adult
population had any activity limitations, more the one-quarter
(28.2 percent) of the comparable Medicaid population
had a limitation of some kind. Finally, non-elderly adults
covered by Medicaid were nearly six times as likely as
the total population this age to be in poor mental health
(5.9 percent versus 1.0 percent) or to need ADL or IADL
assistance (12.4 percent versus 2.3 percent).
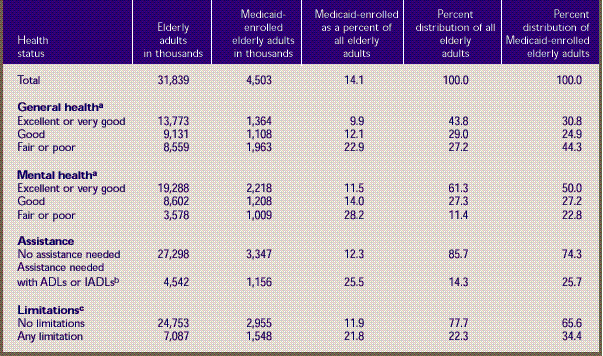
Table 6 presents
health status data for the elderly noninstitutionalized
Medicaid population (age 65 and over). As is true for
both children and non-elderly adults, the probability
of being enrolled in Medicaid increases as the health
status of the elderly declines. For example, elderly
persons whose general health status was excellent or
very good were less than half as likely to be enrolled
in Medicaid as those whose health status was only fair
or poor (9.9 percent versus 22.9 percent). The same was
true for mental health (11.5 percent versus 28.2 percent).
Elderly individuals who did not need ADL or IADL assistance
were less than half as likely to be enrolled in Medicaid
as those who needed such assistance (12.3 percent vs.
25.5 percent). In 1996, elderly Medicaid enrollees were
much more likely than the total elderly population:
- To be in fair or poor general health
(44.3 percent versus 27.2 percent).
- To be in fair or poor mental health
(22.8 percent vs. 11.4 percent).
- To need ADL or IADL assistance (25.7
percent vs. 14.3 percent).
- To have an activity limitation (34.4
percent vs. 22.3 percent).
^top
Conclusions
The Medicaid community population
grew significantly from 1987 to 1996, at the same time
as a number of expansions in eligibility rules extended
Medicaid coverage to people not receiving cash assistance.
The pattern in both years was that children, the elderly,
women, minorities, and the nonworking populations were
more likely than others to be enrolled in Medicaid. Medicaid
also was more likely to serve the sick and disabled.
Data for 1996 show that people in poor general or mental
health and people with limitations or in need of assistance
in daily living were more likely to be enrolled in Medicaid
then healthy nondisabled persons were.
The composition of the Medicaid community
population shifted slightly but significantly from 1987
to 1996. There were relatively higher proportions of
whites and men and relatively lower proportions of women
and blacks in 1996 than in 1987. Children composed nearly
half of Medicaid enrollees in both years. The proportion
of the total Medicaid community population consisting
of non-elderly adults fell, but employed adults constituted
a much greater proportion of non-elderly Medicaid-enrolled
adults in 1996 than in 1987. This was also true for the
parents of Medicaid-enrolled children; many more of the
parents in 1996 than in 1987 were employed. Thus, concurrent
with a number of important expansions in Medicaid eligibility
rules, enrollment patterns and the makeup of the Medicaid
community population changed from 1987 to 1996. These
shifts have significant implications for the administration
of such an important insurance program for low-income
individuals and families.
^top
Tables
Table 1. Demographic
characteristics of the total population and percent
with Medicaid: U.S. community population, first half
of 1996 and first half of 1987
Source: Center for Financing,
Access, and Cost Trends, Agency for Health Care Policy
and Research: Medical Expenditure Panel Survey Household
Component, 1996 (Round 1); National Medical Expenditure
Survey Household Survey, 1987 (Round 1).
^top
Table 2. Demographic
characteristics of the Medicaid population: U.S.
community population, first half of 1996 and first
half of 1987
Source: Center for Financing,
Access, and Cost Trends, Agency for Health Care Policy
and Research: Medical Expenditure Panel Survey Household
Component, 1996 (Round 1); National Medical Expenditure
Survey Household Survey, 1987 (Round 1).
^top
Table 3. Employment
status of parents of Medicaid-enrolled children age
18 and under: U. S. community population, first half
of 1996 and first half of 1987

Source: Center for Financing,
Access, and Cost Trends, Agency for Health Care Policy
and Research: Medical Expenditure Panel Survey Household
Component, 1996 (Round 1); National Medical Expenditure
Survey Household Survey, 1987 (Round 1).
^top
Table 4. Health
status of total and Medicaid-enrolled children age
18 and under: U.S. community population, first half
of 1996
- aItem nonresponse was
less than 0.1 percent of all responses. Distributional
estimates on health status were made on the assumption
that nonrespondents followed the distribution of respondents.
Source: Center for Financing,
Access, and Cost Trends, Agency for Health Care Policy
and Research: Medical Expenditure Panel Survey Household
Component, 1996 (Round 1).
^top
Table 5. Health
status of total and Medicaid-enrolled adults ages
19-64: U.S. community population, first half of 1996
- a Item nonresponse was
0.6 percent of all responses. Distributional estimates
on health status were made on the assumption that nonrespondents
followed the distribution of respondents.
- b Activities of daily
living (ADLs) include activities such as bathing and
dressing. Instrumental activities of daily living (IADLs)
include activities such as shopping and paying bills.
- c Limitations involve
the ability to work at a job, do housework, or go to
school.
Source: Center for Financing,
Access, and Cost Trends, Agency for Health Care Policy
and Research: Medical Expenditure Panel Survey Household
Component, 1996 (Round 1).
^top
Table 6. Health
status of total and Medicaid-enrolled adults age
65 and over: U.S. community population, first half
of 1996
- a Item
nonresponse was 1.5 percent of all responses. Distributional
estimates on health status were made on the assumption
that nonrespondents followed the distribution of respondents.
- b Activities of daily
living (ADLs) include activities such as bathing and
dressing. Instrumental activities of daily living (IADLs)
include activities such as shopping and paying bills.
- c Limitations involve
the ability to work at a job, do housework, or go to
school.
Source: Center for Financing,
Access, and Cost Trends, Agency for Health Care Policy
and Research: Medical Expenditure Panel Survey Household
Component, 1996 (Round 1).
^top
References
Cohen J. Design and methods of the
Medical Expenditure Panel Survey Household Component.
Rockville (MD): Agency for Health Care Policy and Research;
1997. MEPS Methodology Report No. 1. AHRQ Pub. No. 97-0026.
Cohen J, Cornelius L, Hahn B, et
al. Use of services and expenses for the noninstitutionalized
population under Medicaid. Rockville (MD): Agency for
Health Care Policy and Research; 1994. National Medical
Expenditure Survey Research Findings 20. AHRQ Pub. No.
94-0051.
Cohen JW, Monheit AC, Beauregard
KM, et al. The Medical Expenditure Panel Survey: a national
health information resource. Inquiry 1996;33:373-89.
Cohen S. Sample design of the 1996
Medical Expenditure Panel Survey Household Component.
Rockville (MD): Agency for Health Care Policy and Research;
1997. MEPS Methodology Report No. 2. AHRQ Pub. No. 97-0027.
Cohen S, DiGaetano R, Waksberg J.
Sample design of the Household Survey. Rockville (MD):
Agency for Health Care Policy and Research; 1991. National
Medical Expenditure Survey Methods 3. AHRQ Pub. No. 91-0037.
Edwards WS, Berlin M. Questionnaires
and data collection methods for the Household Survey
and the Survey of American Indians and Alaskan Natives.
Rockville (MD): National Center for Health Services Research
and Health Care Technology Assessment; 1989. National
Medical Expenditure Survey Methods 2. DHHS Pub. No. (PHS)
89-3450.
Selden TM, Banthin JS, Cohen JW.
Medicaid's problem children: eligible but not enrolled.
Health Affairs 1998;17(3):192-200.
Short P, Monheit A, Beauregard K.
A profile of uninsured Americans. Rockville (MD): National
Center for Health Services Research and Health Care Technology
Assessment; 1989. National Medical Expenditure Survey
Research Findings 1. DHHS Pub. No.( PHS) 89-3443.
Vistnes JP, Monheit AC. Health insurance
status of the U.S. civilian noninstitutionalized population:
1996. Rockville (MD): Agency for Health Care Policy and
Research; 1997. MEPS Research Findings No. 1. AHRQ Pub.
No. 97-0030.
^top
Technical Appendix
The data in this report were obtained
in the first round of interviews for the Household Component
(HC) of the 1996 Medical Expenditure Panel Survey (MEPS)
and the Household Survey of the 1987 National Medical
Expenditure Survey (NMES). MEPS is cosponsored by the
Agency for Health Care Research and Quality (AHRQ) and
the National Center for Health Statistics (NCHS). NMES
was sponsored by AHRQ's predecessor, the National Center
for Health Services Research. Both are nationally representative
surveys of the U.S. civilian noninstitutionalized population
that collect medical expenditure data at both the person
and household levels.
The focus of the MEPS HC and the
NMES Household Survey is to collect detailed data on
demographic characteristics, health conditions, health
status, use of medical care services, charges and payments,
access to care, satisfaction with care, health insurance
coverage, income, and employment. In other components
of MEPS and NMES, data are collected on residents of
licensed or certified nursing homes and on the supply
side of the health insurance market.
Survey Design
1996 MEPS
The sample for the 1996 MEPS HC was
selected from respondents to the 1995 National Health
Interview Survey (NHIS), which was conducted by NCHS.
NHIS provides a nationally representative sample of the
U.S. civilian noninstitutionalized population and reflects
an oversampling of Hispanics and blacks.
The MEPS HC collects data through
an overlapping panel design. In this design, data are
collected through a precontact interview that is followed
by a series of five rounds of interviews over 2 1/2 years.
Interviews are conducted with one member of each family,
who reports on the health care experiences of the entire
family. Two calendar years of medical expenditure and
utilization data are collected from each household and
captured using computer-assisted personal interviewing
(CAPI). This series of data collection rounds is launched
again each subsequent year on a new sample of households
to provide overlapping panels of survey data that will
provide continuous and current estimates of health care
expenditures. The reference period for Round 1 of the
MEPS HC was from January 1, 1996, to the date of the
first interview, which occurred during the period from
March through July 1996.
1987 NMES
The 1987 NMES was designed to provide
estimates of insurance coverage, use of services, expenditures,
and sources of payment for the 1-year period from January
1, 1987, through December 31, 1987. The entire Household
Survey was conducted in four interview rounds at approximately
4-month intervals, with a fifth short telephone interview
at the end. Items related to health status, access to
health care, and income were collected in special supplements
that were administered over the course of the calendar
year. The reference period for Round 1 of the Household
Survey was from January 1, 1987, to the date of the first
interview, which took place at some time from February
through April 1987. For more information on the survey
instruments and data collection methods for NMES, see
Edwards and Berlin (1989).
Medicaid Coverage
The household respondent was asked
if—between the first of the year and the time of
the Round 1 interview—anyone in the family was covered
by any of several sources of public and private health
insurance coverage. For this report, Medicaid enrollment
represents coverage at any time during the Round 1 reference
period. Persons identified as having Medicaid coverage
could also have had other sources of public and private
coverage. For more details on health insurance status
measures, see Vistnes and Monheit (1997) for information
on the 1996 MEPS and Short, Monheit, and Beauregard (1989)
for information on the 1987 NMES.
Respondents were asked if they were
covered by Medicaid, medical assistance, or some other
State-specific name for the Medicaid program. In editing
the 1996 data, a small number of cases reporting Aid
to Families with Dependent Children (AFDC) or Supplemental
Security Income (SSI) coverage (questions included in
Round 1 for editing purposes) were assigned Medicaid
coverage. To identify Medicaid recipients who might not
have recognized their coverage as Medicaid, respondents
who did not report Medicaid coverage were asked if they
were covered by any other public hospital/physician coverage.
If they said yes, they were identified as Medicaid enrollees.
In editing the 1987 NMES data, the
Medicaid status of approximately 150 persons with missing
data was inferred from family relationships, receipt
of SSI and AFDC, whether Medicaid was reported as a source
of payment for a person's medical expenses, employment
information, and poverty status of the persons living
in the dwelling unit at the time of the screening interview.
The accuracy of Medicaid reporting
in household surveys can be assessed by comparisons with
Medicaid administrative data. The administrative data
are counts of the number of persons who were covered
by Medicaid at any point during the year. Thus, they
can be compared appropriately to full-year estimates
rather than the part-year estimates used in this report.
Full-year estimates from the 1996 MEPS are not available
for this report. However, full-year estimates from the
1987 NMES show that Medicaid estimates for NMES were
only 4.7 percent below administrative enrollment counts.
For further information on the accuracy of Medicaid reporting,
see Selden, Banthin, and Cohen (1998).
Population Characteristics
Information on all population characteristics
used in this report comes from Round 1 of either the
1996 MEPS HC or the 1987 NMES Household Survey.
Race/Ethnicity
Classification by race and ethnicity
is based on information reported for each family member.
Respondents were asked if their race was best described
as American Indian, Alaska Native, Asian or Pacific Islander,
black, white, or other. In this report, American Indians,
Alaska Natives, Asians, and Pacific Islanders are included
with whites in the category "white and other."
Respondents also were asked if each
family member's main national origin or ancestry was
Puerto Rican; Cuban; Mexican, Mexicano, Mexican American,
or Chicano; other Latin American; or other Spanish. All
persons whose main national origin or ancestry was reported
in one of these Hispanic groups, regardless of racial
background, were classified as Hispanic. Since the Hispanic
grouping can include black Hispanic, white Hispanic,
and other Hispanic, the race categories of black and
white/other do not include Hispanic persons.
Region and Place of Residence
Individuals were identified as residing
in one of four main regions—Northeast, Midwest,
South, and West—in accordance with the U.S. Bureau
of the Census definition. Place of residence, either
inside or outside a metropolitan statistical area (MSA),
was defined according to the U.S. Office of Management
and Budget designation, which applied 1990 standards
using population counts from the 1990 U.S. census. An
MSA is a large population nucleus combined with adjacent
communities that have a high degree of economic and social
integration with the nucleus. Each MSA has one or more
central communities containing the area's main population
concentration. In New England, metropolitan areas consist
of cities and towns rather than whole counties.
Age
The respondent was asked to report
the age of each family member as of the date of the Round
1 interview.
Household Employment Status
A household (family) was defined as
a group of people living together who were related to
one another by blood, marriage (or living together as
married), or adoption or foster care. For this report,
presence of an employed adult was defined as having a
person living in the household at the time of the Round
1 interview who was age 18-64 and had a paying job.
Health Status, 1996
Health status measures used in this
report are from the 1996 MEPS only. In every round of
MEPS, the respondent is asked to rate the health of every
member of the family. The exact wording of the question
is: "In general, compared to other people of (PERSON)'s
age, would you say that (PERSON)'s health is excellent,
very good, good, fair, or poor?" A similar question
is asked about mental health status.
In order to generate the distributional
estimates presented in Tables 4-6, it was assumed that
persons missing data for these questions were distributed
across health states following the distribution of those
with data available.
Assistance with ADLs and IADLs
Questions concerning the need for
assistance in instrumental activities of daily living
(IADLs) and in activities of daily living (ADLs) are
asked in every round of MEPS. Limitations in the ability
to perform IADLs are assessed by first asking the respondent
a screening question: "Does anyone in the family
receive help or supervision using the telephone, paying
bills, taking medications, preparing light meals, doing
laundry, or going shopping?" Limitations in ability
to perform ADLs are assessed with the following question: "Does
anyone in the family receive help or supervision with
personal care such as bathing, dressing, or getting around
the house?" Follow-up questions are asked, but they
are not used in this report. For this report, the responses
to the two screening questions are combined into a single
measure of need for any type of IADL or ADL assistance.
Activity Limitations
These include limitations in both
paid work and unpaid housework, as well as limitations
in the ability to attend school. The relevant question
asks, "Is anyone in the family limited in any way
in the ability to work at a job, do housework, or go
to school because of an impairment or a physical or
mental health problem?" (emphasis in the question
as indicated).
Sample Design and Accuracy of Estimates
1996 MEPS
The sample selected for the 1996
MEPS, a subsample of the 1995 NHIS, was designed to produce
national estimates that are representative of the civilian
noninstitutionalized population of the United States.
Round 1 data were obtained for approximately 9,400 households
in MEPS comprising 23,612 individuals, which results
in a survey response rate of 78 percent. This figure
reflects participation in both NHIS and MEPS.
The statistics presented in this
report are affected by both sampling error and sources
of nonsampling error, which include nonresponse bias,
respondent reporting errors, and interviewer effects.
For a detailed description of the MEPS survey design,
the adopted sample design, and methods used to minimize
sources of nonsampling error, see J. Cohen (1997), S.
Cohen (1997), and Cohen, Monheit, Beauregard, et al.
(1996). The MEPS person-level estimation weights include
nonresponse adjustments and poststratification adjustments
to population estimates derived from the March 1996 Current
Population Survey (CPS) based on cross-classifications
by region, age, race/ethnicity, and gender.
Tests of statistical significance
were used to determine whether the differences between
populations exist at specified levels of confidence or
whether they occurred by chance. Differences were tested
using Z-scores having asymptotic normal properties at
the 0.05 level of significance. Unless otherwise noted,
only statistically significant differences between estimates
are discussed in the text.
1987 NMES
The NMES Household Survey was designed
to produce statistically unbiased national estimates
that are representative of the civilian noninstitutionalized
population of the United States. To this end, the Household
Survey used the national multistage area samples of Westat,
Inc., and the National Opinion Research Corporation (NORC).
An initial screening interview was
conducted in fall 1986 to facilitate oversampling of
population subgroups of particular policy concern (i.e.,
blacks, Hispanics, the elderly, the poor and near poor,
and those with difficulties in ADLs). Screening interviews
were completed in approximately 28,700 dwelling units.
Sampling specifications required the selection of approximately
17,500 households for the first core household interview.
Data were obtained for about 85.4 percent of eligible
households in the first interview. Approximately 6 percent
of all survey participants provided data for only some
of the time in which they were eligible to respond. In
the Household Survey, the full-year core questionnaire
response rate was 80.1 percent and the joint core questionnaire/health
questionnaire/access supplement response rate was 72.0
percent. For a detailed description of the survey design
and of sampling, estimation, and adjustment methods,
including weighting for nonresponse and poststratification,
see Cohen, DiGaetano, and Waksberg (1991).
Rounding
Estimates presented in the tables
were rounded to the nearest 0.1 percent. Standard errors,
presented in Tables A-F, were rounded to the nearest
0.01. Therefore, some of the estimates for population
totals of subgroups presented in the tables will not
add exactly to the overall estimated population total.
Standard Error
Tables
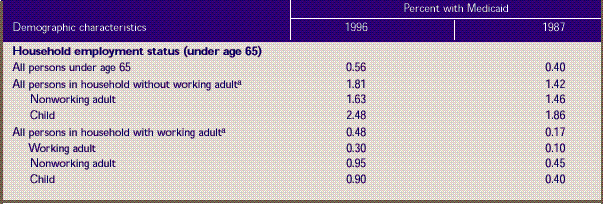
Table A. Standard errors for demographic
characteristics of percent of U.S. population with
Medicaid: U.S. community population, first half of
1996 and first half of 1987. Corresponds to Table 1. 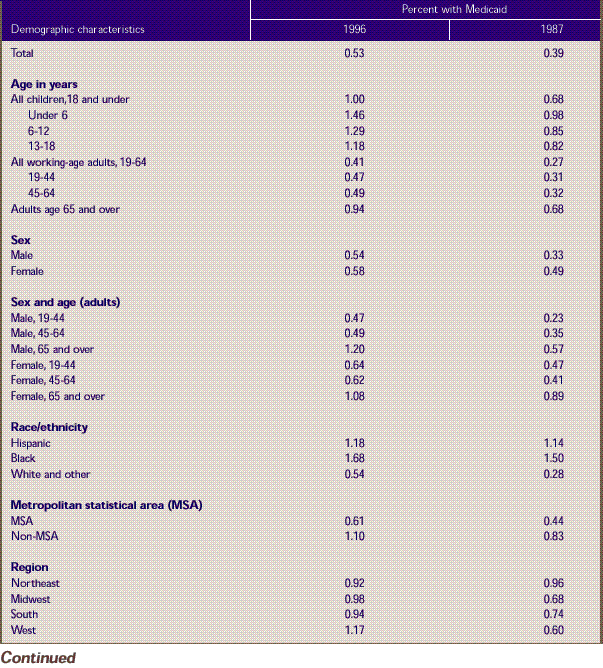
Source: Center
for Financing, Access, and Cost Trends, Agency for Health
Care Policy and Research: Medical Expenditure Panel Survey
Household Component, 1996 (Round 1); National Medical
Expenditure Survey Household Survey, 1987 (Round 1).
^top
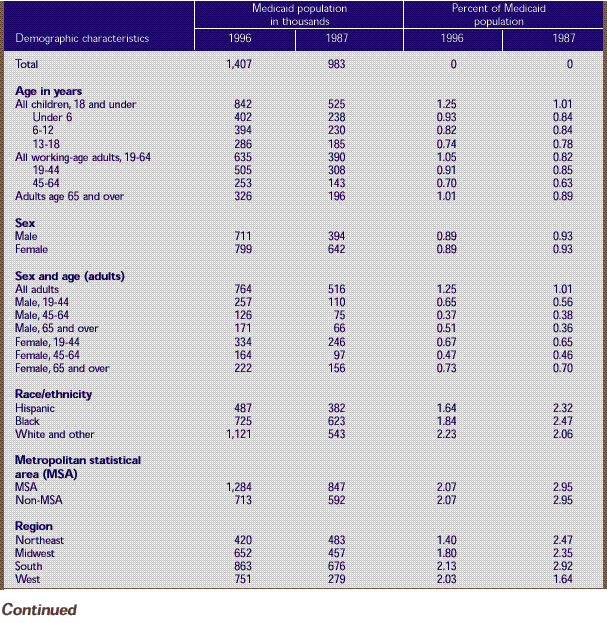
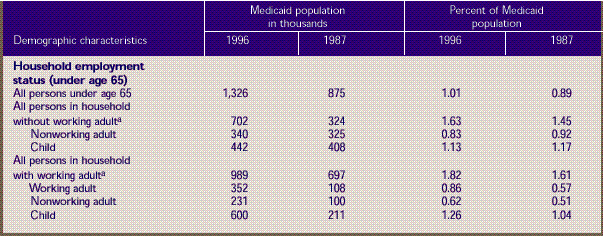
Table B. Standard errors for demographic
characteristics of the Medicaid population: U.S. community
population, first half of 1996 and first half of 1987.
Corresponds to Table 2.
Source: Center for Financing,
Access, and Cost Trends, Agency for Health Care Policy
and Research: Medical Expenditure Panel Survey Household
Component, 1996 (Round 1); National Medical Expenditure
Survey Household Survey, 1987 (Round 1).
^top
Table C. Standard errors for employment
status of parents of Medicaid-enrolled children age
I8 and under: U.S. community population, first half
of 1996 and first half of 1987.
Corresponds to Table 3. 
Source: Center for Financing,
Access, and Cost Trends, Agency for Health Care Policy
and Research: Medical Expenditure Panel Survey Household
Component, 1996 (Round 1); National Medical Expenditure
Survey Household Survey, 1987 (Round 1).
^top
Table D. Standard errors for health
status of total and Medicaid-enrolled children age
18 and under: U.S. community population, first half
of 1996.
Corresponds to Table 4. 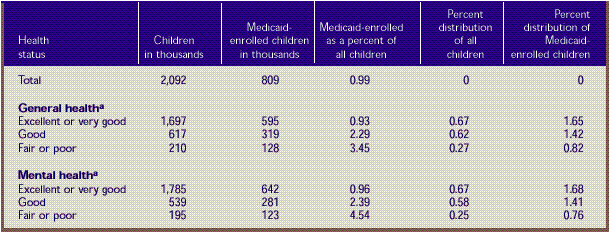
- aItem nonresponse was
less than 0.1 percent of all responses. Distributional
estimates on health status were made on the assumption
that nonrespondents followed the distribution of respondents.
Source: Center for Financing,
Access, and Cost Trends, Agency for Health Care Policy
and Research: Medical Expenditure Panel Survey Household
Component, 1996 (Round 1).
^top
Table E. Standard errors for health
status of total and Medicaid-enrolled adults ages 19-64:
U.S. community population, first half of 1996.
Corresponds to Table 5. 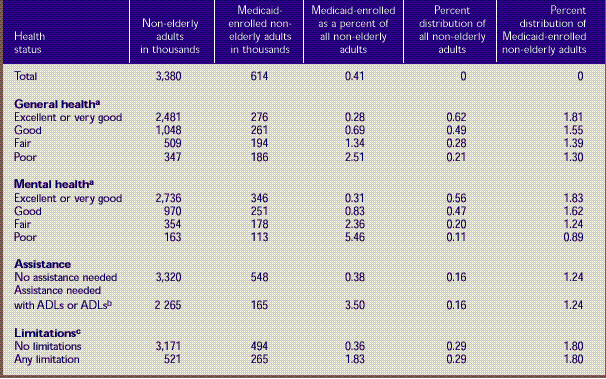
-
aItem
nonresponse was 0.6 percent of all responses. Distributional
estimates
on health status were made on the assumption that
nonrespondents followed the distribution of respondents.
-
bActivities
of daily living (ADLs) include activities such
as bathing
and dressing. Instrumental activities of daily
living (IADLs) include activities such as shopping
and paying
bills.
-
cLimitations involve
the ability to work at a job, do housework, or go
to school.
Source: Center for Financing,
Access, and Cost Trends, Agency for Health Care Policy
and Research: Medical Expenditure Panel Survey Household
Component, 1996 (Round 1).
^top
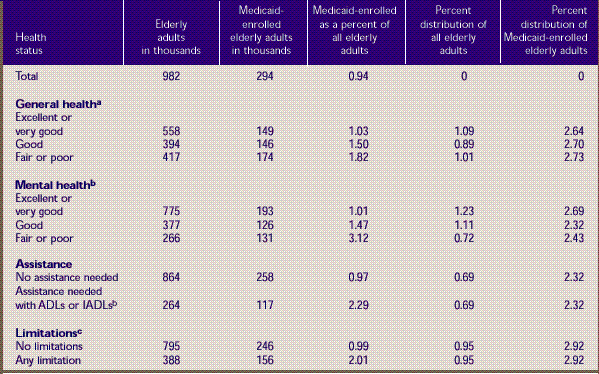
Table F. Standard errors for health
status of total and Medicaid-enrolled adults age
65 and over: U.S. community population: first half
of 1996.
Corresponds to Table 6.
-
aItem
nonresponse was 1.5 percent of all responses. Distributional
estimates
on health status were made on the assumption that
nonrespondents followed the distribution of respondents.
-
bActivities
of daily living (ADLs) include activities such
as bathing
and dressing. Instrumental activities of daily
living (IADLs) include activities such as shopping
and paying
bills.
-
cLimitations involve
the ability to work at a job, do housework, or go
to school.
Source: Center for Financing,
Access, and Cost Trends, Agency for Health Care Policy
and Research: Medical Expenditure Panel Survey Household
Component, 1996 (Round 1).
^top
Notes
1The
institutionalized Medicaid population has been excluded
from this analysis.
2Aid
to Families with Dependent Children (AFDC) was replaced
by Temporary Assistance to Needy Families (TANF), which
went into effect in 1997. SSI stands for Supplemental
Security Income.
^top
Suggested Citation:
Banthin, J. S. and Cohen,
J. W. Research Findings #9: Changes in the Medicaid Community Population: 1987-96. August 1999. Agency for Healthcare Research and Quality, Rockville, MD. http://www.meps.ahrq.gov/data_files/publications/rf9/rf9.shtml |
| 