
|
|
Font Size:
|
||||
|
|
|
|
||||
STATISTICAL BRIEF #125:
Outpatient Prescribed Medicine Expenses by Source of Payment and Insurance Status for the Medicare and Non-Medicare Populations, 2003
Highlights
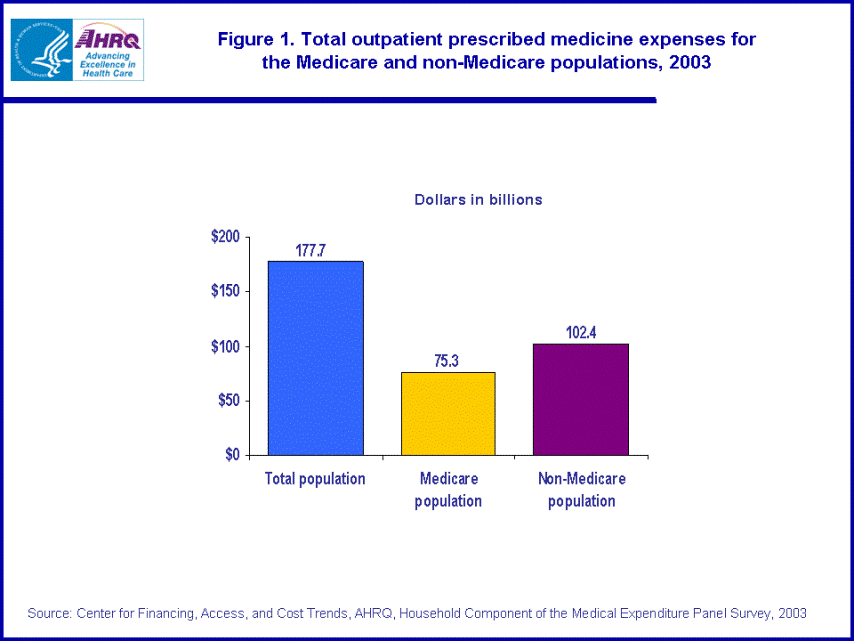
- Outpatient prescription drug expenses for the U.S. community population totaled $177.7 billion in 2003, with expenses for the Medicare population accounting for 42.4 percent ($75.3 billion) and expenses for the non-Medicare population accounting for 57.6 percent ($102.4 billion).
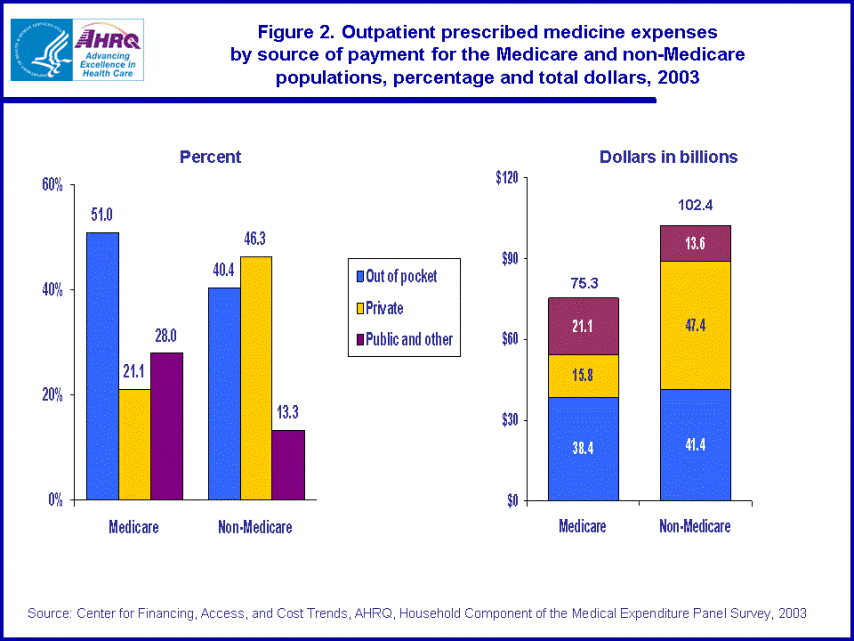
- Out-of-pocket payments accounted for about half (51.0 percent) of all prescription medicine expenses for Medicare beneficiaries but accounted for only two-fifths (40.4 percent) of prescription medicine expenses for the non-Medicare population.
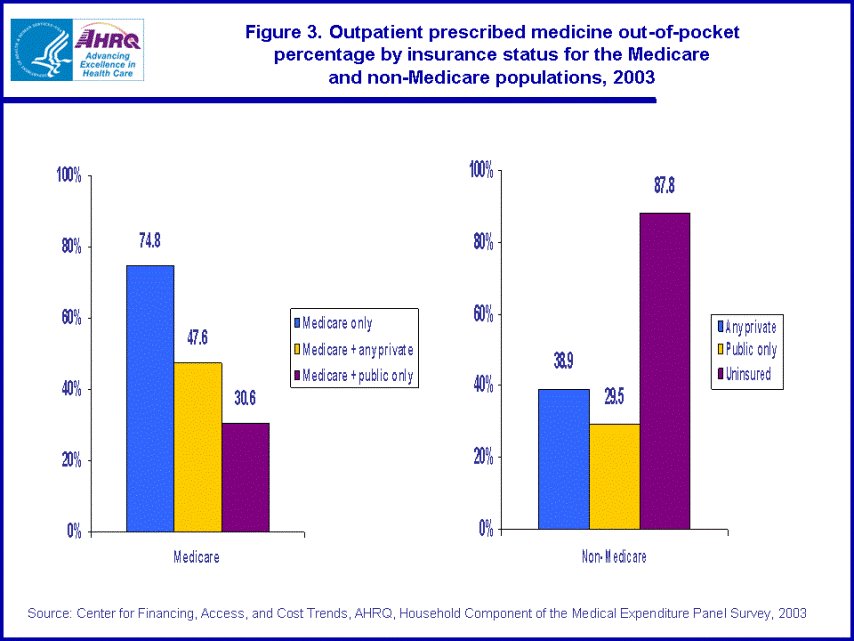
- In 2003, Medicare beneficiaries who did not have supplemental health insurance paid for three-quarters of their prescribed drug expenses out of pocket.
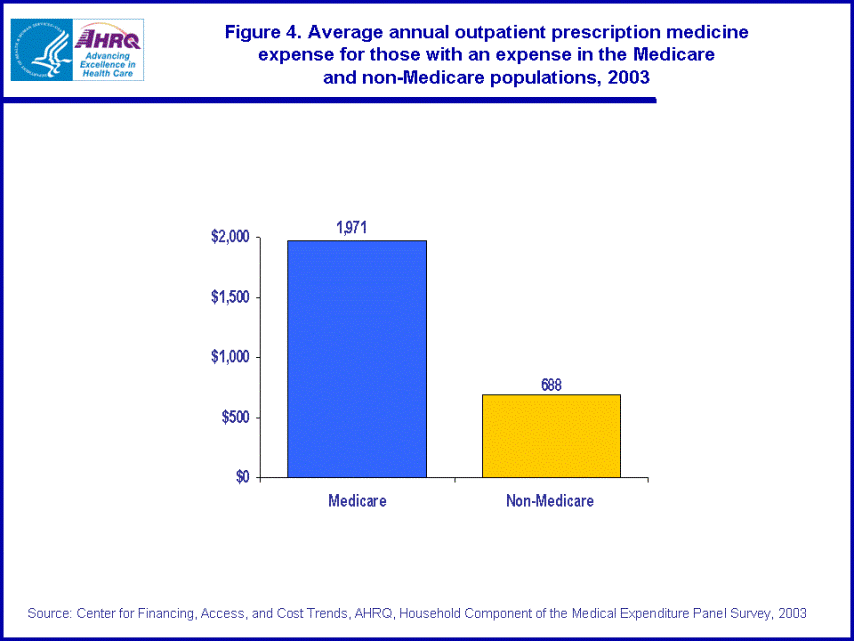
- For those with a prescribed drug expense, the average prescription drug expense per Medicare beneficiary ($1,971) was more than twice as large as the average expense per person in the non-Medicare population ($688).
- The average out-of-pocket expense for Medicare beneficiaries with a prescription drug expense was highest for those people with no coverage other than Medicare ($1,353).
- In 2003, for Medicare beneficiaries with a prescription drug expense, the average total drug expense was not significantly different between those with Medicare only and those with Medicare and any private insurance.
Introduction
This Statistical Brief presents 2003 data from the Household Component of the Medical Expenditure Panel Survey (MEPS-HC) for the Medicare and non-Medicare subpopulations in the U.S. civilian noninstitutionalized (community) population on prescribed medicine expenditures, by sources of payment and insurance status. Only prescribed medicine purchases in an outpatient setting are included in the estimates. Over-the-counter medicines are excluded from the estimates. All differences discussed in the text are statistically significant at the 0.05 level.
Findings
In 2003, outpatient prescription drug expenses totaled $177.7 billion, with total prescription drug expenses for the Medicare population at $75.3 billion and total prescription drug spending by the non-Medicare population at $102.4 billion (figure 1).
In 2003, out-of-pocket payments accounted for about half (51.0 percent) of total prescription medicine expenses for Medicare beneficiaries and for two-fifths (40.4 percent) of total prescription medicine expenses for the non-Medicare population. The 21.1 percent of prescription expenses paid by private insurance for Medicare beneficiaries was less than half of the 46.3 percent paid by private insurance for the non-Medicare population. In addition, the 28.0 percent paid by public insurance and other sources was over twice as large for Medicare beneficiaries as the 13.3 percent paid for the non-Medicare population by public and other sources. (figure 2)
In 2003, Medicare beneficiaries who did not have supplemental health insurance paid for three-quarters of their prescribed drug expenses out of pocket (74.8 percent). The out-of-pocket percentage was smaller for Medicare beneficiaries with any private insurance (47.6 percent) and for Medicare beneficiaries with public insurance only (30.6 percent). Medicare beneficiaries with additional public insurance only had the lowest out-of-pocket percentage. (figure 3)
In the non-Medicare population, uninsured people paid 87.8 percent of their prescribed drug expenses out of pocket in 2003. The out-of-pocket percentage was smaller for people with any private insurance (38.9 percent) or public insurance only (29.5 percent). The out-of-pocket percentage for those with public insurance only was smaller than those with any private insurance. (figure 3)
In 2003, for those with a prescribed drug expense, the average annual drug expense per Medicare beneficiary was more than double the average annual expense for the non-Medicare population ($1,971 versus $688). (figure 4)
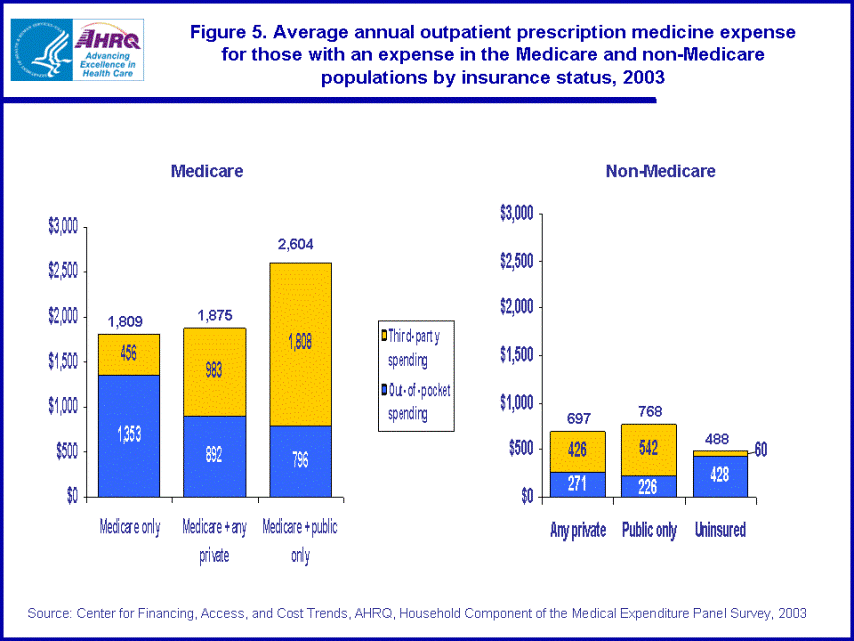
In 2003, the average annual prescription medicine expense for Medicare beneficiaries with an expense was higher for those people with public insurance only coverage in addition to Medicare ($2,604) than those with no coverage other than Medicare ($1,809) and those with Medicare coverage and any private insurance ($1,875). There was no significant difference in the average annual prescription drug expense when comparing Medicare beneficiaries with only Medicare and those beneficiaries with Medicare and any private insurance. (figure 5)
The average annual out-of-pocket expense for Medicare beneficiaries with a prescription drug expense was highest for those people with no coverage other than Medicare ($1,353) compared with those with Medicare and any private insurance ($892) and those with Medicare and public only insurance ($796) in 2003. There was no significant difference in the average annual out-of-pocket expense between those with Medicare and any private and those with Medicare and public only. (figure 5)
In the non-Medicare population in 2003, for those with an expense, the uninsured had the lowest average annual total expense ($488) but the highest average annual out-of-pocket expense ($428) when compared with those with public insurance only ($768 and $226, respectively) and those with any private insurance ($697 and $271, respectively). Moreover, those with any private insurance had a higher average annual out-of-pocket expense than those with public insurance only; however, there was no significant difference when comparing total average annual expense for these two groups. (figure 5)
Definitions
Population
- Medicare beneficiary/non-Medicare population: People are considered Medicare beneficiaries if they ever report being covered by Medicare while in the survey. This classification also includes a very small number of persons age 65 and older who did not report Medicare coverage. All others are considered members of the non-Medicare population.
- Out-of-pocket: This category includes payments by user or family.
- Private insurance: Private insurance includes payments made by major medical insurance plans covering hospital and medical care (excluding payments from Medicare, Medicaid, and other public sources). Payments from Medigap plans for Medicare beneficiaries, TRICARE and other private are included. Payments from plans that provide coverage for a single service only, such as dental or vision coverage, are not included.
- Public insurance: Public insurance includes Medicare; Medicaid; Department of Veterans Affairs (excluding TRICARE); other Federal sources (Indian Health Service, military treatment facilities, and other care provided by the Federal Government); various State and local sources (community and neighborhood clinics, State and local health departments, and State programs other than Medicaid); Medicaid payments reported for persons who were not enrolled in the Medicaid program at any time during the year; and other public sources of payment.
- Other: This category includes Workers' Compensation; unclassified sources (automobile, homeowner's, or liability insurance and other miscellaneous or unknown sources); and any type of private insurance payments reported for people without private health insurance coverage during the year.
Individuals under age 65 were classified into the following three insurance categories:
- Any private health insurance: Individuals with insurance that provides coverage for hospital and physician care at any time during the year, other than Medicare, Medicaid, or other public hospital/physician coverage, are classified as having private insurance. Medigap coverage is included in this category. Persons with TRICARE are also included. Insurance that provides coverage for a single service only, such as dental or vision, is not included.
- Public coverage only: Individuals are considered to have public coverage only if they met both of the following criteria: 1) They were not covered by private insurance at any time during the year. 2) They were covered by one of the following public programs at any point during the year: Medicare, Medicaid, or other public hospital/physician coverage.
- Uninsured: The uninsured are defined as persons not covered by Medicare, TRICARE, Medicaid, other public hospital/physician programs, or private hospital/physician insurance at any time during 2003. Individuals covered only by noncomprehensive State-specific programs (e.g., Maryland Kidney Disease Program, Colorado Child Health Plan) or private single-service plans (e.g., coverage for dental or vision care only, coverage for accidents or specific diseases) are not considered to be insured.
- Medicare and private insurance: This category includes persons classified as Medicare beneficiaries and covered by Medicare and a supplementary private policy.
- Medicare and other public insurance: This category includes persons classified as Medicare beneficiaries who met both of the following criteria: 1) They were not covered by private insurance at any point during the year. 2) They were covered by one of the following public programs at any point during the year: Medicaid, other public hospital/physician coverage.
- Medicare only: This category includes persons classified as Medicare beneficiaries but not classified as Medicare and private insurance or as Medicare and other public insurance. This group includes persons who were enrolled in Medicare HMOs and persons who had Medicare fee-for-service coverage only.
About MEPS-HC
MEPS-HC is a nationally representative longitudinal survey that collects detailed information on health care utilization and expenditures, health insurance, and health status, as well as a wide variety of social, demographic, and economic characteristics for the civilian noninstitutionalized population. It is cosponsored by the Agency for Healthcare Research and Quality and the National Center for Health Statistics.
For more information about MEPS, call the MEPS information coordinator at AHRQ (301-427-1656) or visit the MEPS Web site at http://www.meps.ahrq.gov/.
References
For a detailed description of the MEPS-HC survey design, sample design, and methods used to minimize sources of nonsampling error, see the following publications:
Cohen, J. Design and Methods of the Medical Expenditure Panel Survey Household Component. MEPS Methodology Report No. 1. AHCPR Pub. No. 97-0026. Rockville, Md.: Agency for Health Care Policy and Research, 1997.
Cohen, S. Sample Design of the 1996 Medical Expenditure Panel Survey Household Component. MEPS Methodology Report No. 2. AHCPR Pub. No. 97-0027. Rockville, Md.: Agency for Health Care Policy and Research, 1997.
Cohen, S. Design Strategies and Innovations in the Medical Expenditure Panel Survey. Medical Care, July 2003: 41(7) Supplement: III-5-III-12.
Suggested Citation
Stagnitti, M. N. Outpatient Prescribed Medicine Expenses by Source of Payment and Insurance Status for the Medicare and Non-Medicare Populations, 2003. Statistical Brief #125. May 2006. Agency for Healthcare Research and Quality, Rockville, Md. http://www.meps.ahrq.gov/mepsweb/data_files/publications/st125/stat125.shtml
AHRQ welcomes questions and comments from readers of this publication who are interested in obtaining more information about access, cost, use, financing, and quality of health care in the United States. We also invite you to tell us how you are using this Statistical Brief and other MEPS data and tools and to share suggestions on how MEPS products might be enhanced to further meet your needs. Please e-mail us at mepspd@ahrq.gov or send a letter to the address below:
Steven B. Cohen, PhD, Director
Center for Financing, Access, and Cost Trends
Agency for Healthcare Research and Quality
540 Gaither Road
Rockville, MD 20850
 |
||||||||||||||||||||||||||||||||||||||||||||||||
|
||||||||||||||||||||||||||||||||||||||||||||||||
|
|
||||||||||||||||||||||||||||||||||||||||||||||||
 |
||||||||||||||||||||||||||||||||||||||||||||||||
|
||||||||||||||||||||||||||||||||||||||||||||||||
|
|
||||||||||||||||||||||||||||||||||||||||||||||||
 |
||||||||||||||||||||||||||||||||||||||||||||||||
|
||||||||||||||||||||||||||||||||||||||||||||||||
|
|
||||||||||||||||||||||||||||||||||||||||||||||||
 |
||||||||||||||||||||||||||||||||||||||||||||||||
|
||||||||||||||||||||||||||||||||||||||||||||||||
|
|
||||||||||||||||||||||||||||||||||||||||||||||||
 |
||||||||||||||||||||||||||||||||||||||||||||||||
|
||||||||||||||||||||||||||||||||||||||||||||||||
|
|
||||||||||||||||||||||||||||||||||||||||||||||||


