
|
|
Font Size:
|
||||
|
|
|
|
||||
STATISTICAL BRIEF #128:
Changes in Out-of-Pocket Maximum Limits for Employer-Sponsored Health Insurance Plans, 1999-2003
Highlights
- In 2003, about 71 percent of employees with single or family coverage through employment-sponsored health insurance had a plan with a limit on their maximum out-of-pocket medical expenses. This was an increase from about 64 percent in 1999.
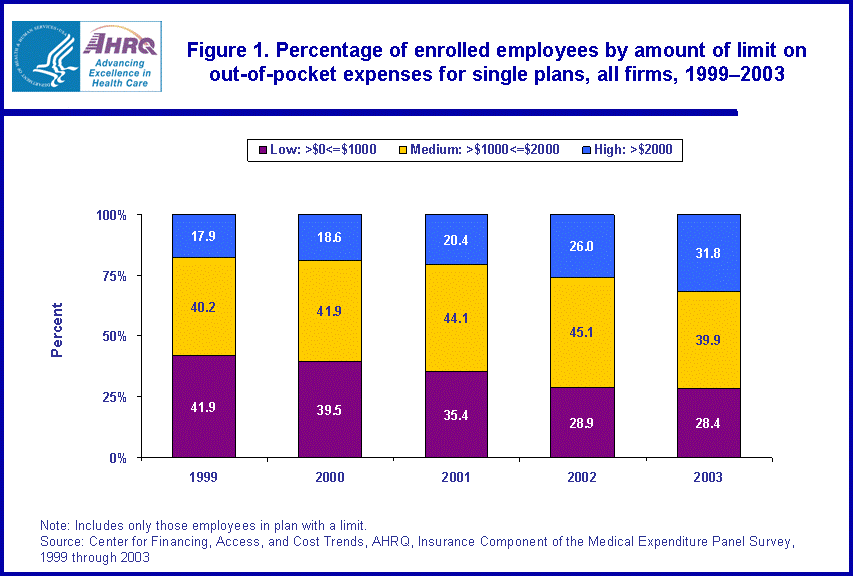
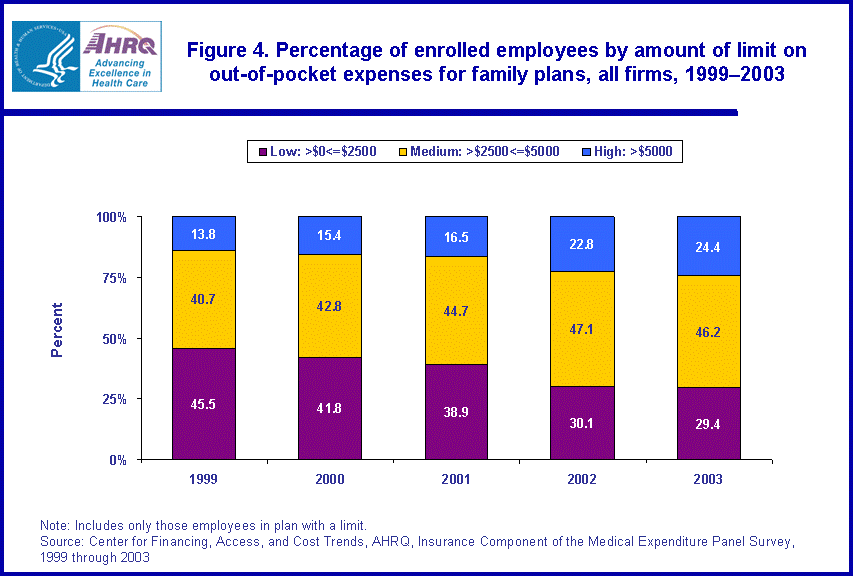
- Between 1999 and 2003, the percentage of enrollees in a plan with a high maximum limit increased considerably for both those in single (17.9 percent to 31.8 percent) and family (13.8 percent to 24.4 percent) plans.
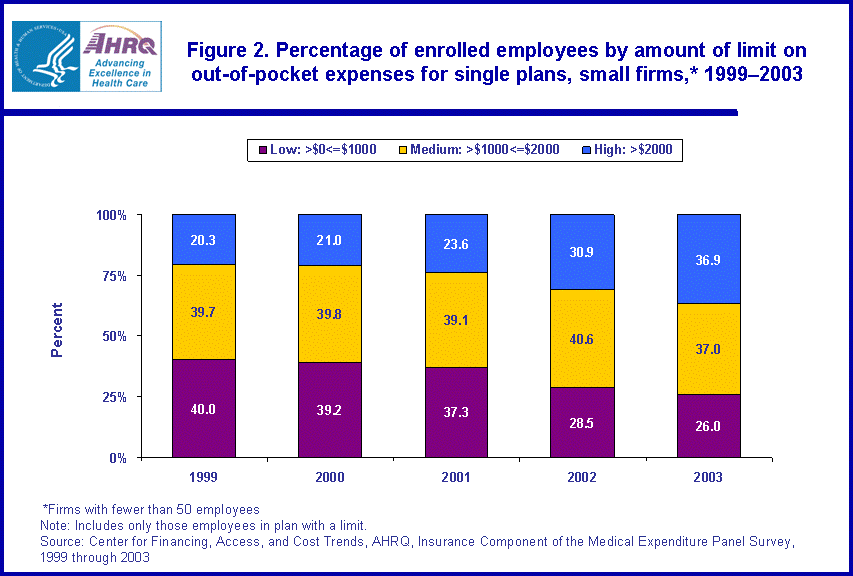
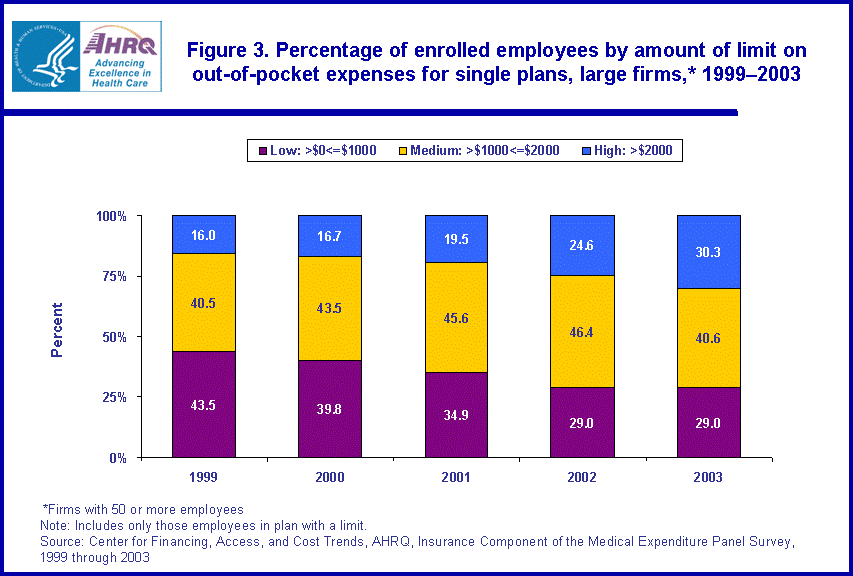
- For both small and large employers, the percentage of employees enrolled in single and family plans with low out-of-pocket limits fell between 1999 and 2003.
Introduction
In response to the rapid rise in health care costs and health insurance premiums over the past decade, many firms have adjusted the maximum out-of-pocket expense limit faced by employees enrolled in employer-sponsored plans. This Statistical Brief discusses changes in the percentage of employees covered by health insurance policies with various limits on their maximum out-of-pocket expenses from 1999 to 2003.
The estimates shown in this brief, which are drawn from the Insurance Component of the Medical Expenditure Panel Survey (MEPS-IC), pertain to employees of firms in the private sector of the economy who are enrolled in an employer-sponsored health insurance plan. Data for employees working for small (fewer than 50 employees) and large firms (50 or more employees) are analyzed. All differences between estimates discussed in the text are statistically significant at the 0.05 level.
Findings
Single coverage
In 1999, 64.4 percent of enrolled employees were covered by a plan that put a limit on the amount of out-of-pocket expenses they would have to pay for services under single coverage. The remaining 35.6 percent had no limit on their out-of-pocket costs. By 2003, 71.2 percent of employees with single coverage were in a plan that had a limit on total expenses, while 28.8 percent were not. The pattern for small and large firms separately was similar to the all-firm results. (Estimates not shown in figures.)
For those with a limit on out-of-pocket expenses, maximum individual out-of-pocket expense limits are categorized as follows:
- Out-of-pocket limit more than $0 but less than or equal to $1000 (low)
- Out-of-pocket limit more than $1000 but less than or equal to $2000 (medium)
- Out-of-pocket limit more than $2000 (high)
In 1999, 41.9 percent of enrolled employees with single coverage had a plan with a low out-of-pocket expense limit. By 2003, this percentage had fallen to 28.4 percent. In contrast, the percentage of enrollees with a high out-of-pocket maximum rose between 1999 and 2003, from 17.9 percent to 31.8 percent. Most of this increase occurred between 2001 and 2003.
The percentage of employees who were enrolled in single plans with medium out-of-pocket limits did not change significantly between 1999 and 2003.
For both small and large employers, the percentage of enrollees with low out-of-pocket limits fell between 1999 and 2003, from 40.0 percent to 26.0 percent for firms with fewer than 50 employees and from 43.5 percent to 29.0 percent for firms with 50 or more employees (figures 2 and 3). Conversely, for employees in both small and large firms, the percentage in single-coverage plans with high limits on their out-of-pocket payments increased over this time period. For small firms, the percentage of enrollees increased from 20.3 percent to 36.9 percent, while it went from 16.0 percent to 30.3 percent in large firms.
Family coverage
In 1999, 64.5 percent of employees were covered by a plan that put a limit on the amount of out-of-pocket expenses they would have to pay for services under family coverage. The remaining 35.5 percent had no limit on their out-of-pocket costs. By 2003, 70.7 percent of employees with family coverage were in a plan that had a limit on total expenses, while 29.3 percent were in a plan that did not. Employees of small and large firms had percentages very close to the all-firm average for both years. (Estimates not shown in figures.)
For those with a cap on out-of-pocket expenses, maximum family out-of-pocket limits are categorized as follows:
- Out-of-pocket limit more than $0 but less than or equal to $2500 (low)
- Out-of-pocket limit more than $2500 but less than or equal to $5000 (medium)
- Out-of-pocket limit more than $5000 (high)
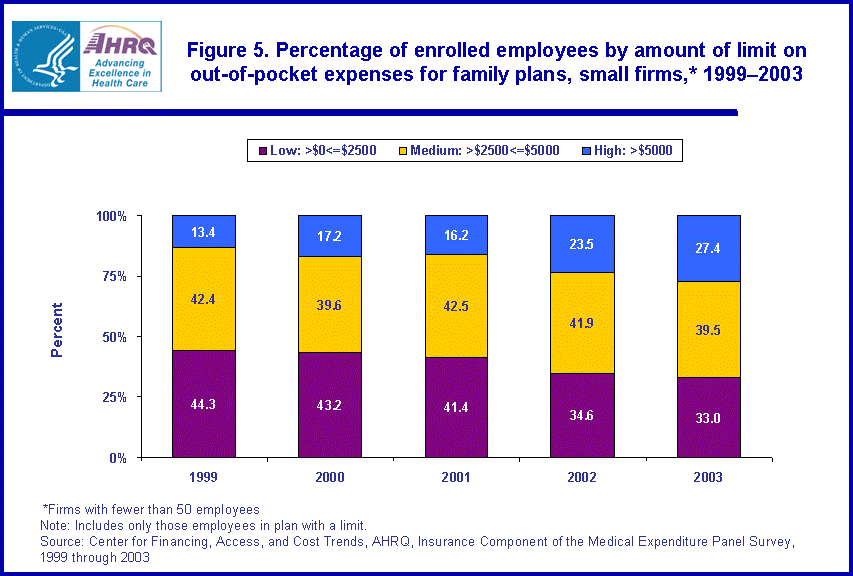
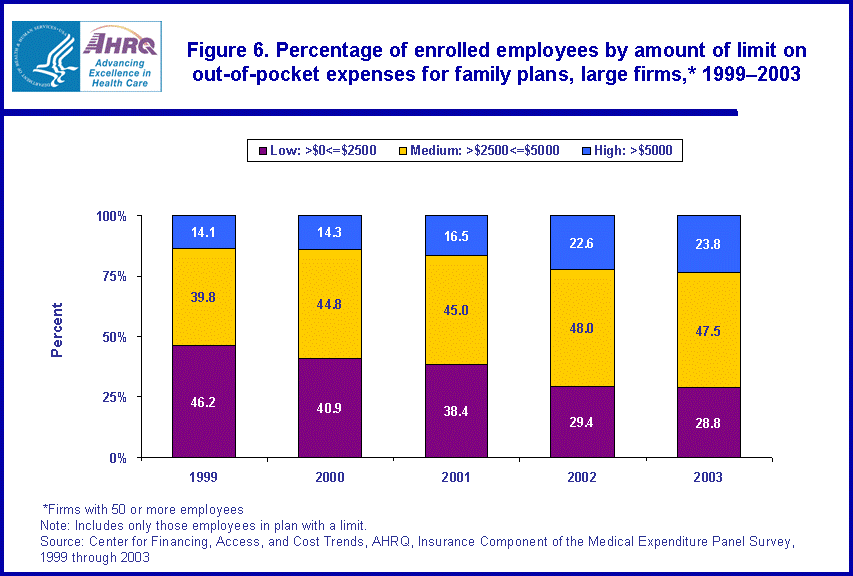
In 1999, 45.5 percent of enrolled employees had a plan with a low out-of-pocket family limit. By 2003, this percentage had fallen to 29.4 percent. During the same time period, the percentage of enrollees with a medium out-of-pocket maximum increased from 40.7 percent to 46.2 percent; and the percentage with a high maximum nearly doubled, increasing from 13.8 percent to 24.4 percent.
Consistent with the trend in all firms, the percentage of employees enrolled in family plans with a low limit on out-of-pocket expenses fell between 1999 and 2003 in both small and large firms (figures 5 and 6). However, this decrease was larger for firms with 50 employees or more (from 46.2 percent to 28.8 percent) than for smaller firms (from 44.3 percent to 33.0 percent). The decrease in the percentage of enrollees in large firms with low out-of-pocket maximums was accompanied by an increase in the percentage with limits in the medium range. For small firms, however, there was no significant change from 1999 to 2003 in the medium group.
During the time period 1999-2003, enrolled employees in both small and large firms experienced an increase in the percentage with a high maximum limit on their out-of-pocket expenses. For small firms, the percentage of enrollees in family plans with a high out-of-pocket limit increased from 13.4 percent to 27.4 percent, while the percentage in large firms with high maximum limits went from 14.1 percent to 23.8 percent.
Data Source
This Statistical Brief summarizes data from the MEPS-IC for 1999 through 2003. The data are available on the MEPS Web site (http://www.meps.ahrq.gov) or have been produced using special computation runs on the confidential MEPS-IC data available at the U.S. Census Bureau.
The analysis and results presented in this paper are attributable to the authors and do not necessarily reflect concurrence by the Center for Economic Studies, U.S. Census Bureau. This paper has undergone a more limited review by the Census Bureau than official Census publications. It has been screened to ensure that no confidential data are revealed.
Definitions
Maximum out-of-pocket expense
The maximum dollar amount a group member is required to pay out of pocket during a year. Until this maximum is met, the plan and group member share in the cost of covered expenses. After the maximum is reached, the insurance carrier pays all covered expenses, often up to a lifetime maximum. The maximum limits in this analysis are not adjusted for inflation.
Employee
A person on the actual payroll. Excludes temporary and contract workers but includes the owner or manager if that person works at the firm.
Firm
A business entity consisting of one or more business establishments under common ownership or control. A firm represents the entire organization, including the company headquarters and all divisions, subsidiaries, and branches. A firm may consist of a single-location establishment, in which case the establishment and firm are identical.
Health insurance plan
An insurance contract that provides hospital and/or physician coverage to an employee for an agreed-upon fee (premium) for a defined benefit period.
About MEPS-IC
MEPS-IC is a survey of business establishments and governments that collects information on employer-sponsored health insurance, such as whether insurance is offered, enrollments, types of plans, and premiums. The survey is conducted annually by the U.S. Census Bureau under the sponsorship of the Agency for Healthcare Research and Quality. The yearly response rate has averaged 78 percent for in-scope sample units. Approximately 4 percent of the original sample has been out-of-scope in a typical year. A total sample of 48,000 establishments was selected for the 2003 survey, prior to accounting for losses due to nonresponse and out-of-scope cases.
For more information on this survey, see MEPS Methodology Reports 6, 8, 10, and 14 and the MEPS-IC technical appendix, which can be found on the MEPS Web site (http://www.meps.ahrq.gov).
Suggested Citation
Taylor, A. K., Crimmel, B. L., and Zawacki, A. M. Changes in Out-of-Pocket Maximum Limits for Employer-Sponsored Health Insurance Plans, 1999-2003. Statistical Brief #128. June 2006. Agency for Healthcare Research and Quality, Rockville, Md. http://www.meps.ahrq.gov/mepsweb/data_files/publications/st128/stat128.shtml
AHRQ welcomes questions and comments from readers of this publication who are interested in obtaining more information about access, cost, use, financing, and quality of health care in the United States. We also invite you to tell us how you are using this Statistical Brief and other MEPS data and tools and to share suggestions on how MEPS products might be enhanced to further meet your needs. Please e-mail us at mepspd@ahrq.gov or send a letter to the address below:
Steven B. Cohen, PhD, Director
Center for Financing, Access, and Cost Trends
Agency for Healthcare Research and Quality
540 Gaither Road
Rockville, MD 20850
 |
||||||||||||||||||||||||||||||||||||
|
||||||||||||||||||||||||||||||||||||
|
|
||||||||||||||||||||||||||||||||||||
 |
||||||||||||||||||||||||||||||||||||
|
||||||||||||||||||||||||||||||||||||
|
|
||||||||||||||||||||||||||||||||||||
 |
||||||||||||||||||||||||||||||||||||
|
||||||||||||||||||||||||||||||||||||
|
|
||||||||||||||||||||||||||||||||||||
 |
||||||||||||||||||||||||||||||||||||
|
||||||||||||||||||||||||||||||||||||
|
|
||||||||||||||||||||||||||||||||||||
 |
||||||||||||||||||||||||||||||||||||
|
||||||||||||||||||||||||||||||||||||
|
|
||||||||||||||||||||||||||||||||||||
 |
||||||||||||||||||||||||||||||||||||
|
||||||||||||||||||||||||||||||||||||
|
|
||||||||||||||||||||||||||||||||||||


