
|
|
Font Size:
|
||||
|
|
|
|
||||
STATISTICAL BRIEF #187:
Cholesterol Screening among the U.S. Noninstitutionalized Adult Population Age 20 and Older, 2005
Highlights
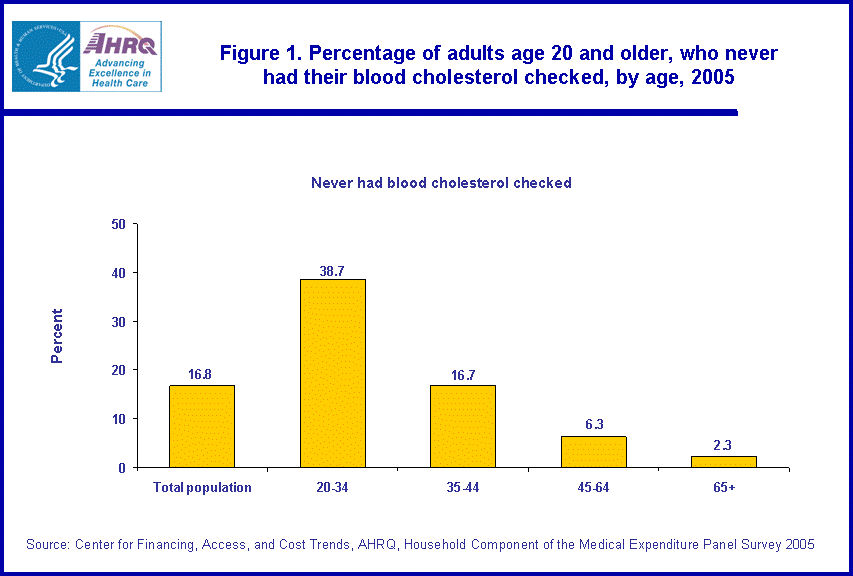
- Almost 17 percent (16.8 percent) of the U.S. civilian noninstitutionalized population age 20 and older population reported that they have never had their blood cholesterol checked by a health professional.
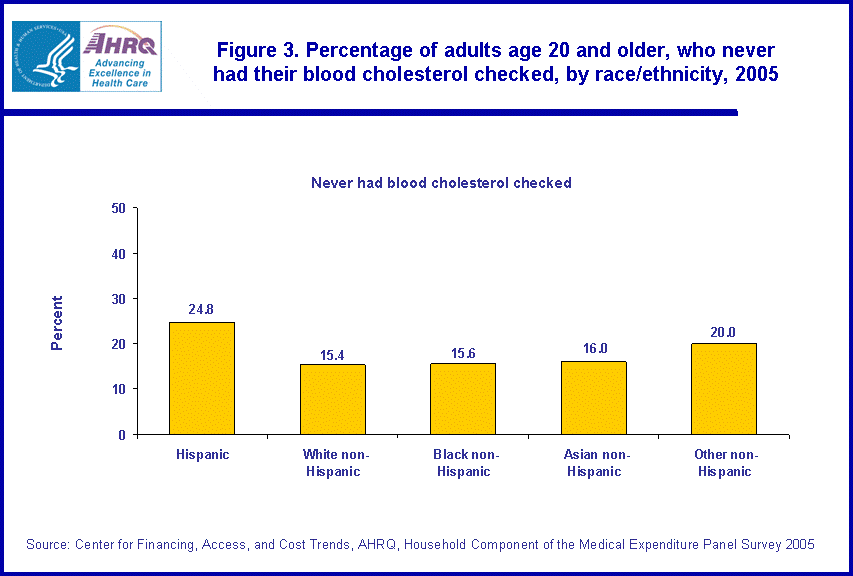
- One-fourth of Hispanic adults age 20 and older reported that they have never had their blood cholesterol checked by a health professional.
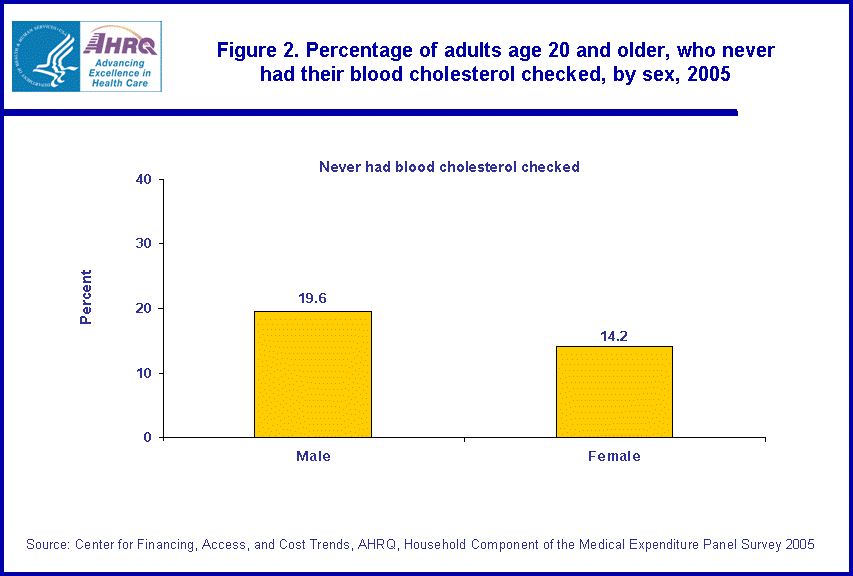
- One-fifth of adult males age 20 and older reported they have never have had their blood cholesterol checked.
- More than one-third of uninsured adults between the age of 20 and 64 reported that they have never had their blood cholesterol checked.
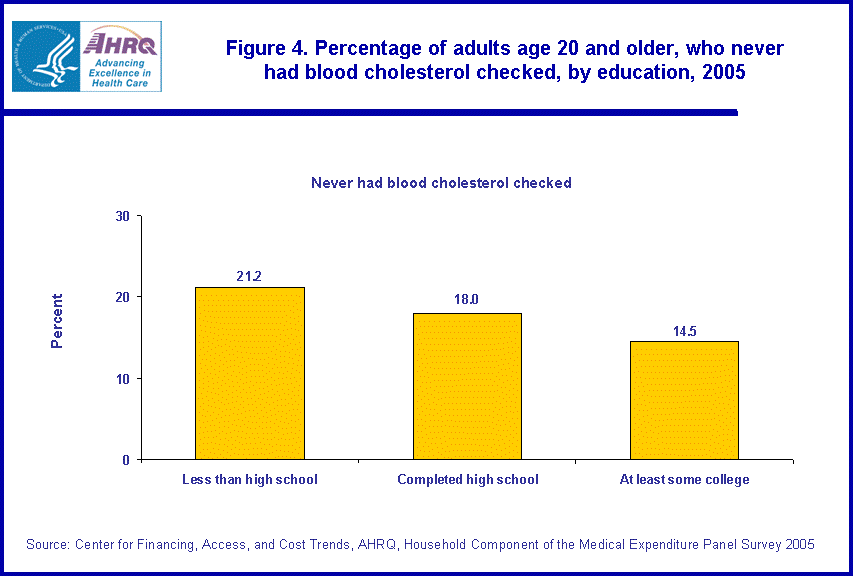
- More than one-fifth (21.2 percent) of those with less than a high school education reported they have never had their blood cholesterol checked by a health professional.
Introduction
High blood cholesterol has been associated with hardening of the arteries, heart disease, and a raised risk of death from heart attack. Cholesterol testing is recommended as a screening test to be done on all adults age 20 and older at least once every five years. It is frequently done in conjunction with a routine physical exam.
The U.S. Preventive Services Task Force (USPSTF) strongly recommends that clinicians routinely screen men age 35 years and older and women age 45 years and older for lipid disorders and treat abnormal lipids in people who are at increased risk of coronary heart disease.
This Statistical Brief estimates cholesterol testing among the U.S. civilian noninstitutionalized population age 20 and older. The estimates presented are derived from data collected in the questionnaire used in the Household Component of the Medical Expenditure Panel Survey (MEPS-HC). All differences discussed in the text are statistically significant at the 0.05 level or better.
Findings
In 2005, almost 36 million or about 17 (16.8) percent of the U.S. civilian noninstitutionalized population age 20 and older reported that they have never had their blood cholesterol checked by a health professional (figure 1).
Age
Getting a blood cholesterol check was found to be strongly related to age. A higher percentage of those in the younger age group (20 to 34) reported never having had their blood cholesterol checked compared with those in the older age groups (35 to 44, 45 to 64, and 65 and older) at 38.7 percent versus 16.7 percent, 6.3 percent, and 2.3 percent, respectively (figure 1).
Sex
A higher percentage of adult males age 20 and older reported never having had their blood cholesterol checked compared with females in the same age group (19.6 percent versus 14.2 percent) (figure 2).
Race/ethnicity
One-fourth (24.8 percent) of Hispanic adults age 20 and older reported that they have never had their blood cholesterol checked by a health professional. This percentage was much higher than that for non-Hispanic whites, non-Hispanic blacks, and non-Hispanic Asians (24.8 percent versus 15.4 percent, 15.6 percent, and 16.0 percent, respectively) (figure 3).
Educational level
Adults age 20 and older with at least some college education were less likely to have reported that they have never had their blood cholesterol checked by a health professional than those who had only a high school education or less than a high school education (14.5 percent versus 18.0 percent and 21.2 percent, respectively) (figure 4).
Metropolitan areas
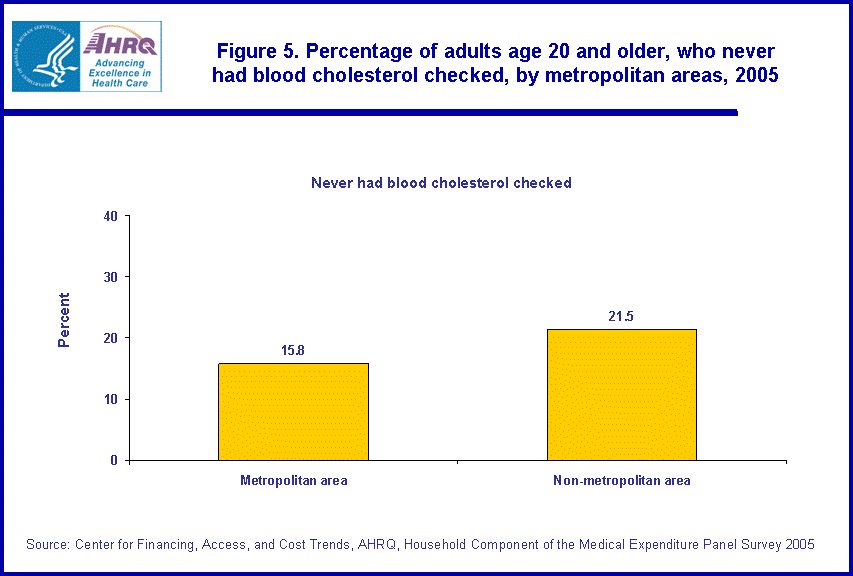
A higher percentage of adults age 20 and older who lived in non-metropolitan areas reported that they have never had their blood cholesterol checked by a health professional compared with those who lived in metropolitan areas (21.5 percent versus 15.8 percent) (figure 5).
Insurance status
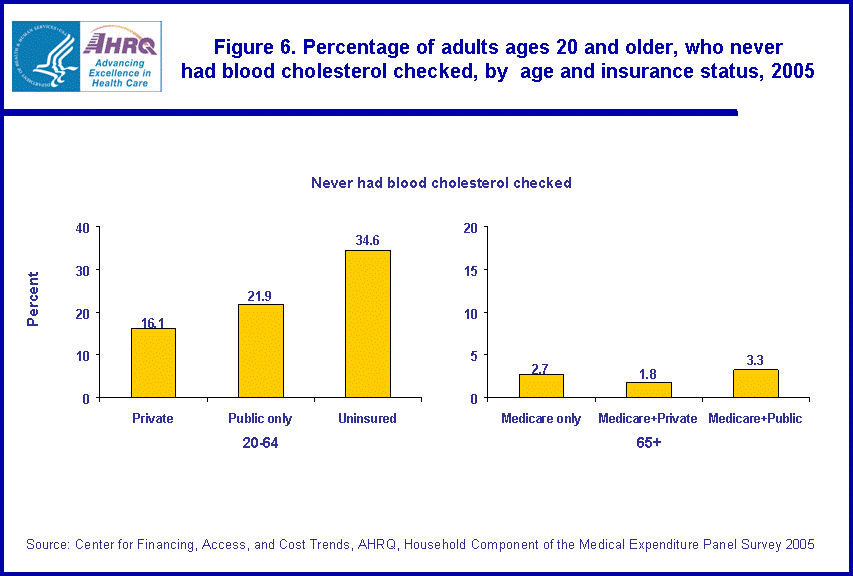
Among adults age 20 to 64, those who were uninsured were much more likely to have never had their blood cholesterol checked by a health professional than those who had either private or public insurance (34.6 percent versus 16.1 percent and 21.9 percent, respectively) (figure 6).
Data Source
The estimates in this Statistical Brief were derived from the MEPS 2005 Full Year Population Characteristics data file (HC-090).
Definitions
The question on having cholesterol checks was asked in the Preventive Care section of the MEPS-HC questionnaire.
Heart disease indicators
The indicators for heart disease were drawn from variables indicating the presence of heart disease (coronary heart disease, angina, heart attack, stroke, or any other heart-related disease). For each of the conditions listed, the following question was asked: "(Have/Has) PERSON ever been told by a doctor or other health professional that PERSON had [condition]."
Racial and ethnic classifications
Classification by race and ethnicity was based on information reported for each family member. Respondents were asked if each family member was Hispanic or Latino. Respondents were also asked which race or races best described each family member. Race categories included white, black/African American, American Indian or Alaska Native, Asian, Native Hawaiian or other Pacific Islander, and other. Based on these questions, sample persons were classified into the following race/ethnicity categories: Hispanic, white non-Hispanic single race, black non-Hispanic single race, Asian non-Hispanic single race, and other (Hawaiian/Pacific Islander non-Hispanic, American Indian/Alaska Native non-Hispanic, and multiple races non-Hispanic).
Educational level
Respondents were asked to report the highest grade of schooling ever completed by each family member as of the date of the interview: not a high school graduate, high school graduate, or some college.
Health insurance status
Individuals under age 65 were classified into the following three insurance categories based on household responses to the health insurance status questions:
- Any private health insurance: Individuals who, at any time during the year, had insurance that provided coverage for hospital and physician care (other than Medicare, Medicaid, or other public hospital/physician coverage) were classified as having private insurance. Coverage by TRICARE (Armed Forces-related coverage) was also included as private health insurance. Insurance that provided coverage for a single service only, such as dental or vision coverage, was not included.
- Public coverage only: Individuals were considered to have public coverage only if they met both of the following criteria: 1) they were not covered by private insurance at any time during the year, and 2) they were covered by one of the following public programs at some point during the year: Medicare, Medicaid, or other public hospital/physician coverage.
- Uninsured: The uninsured were defined as people not covered by private hospital/physician insurance, Medicare, TRICARE, Medicaid, or other public hospital/physician programs at any time during the entire year or their period of eligibility for the survey.
- Medicare only: Individuals who, at any time during the year, were covered by Medicare only.
- Medicare plus private: Individuals who at any time during the year, were covered by a combination of Medicare, TRICARE or private insurance.
- Medicare plus other public coverage: Individuals who, at any time during the year, were covered by Medicare and some other type of public insurance, but had no private coverage.
Metropolitan areas are metropolitan statistical areas (MSAs) designated by the U.S. Office of Management and Budget that are composed of a large population nucleus combined with adjacent communities that have a high degree of economic and social integration with the nucleus. An MSA has one or more central counties containing the area's main population concentration.
About MEPS-HC
MEPS-HC is a nationally representative longitudinal survey that collects detailed information on health care utilization and expenditures, health insurance, and health status, as well as a wide variety of social, demographic, and economic characteristics for the civilian noninstitutionalized population. It is cosponsored by the Agency for Healthcare Research and Quality and the National Center for Health Statistics.
For more information about MEPS, call the MEPS information coordinator at AHRQ (301-427-1406) or visit the MEPS Web site at http://www.meps.ahrq.gov/.
References
For a detailed description of the MEPS survey design, sample design, and methods used to minimize sources of nonsampling error, see the following publications:
Cohen, J. Design and Methods of the Medical Expenditure Panel Survey Household Component. MEPS Methodology Report No. 1. AHCPR Pub. No. 97-0026. Rockville, Md.: Agency for Health Care Policy and Research, 1997.
Cohen, S. Sample Design of the 1996 Medical Expenditure Panel Survey Household Component. MEPS Methodology Report No. 2. AHCPR Pub. No. 97-0027. Rockville, Md.: Agency for Health Care Policy and Research, 1997.
Cohen, S. Design Strategies and Innovations in the Medical Expenditure Panel Survey. Medical Care, July 2003: 41(7) Supplement: III-5-III-12.
For information on heart disease, lipid disorders, and cholesterol testing and treatment, see the following:
ABCs of Preventing Heart Disease, Stroke and Heart Attack, American Heart Association, Feb. 2007, Cholesterol: http://www.Americanheart.org
Know Your Numbers: It's National Cholesterol Education Month: Centers for Disease Control and Prevention, Atlanta, Ga., September 2007. http://www.cdc.gov/Features/Cholesterol/
Screening for Lipid Disorders in Adults: http://www.ahrq.gov/clinic/uspstf/uspschol.htm
Cholesterol: http://www.labtestsonline.org/understanding/analytes/cholesterol/test.html
Detection, Evaluation, and Treatment of the High Blood Cholesterol in Adults (Adult Treatment Panel III): http://www.nhlbi.nih.gov/guidelines/cholesterol/atp_iii.htm
Suggested Citation
Soni, A. Cholesterol Screening among the U.S. Noninstitutionalized Adult Population Age 20 and Older, 2005. Statistical Brief #187. October 2007. Agency for Healthcare Research and Quality, Rockville, Md. http://www.meps.ahrq.gov/mepsweb/data_files/publications/st187/stat187.shtml
AHRQ welcomes questions and comments from readers of this publication who are interested in obtaining more information about access, cost, use, financing, and quality of health care in the United States. We also invite you to tell us how you are using this Statistical Brief and other MEPS data and tools and to share suggestions on how MEPS products might be enhanced to further meet your needs. Please e-mail us at mepsprojectdirector@ahrq.hhs.gov or send a letter to the address below:
Steven B. Cohen, PhD, Director
Center for Financing, Access, and Cost Trends
Agency for Healthcare Research and Quality
540 Gaither Road
Rockville, MD 20850
 |
||||||||||||||||||||||||||||||||
|
||||||||||||||||||||||||||||||||
|
|
||||||||||||||||||||||||||||||||
 |
||||||||||||||||||||||||||||||||
|
||||||||||||||||||||||||||||||||
|
|
||||||||||||||||||||||||||||||||
 |
||||||||||||||||||||||||||||||||
|
||||||||||||||||||||||||||||||||
|
|
||||||||||||||||||||||||||||||||
 |
||||||||||||||||||||||||||||||||
|
||||||||||||||||||||||||||||||||
|
|
||||||||||||||||||||||||||||||||
 |
||||||||||||||||||||||||||||||||
|
||||||||||||||||||||||||||||||||
|
|
||||||||||||||||||||||||||||||||
 |
||||||||||||||||||||||||||||||||
|
||||||||||||||||||||||||||||||||
|
|
||||||||||||||||||||||||||||||||


