Highlights
Access to Care
Getting urgent care when needed
Overall, 34.4 percent of the U.S. civilian noninstitutionalized population age 18 or older (69.2 million) reported that they had an illness or injury that needed care right away from a doctor's office, clinic, or emergency room. Slightly more than half of those needing urgent care (53.8%) said they always received care as soon as they wanted. Older people were more likely than adults under age 65 to say they needed urgent care (33.6% for age 18-64 and 38.4% for age 65 and older) and of those needing care, older people were more likely than adults under age 65 to say they always received care as soon as they wanted (51.3% for age 18-64 and 65.7% for age 65 and older) (figure 1a). Among those age 18-64, whites were more likely than Hispanics to say they needed urgent care (29.1% of Hispanics, 33.6% of blacks, 34.7% of whites, and 26.4% of others) and among those needing care whites were more likely than Hispanics to say they always received care as soon as they wanted (41.2% of Hispanics, 51.5% of blacks, 52.9% of whites and 42.3% of others) (figure 1b). Also among those age 18-64, those with only public insurance were the most likely to have an illness or injury needing urgent care (44.1% for public only, 33.0% for any private, and 30.9% for uninsured) and among those getting urgent care, the uninsured were more likely than those with insurance to report sometimes or never receiving urgent care as soon as they wanted (28.6% of uninsured, 19.1% of public only, 16.1% of any private) (figure 1c).
Receiving care when needed
Obtaining an appointment as soon as wanted
Overall, 68.1 percent of the survey population aged 18 and over (137 million) reported making any appointment with a doctor or other health provider for care in the last 12 months. Older people were more likely than adults age 18-64 to make an appointment (51.2% age 18-24, 59.8% age 25-44, 75.4% age 45-64 and 88.8% age 65 and older). Of those who made an appointment, fewer than half (43.0%) reported always obtaining one as soon as they wanted and one out of every five said they sometimes or never got one as soon as they wanted (20%). Age plays a key role in whether a person who made an appointment always obtained one as soon as they wanted. Older adults were much more likely than adults under age 65 to say they always obtained an appointment as soon as they wanted (40.0% for age 18-64 vs. 54.7% for age 65 and older) and adults age 18-64 were nearly twice as likely as older ones to say they sometimes or never obtained an appointment as soon as wanted (21.8% vs. 12.3%) (figure 2a). Among those age 18-64, the uninsured were less likely than those with insurance to make an appointment (43.3% of uninsured, 68.8% of any private and 72.9% of public only) and among those with an appointment, the uninsured were also more likely than the insured to report sometimes or never obtaining an appointment as soon as they wanted (27.6% of uninsured, 21.1% of any private, and 19.2% of public only) (figure 2b).
Going to a doctor's office/clinic for care and problems receiving needed care
Overall, 72.3 percent of the survey population aged 18 and over (145.4 million) reported going to a doctor's office or clinic to get care in the last 12 months and of those receiving care, 82.6 percent reported that they had no problems receiving the care they or their doctor believed necessary. As with obtaining an appointment, older people were more likely than adults under age 65 to report going to a doctor's office or clinic for care. Overall, those describing their health status as fair/poor were more likely than those who said their health was excellent or good/very good to receive care and among those receiving care, persons describing their health as fair/poor were less likely than those in better health to indicate it was not a problem receiving needed care (86.2% for excellent, 79.1% for good/very good, and 74.3% for fair/poor) (figure 3a). Among those age 18-64, the uninsured were less likely than those with public-only insurance or with any private insurance to go for care (48.9% of uninsured, 77.8% of public only and 74.1% of any private insurance) and of those receiving care, the uninsured and those with public only coverage were less likely than those with any private insurance to say it was no problem receiving needed care (72.9% of uninsured, 71.5% of public only, and 84.5% of any private insurance) (figure 3b).
Experiences During Care
Patients were asked to report on their experiences over the last 12 months during visits to a doctor's office or clinic to get care. They were asked how often during visits their health providers listened carefully to them, explained things in a way they could understand, and showed respect for what they had to say. They were also asked if, during their visits, their health providers spent enough time with them.
Health providers listening carefully to patients: Overall, 56.4% of those who made one or more visits to a doctor's office or clinic for care in the last 12 months said their health providers always listened carefully to them (56.4% always, 33.4% usually, and 10.2% sometimes or never). Among those with one or more visits to a doctor's office or clinic, people age 65 and older were more likely than adults under age 65 to say their providers always listened carefully to them (54.2% for 18-24, 52.1% for 25-44, 57.1% for 45-64, and 64.8% for 65 and older). Among those age 18-64 who made one or more visits, persons describing their health as fair/poor were more likely than those saying their health was excellent or good/very good to say their providers sometimes or never listened carefully to them (9.0% for excellent, 12.8% for good/very good, and 17.6% for fair/poor health status) (figure 4).
Explaining care to patients: A majority of those with one or more visits to a doctor's office or clinic for care indicated that their health providers always explained things in a way they could understand (58.6%) while nearly 10 percent said their providers sometimes or never explained things so they understood (9.1%). Older people (65 and older) were more likely than adults age 18-24 to say their providers always explained things so they understood (54.5% for age 18-24, 58.1% for age 25-44, 59.2% for age 45-64, and 60.7% for age 65 and older). Blacks were more likely than other race/ethnicity groups to say their health providers always explained things so they understood (53.1% of Hispanics, 64.4% of blacks, 58.6% of whites, and 53.1% of others). Among those age 18-64, the uninsured and those with only public insurance were more likely than persons with any private insurance to say providers sometimes or never explained things so they understand (15.3% of uninsured, 16.1% of public only, and 7.4% of any private). (figure 5).
Showing respect to patients: A majority of those with one or more visits to a doctor's office or clinic for care reported that their health providers always showed respect for what they had to say (58.4% always, 31.8% usually, and 9.8% sometimes or never). Older people were more likely than adults under age 65 to say their providers always showed respect (55.1% of age 18-24, 54.8% of age 25-44, 59.5% of age 45-64 and 65.3% of age 65 and older). Among those age 18-64, persons describing their health as fair/poor were more likely to say their providers sometimes or never showed respect than those reporting their health as good/very good or excellent (17.7% of fair/poor, 12.4% of good/very good, and 8.3% of those with excellent health) (figure 6).
Spending enough time with patients: Among those with one or more visits to a doctor's office or clinic for care, fewer than half said that their health providers always spent enough time with them (45.3% always, 38.7% usually, and 15.9% sometimes or never). Those age 65 and older were more likely than adults age 18-24 to say their health providers always spent enough time with them (41.1% of age 18-24, 41.2% of age 25-44, 47.9% of age 45-64 and 51.4% of those age 65 and older). Among those age 18-64, the uninsured were more likely than those with insurance to say their providers sometimes or never spent enough time with them (23.5% of uninsured, 15.9% of any private, and 17.3% of public only) (figure 7). |
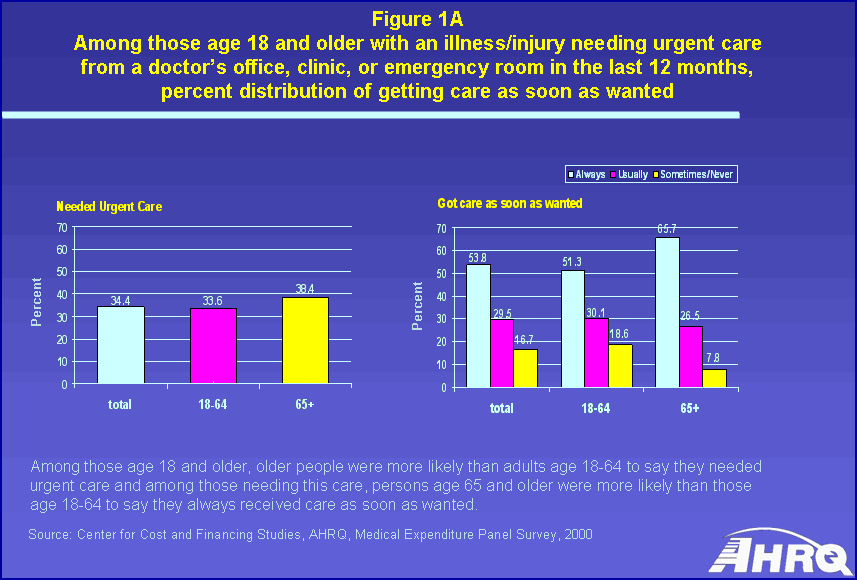 |
| Figure 1A. Among those age 18 and older with an illness/injury needed urgent care from a doctor's office, clinic, or emergency room in the last 12 months, percent distribution of getting care as soon as wanted |
| Percent | 34.4 | 33.6 | 38.4 |
Among those age 18 and older, older people were more likely than adults age 18-64 to say they needed urgent care among those needing this care, persons age 65 and older were more likely than those age 18-64 to say they always received care as soon as wanted.
Source: Center for Cost and Financing Studies, AHRQ, Medical Expenditure Panel Survey, 2000 |
| Figure 1A. Among those age 18 and older with an illness/injury needed urgent care from a doctor's office, clinic, or emergency room in the last 12 months, percent distribution of getting care as soon as wanted |
| Always | 53.8% | 51.3% | 65.7% |
| Usually | 29.5% | 30.1% | 26.5% |
| Sometimes/Never | 16.7% | 18.6% | 7.8% |
Among those age 18 and older, older people were more likely than adults age 18-64 to say they needed urgent care among those needing this care, persons age 65 and older were more likely than those age 18-64 to say they always received care as soon as wanted.
Source: Center for Cost and Financing Studies, AHRQ, Medical Expenditure Panel Survey, 2000 |
|
|
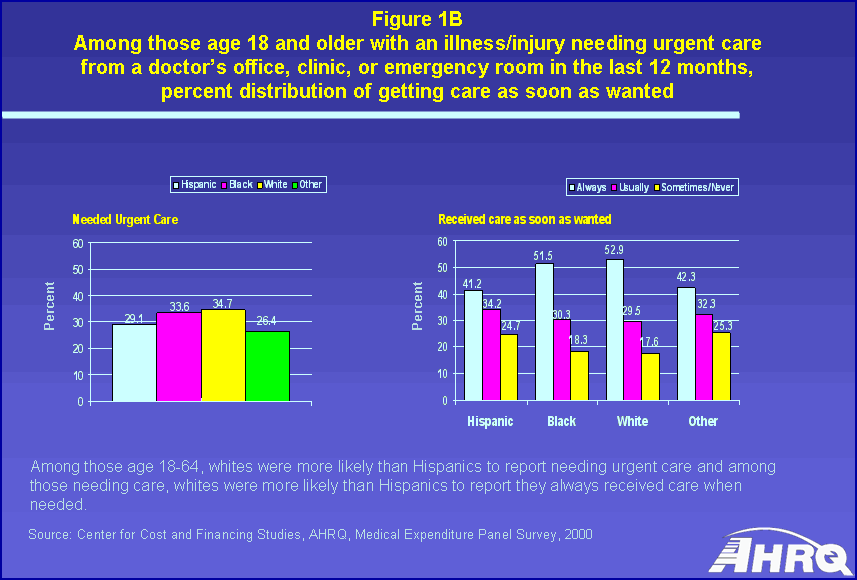 |
| Figure 1B. Among those age 18-64 with an illness/injury needed urgent care from a doctor's office, clinic, or emergency room in the last 12 months, percent distribution of getting care as soon as wanted |
| Percent | 29.1 | 33.6 | 34.7 | 26.4 |
Among those age 18-64, whites were more likely than Hispanics to report needing urgent care and among those needing care, whites were more likely than Hispanics to report they always received care when needed.
Source: Center for Cost and Financing Studies, AHRQ, Medical Expenditure Panel Survey, 2000 |
| Figure 1B. Among those age 18-64 with an illness/injury needed urgent care from a doctor's office, clinic, or emergency room in the last 12 months, percent distribution of getting care as soon as wanted |
| Always | 41.2% | 51.5% | 52.9% | 42.3% |
| Usually | 34.2% | 30.3% | 29.5% | 32.3% |
| Sometimes/Never | 24.7% | 18.3% | 17.6% | 25.3% |
Among those age 18-64, whites were more likely than Hispanics to report needing urgent care and among those needing care, whites were more likely than Hispanics to report they always received care when needed.
Source: Center for Cost and Financing Studies, AHRQ, Medical Expenditure Panel Survey, 2000 |
|
|
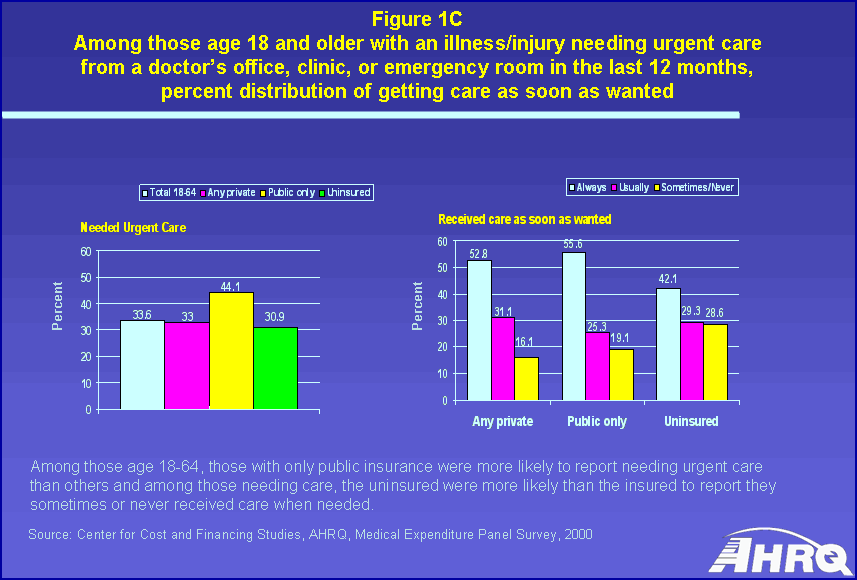 |
| Figure 1C. Among those age 18-64 with an illness/injury needed urgent care from a doctor's office, clinic, or emergency room in the last 12 months, percent distribution of getting care as soon as wanted |
| Percent | 33.6 | 33 | 44.1 | 30.9 |
Among those age 18-64, those with only public insurance were more likely to report needing urgent care than others and among those needing care, the uninsured were more likely than the insured to report they sometimes or never received care when needed.
Source: Center for Cost and Financing Studies, AHRQ, Medical Expenditure Panel Survey, 2000 |
| Figure 1C. Among those age 18-64 with an illness/injury needed urgent care from a doctor's office, clinic, or emergency room in the last 12 months, percent distribution of getting care as soon as wanted |
| Always | 52.8% | 55.6% | 42.1% |
| Usually | 31.1% | 25.3% | 29.3% |
| Sometimes/Never | 16.1% | 19.1% | 28.6% |
Among those age 18-64, those with only public insurance were more likely to report needing urgent care than others and among those needing care, the uninsured were more likely than the insured to report they sometimes or never received care when needed.
Source: Center for Cost and Financing Studies, AHRQ, Medical Expenditure Panel Survey, 2000 |
|
|
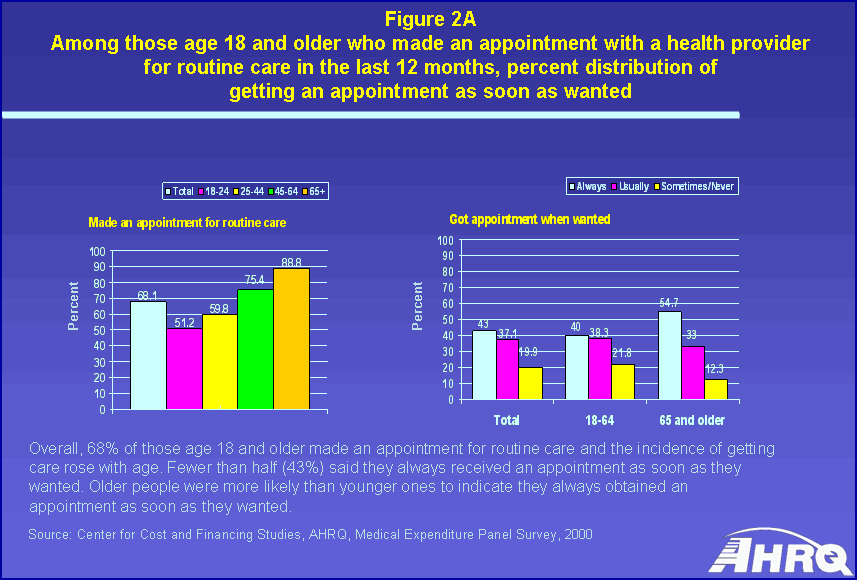 |
| Figure 2A. Among those age 18 and older who made an appointment with a health provider for routine care in the last 12 months, percent distribution of getting an appointment as soon as wanted |
| Percent | 68.1 | 51.2 | 59.8 | 75.4 | 88.8 |
Overall, 68% of those age 18 and older made an appointment for routine care and the incidence of getting care rose with age. Fewer than half (43%) said they always received an appointment as soon as they wanted. Older people were more likely than younger ones to indicate they always obtained an appointment as soon as they wanted.
Source: Center for Cost and Financing Studies, AHRQ, Medical Expenditure Panel Survey, 2000 |
| Figure 2A. Among those age 18 and older who made an appointment with a health provider for routine care in the last 12 months, percent distribution of getting an appointment as soon as wanted |
| Always | 43% | 40% | 54.7% |
| Usually | 37.1% | 38.3% | 33% |
| Sometimes/Never | 19.9% | 21.8% | 12.3% |
Overall, 68% of those age 18 and older made an appointment for routine care and the incidence of getting care rose with age. Fewer than half (43%) said they always received an appointment as soon as they wanted. Older people were more likely than younger ones to indicate they always obtained an appointment as soon as they wanted.
Source: Center for Cost and Financing Studies, AHRQ, Medical Expenditure Panel Survey, 2000 |
|
|
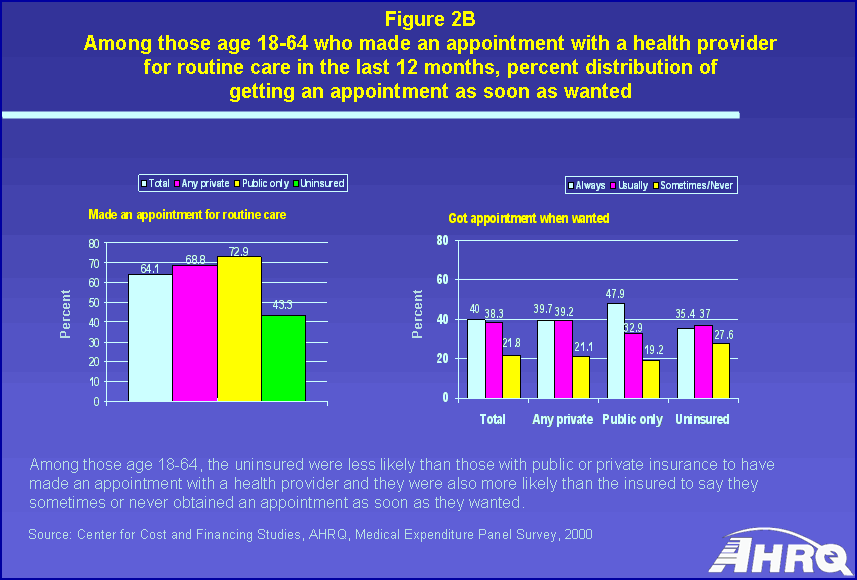 |
| Figure 2B. Among those age 18-64 who made an appointment with a health provider for routine care in the last 12 months, percent distribution of getting an appointment as soon as wanted |
| Percent | 64.1 | 68.8 | 72.9 | 43.3 |
Among those age 18-64, the uninsured were less likely than those with public or private insurance to have made an appointment with a health provider and they were also more likely than the insured to say they sometimes or never obtained an appointment as soon as they wanted.
Source: Center for Cost and Financing Studies, AHRQ, Medical Expenditure Panel Survey, 2000 |
| Figure 2B. Among those age 18-64 who made an appointment with a health provider for routine care in the last 12 months, percent distribution of getting an appointment as soon as wanted |
| Always | 40% | 39.7% | 47.9% | 35.4% |
| Usually | 38.3% | 39.2% | 32.9% | 37% |
| Sometimes/Never | 21.8% | 21.1% | 19.2% | 27.6% |
Among those age 18-64, the uninsured were less likely than those with public or private insurance to have made an appointment with a health provider and they were also more likely than the insured to say they sometimes or never obtained an appointment as soon as they wanted.
Source: Center for Cost and Financing Studies, AHRQ, Medical Expenditure Panel Survey, 2000 |
|
|
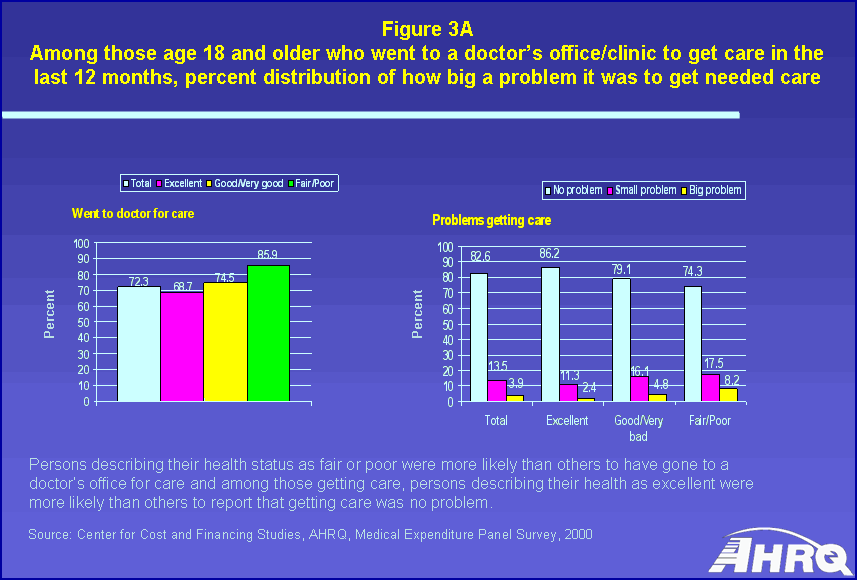 |
| Figure 3A. Among those age 18 and older who went to a doctor's office/clinic to get care in the last 12 months, percent distribution of how big a problem it was to get needed care |
| Percent | 72.3 | 68.7 | 74.5 | 85.9 |
Persons describing their health status as fair or poor were more likely than others to have gone to a doctor's office for care and among those getting care, persons describing their health as excellent were more likely than others to report that getting care was no problem.
Source: Center for Cost and Financing Studies, AHRQ, Medical Expenditure Panel Survey, 2000 |
| Figure 3A. Among those age 18 and older who went to a doctor's office/clinic to get care in the last 12 months, percent distribution of how big a problem it was to get needed care |
| No problem | 82.6% | 86.2% | 79.1% | 74.3% |
| Small problem | 13.5% | 11.3% | 16.1% | 17.5% |
| Big problem | 3.9% | 2.4% | 4.8% | 8.2% |
Persons describing their health status as fair or poor were more likely than others to have gone to a doctor's office for care and among those getting care, persons describing their health as excellent were more likely than others to report that getting care was no problem.
Source: Center for Cost and Financing Studies, AHRQ, Medical Expenditure Panel Survey, 2000 |
|
|
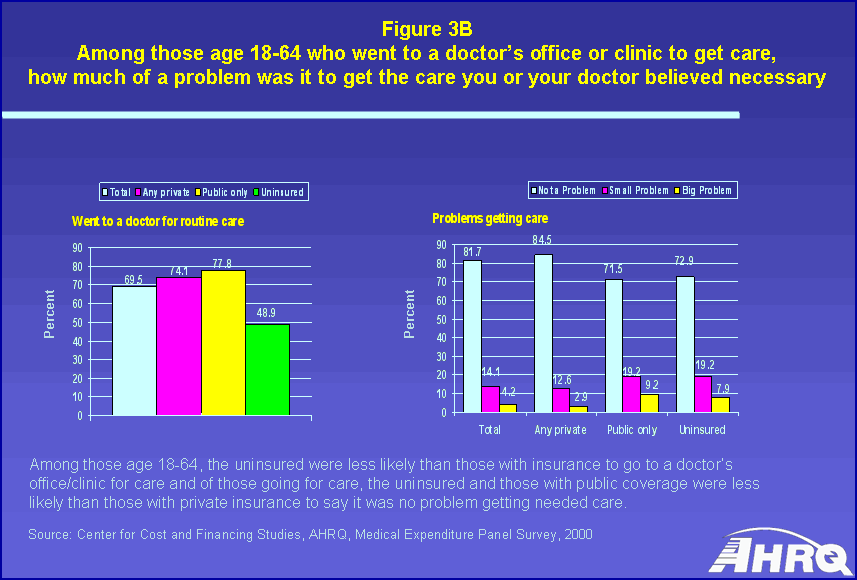 |
| Figure 3B. Among those age 18-64 who went to a doctor's office/clinic to get care, how much of a problem was it to get the care you or your doctor believed necessary |
| Percent | 69.5 | 74.1 | 77.8 | 48.9 |
Among those age 18-64, the uninsured were less likely than those with insurance to go to a doctor's office/clinic for care and of those going for care, the uninsured and those with public coverage were less likely than those with private insurance to say it was no problem getting needed care.
Source: Center for Cost and Financing Studies, AHRQ, Medical Expenditure Panel Survey, 2000 |
| Figure 3B. Among those age 18-64 who went to a doctor's office/clinic to get care, how much of a problem was it to get the care you or your doctor believed necessary |
| Not a Problem | 81.7% | 84.5% | 71.5% | 72.9% |
| Small Problem | 14.1% | 12.6% | 19.2% | 19.2% |
| Big Problem | 4.2% | 2.9% | 9.2% | 7.9% |
Among those age 18-64, the uninsured were less likely than those with insurance to go to a doctor's office/clinic for care and of those going for care, the uninsured and those with public coverage were less likely than those with private insurance to say it was no problem getting needed care.
Source: Center for Cost and Financing Studies, AHRQ, Medical Expenditure Panel Survey, 2000 |
|
|
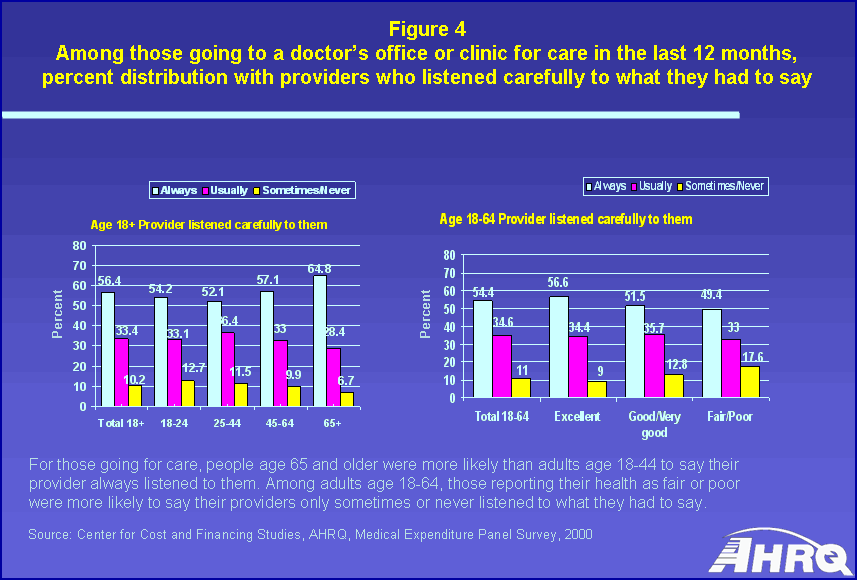 |
| Figure 4. Among those going to a doctor's office or clinic for care in the last 12 months, percent distribution with providers who listened carefully to what they had to say |
| Always | 56.4% | 54.2% | 52.1% | 57.1% | 64.8% |
| Usually | 33.4% | 33.1% | 36.4% | 33% | 28.4% |
| Sometimes/Never | 10.2% | 12.7% | 11.5% | 9.9% | 6.7% |
For those going for care, people age 65 and older were more likely than adults age 18-44 to say their provider always listened to them. Among adults age 18-64, those reporting their health as fair or poor were more likely to say their providers only sometimes or never listened to what they had to say.
Source: Center for Cost and Financing Studies, AHRQ, Medical Expenditure Panel Survey, 2000 |
| Figure 4. Among those going to a doctor's office or clinic for care in the last 12 months, percent distribution with providers who listened carefully to what they had to say |
| Always | 54.4% | 56.6% | 51.5% | 49.4% |
| Usually | 34.6% | 34.4% | 35.7% | 33% |
| Sometimes/Never | 11% | 9% | 12.8% | 17.6% |
For those going for care, people age 65 and older were more likely than adults age 18-44 to say their provider always listened to them. Among adults age 18-64, those reporting their health as fair or poor were more likely to say their providers only sometimes or never listened to what they had to say.
Source: Center for Cost and Financing Studies, AHRQ, Medical Expenditure Panel Survey, 2000 |
|
|
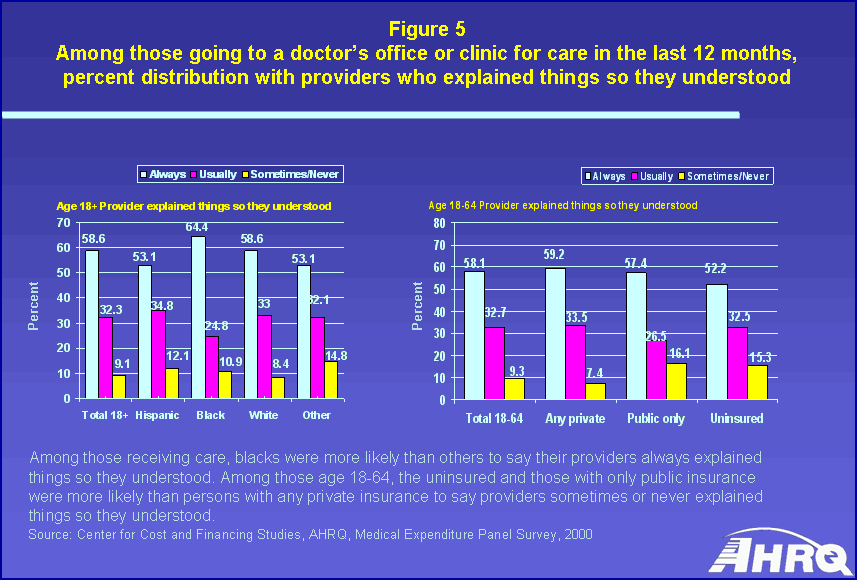 |
| Figure 5. Among those going to a doctor's office or clinic for care in the last 12 months, percent distribution with providers who explained things so they understood |
| Always | 58.6% | 53.1% | 64.4% | 58.6% | 53.1% |
| Usually | 32.3% | 34.8 | 24.8% | 33% | 32.1% |
| Sometimes/Never | 9.1% | 12.1% | 10.9% | 8.4% | 14.8% |
Among those receiving care, blacks were more likely than others to say their providers always explained things so they understood. Among those age 18-64, the uninsured and those with only public insurance were more likely than persons with any private insurance to say providers sometimes or never explained things so they understood.
Source: Center for Cost and Financing Studies, AHRQ, Medical Expenditure Panel Survey, 2000 |
| Figure 5. Among those going to a doctor's office or clinic for care in the last 12 months, percent distribution with providers who explained things so they understood |
| Always | 58.1% | 59.2% | 57.4% | 52.2% |
| Usually | 32.7% | 33.5% | 26.5% | 32.5% |
| Sometimes/Never | 9.3% | 7.4% | 16.1% | 15.3% |
Among those receiving care, blacks were more likely than others to say their providers always explained things so they understood. Among those age 18-64, the uninsured and those with only public insurance were more likely than persons with any private insurance to say providers sometimes or never explained things so they understood.
Source: Center for Cost and Financing Studies, AHRQ, Medical Expenditure Panel Survey, 2000 |
|
|
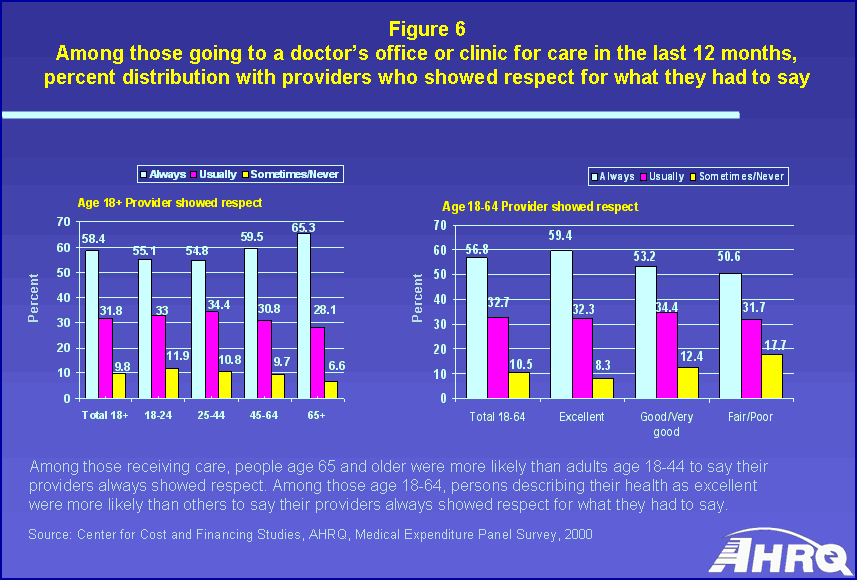 |
| Figure 6. Among those going to a doctor's office or clinic for care in the last 12 months, percent distribution with providers who showed respect for what they had to say |
| Always | 58.4% | 55.1% | 54.8% | 59.5% | 65.3% |
| Usually | 31.8% | 33% | 34.4% | 30.8% | 28.1% |
| Sometimes/Never | 9.8% | 11.9% | 10.8% | 9.7% | 6.6% |
Among those receiving care, people age 65 and older were more likely than adults age 18-44 to say their providers always showed them respect. Among those age 18-64, persons describing their health as excellent were more likely than others to say their providers always showed respect for what they had to say.
Source: Center for Cost and Financing Studies, AHRQ, Medical Expenditure Panel Survey, 2000 |
| Figure 6. Among those going to a doctor's office or clinic for care in the last 12 months, percent distribution with providers who showed respect for what they had to say |
| Always | 56.8% | 59.4% | 53.2% | 50.6% |
| Usually | 32.7% | 32.3% | 34.4% | 31.7% |
| Sometimes/Never | 10.5% | 8.3% | 12.4% | 17.7% |
Among those receiving care, people age 65 and older were more likely than adults age 18-44 to say their providers always showed them respect. Among those age 18-64, persons describing their health as excellent were more likely than others to say their providers always showed respect for what they had to say.
Source: Center for Cost and Financing Studies, AHRQ, Medical Expenditure Panel Survey, 2000 |
|
|
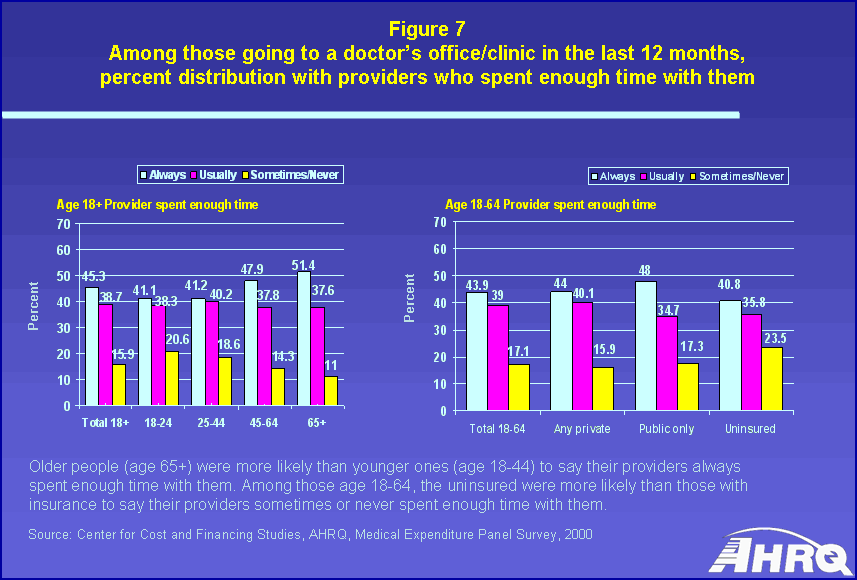 |
| Figure 7. Among those going to a doctor's office/clinic in the last 12 months, percent distribution with providers who spent enough time with them |
| Always | 45.3% | 41.1% | 41.2% | 47.9% | 51.4% |
| Usually | 38.7% | 38.3% | 40.2% | 37.8% | 37.6% |
| Sometimes/Never | 15.9% | 20.6% | 18.6% | 14.3% | 11% |
Older people (age 65+) were more likely than younger ones (age 18-44) to say their providers always spent enough time with them. Among those age 18-64, the uninsured were more likely than those with insurance to say their providers sometimes or never spent enough time with them.
Source: Center for Cost and Financing Studies, AHRQ, Medical Expenditure Panel Survey, 2000 |
| Figure 7. Among those going to a doctor's office/clinic in the last 12 months, percent distribution with providers who spent enough time with them |
| Always | 43.9% | 44% | 48% | 40.8% |
| Usually | 39% | 40.1% | 34.7% | 35.8% |
| Sometimes/Never | 17.1% | 15.9% | 17.3% | 23.5% |
Older people (age 65+) were more likely than younger ones (age 18-44) to say their providers always spent enough time with them. Among those age 18-64, the uninsured were more likely than those with insurance to say their providers sometimes or never spent enough time with them.
Source: Center for Cost and Financing Studies, AHRQ, Medical Expenditure Panel Survey, 2000 |
|
|
|


