
|
|
Font Size:
|
||||
|
|
|
|
||||
STATISTICAL BRIEF #332:
Health Expenditures among Children with Reported Treatment for Asthma, United States, 1997-1998 and 2007-2008
Highlights
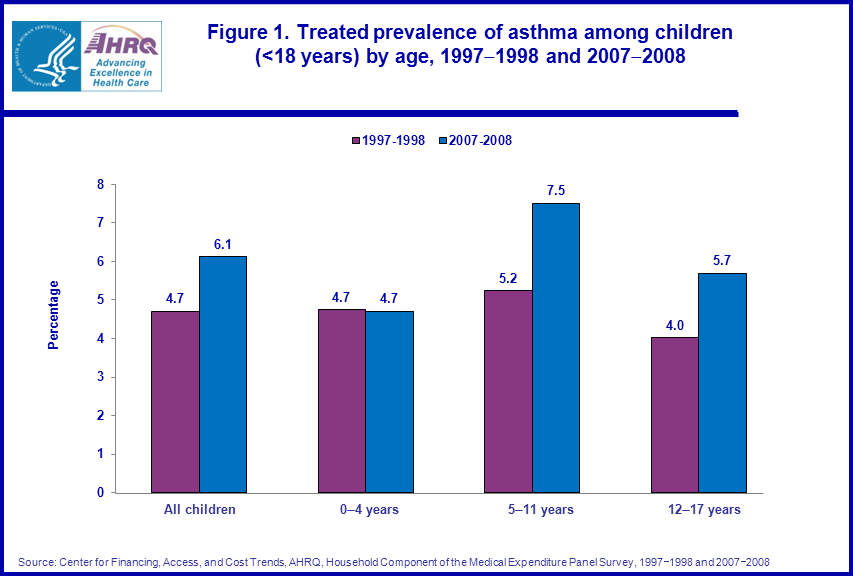
- The average annual proportion of children who reported treatment for asthma rose from 4.7 in 1997-1998 to 6.1 percent in 2007-2008.
- Children ages 5-11 were more likely to be treated for asthma (7.5 percent) in 2007-2008, compared to children ages 0-4 (4.7 percent) and ages 12-17 (5.7 percent).
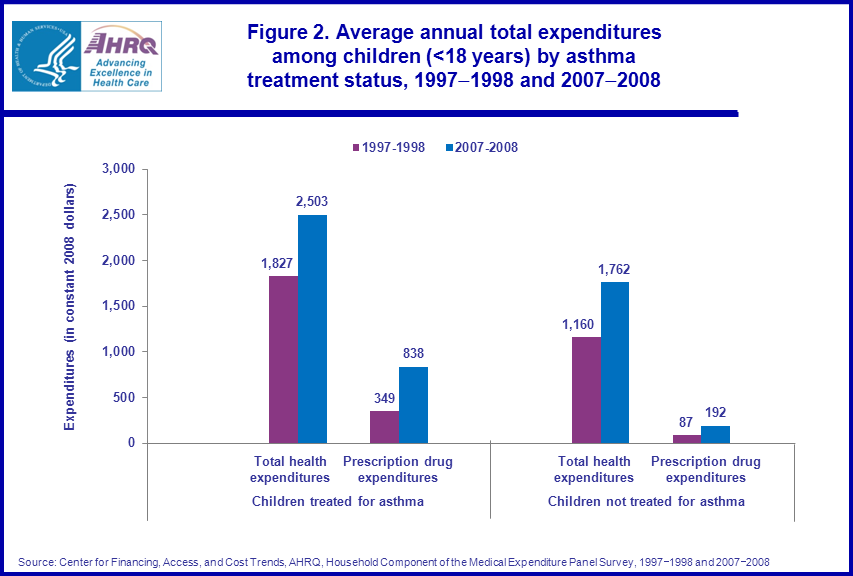
- Expenditures in both time periods were higher for children with reported treatment for asthma compared to those without treatment for asthma.
- Between 1997-1998 and 2007-2008, average prescription drug expenditures more than doubled for both children treated and not treated for asthma.
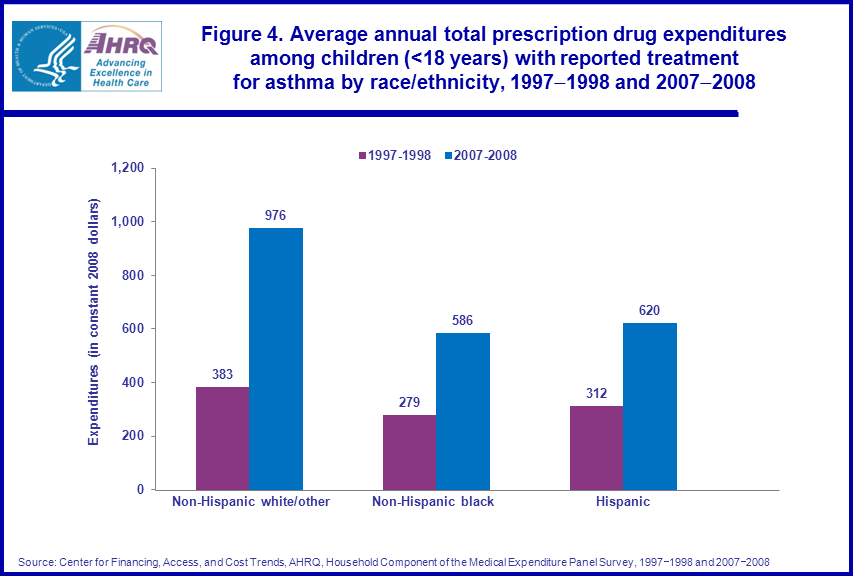
- Between 1997-1998 and 2007-2008, average annual prescription drug expenditures for Hispanics nearly doubled from $312 to $620 and more than doubled for non-Hispanic whites/other ($383 to $976) and non-Hispanic blacks ($279 to $586).
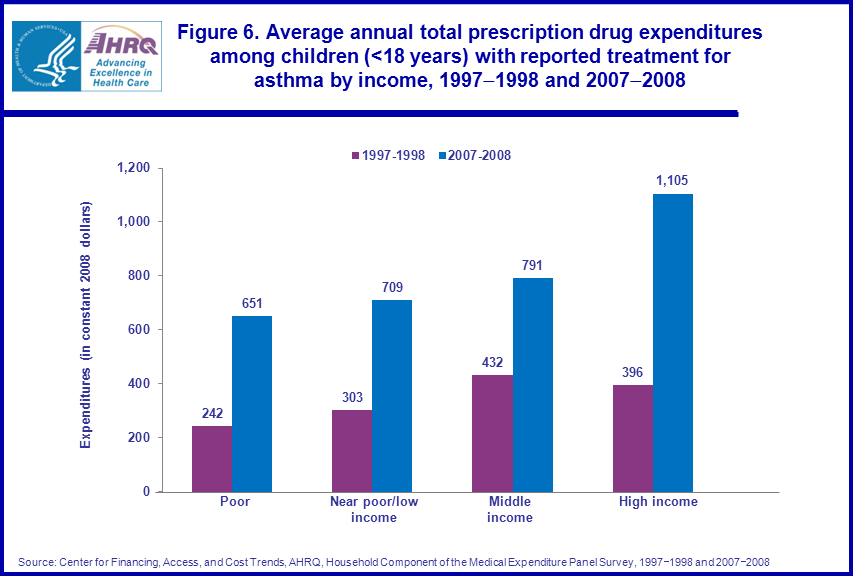
- Over the period, average annual prescription drug expenditures nearly doubled for those with middle family incomes and more than doubled for those who are poor, those with near poor/low family incomes, and those with high family incomes.
Introduction
Asthma is a chronic, complex health condition requiring considerable medical care and medication. Although increases in the prevalence of childhood asthma in the U.S. have slowed since the mid-1990s1, health care costs and prescription drug expenditures associated with asthma treatment have increased significantly in recent years.This Statistical Brief compares estimates of health expenditures for children with reported treatment for asthma in 1997–1998 and 2007–2008 using data from the Household Component of the Medical Expenditure Panel Survey (MEPS-HC). The estimates are based on a sample of children younger than 18 years of age with reported treatment associated with asthma (ICD-9-CM code 493) during the year. Results are provided on treated prevalence of asthma among children and by age category. Results are also provided on total health care and prescription drug expenditures for children treated for asthma and children without treatment for asthma. Finally, among children treated for asthma, results are provided on total health care and prescription drugs expenditures by race/ethnicity and income. Expenditures for all pooled years are expressed in constant dollars by inflating them to 2008 U.S. dollars using the Consumer Price Index for All Urban Consumers (CPI-U). All differences between estimates discussed in the text are statistically significant at the 0.05 level or better.
Findings
The average annual proportion of children reporting treatment for asthma in the U.S. increased slightly from 4.7 percent in 1997–1998 to 6.1 percent in 2007–2008. In particular, there were increases in the proportion of children ages 5–11 and ages 12–17, with reported treatment for asthma over the period. There were no significant changes in the treated prevalence of asthma for children ages 0–4 over the period. Children ages 5–11 were more likely to be treated for asthma than children ages 12–17 in both 1997–1998 (5.2 versus 4.0 percent) and 2007–2008 (7.5 versus 5.7 percent) (figure 1).Although expenditures in both time periods were higher for children with reported treatment for asthma compared to those without treatment for asthma, the average annual total health care and total prescription drug expenditures increased at similar rates for these two groups of children between 1997–1998 and 2007–2008. In particular, the average annual total health care expenditures for children with reported treatment for asthma increased from $1,827 in 1997–1998 to $2,503 in 2007–2008. At the same time, the average annual total health care expenditures for children without asthma treatment increased from $1,160 to $1,762. Average annual prescription drug expenditures more than doubled from $349 in 1997–1998 to $838 in 2007–2008 for children with asthma treatment and from $87 to $192 for children without treatment for asthma. Also, prescription drug expenditures as a share of total health care expenditures were significantly lower for children without asthma treatment in both periods compared to those for children with asthma treatment. For example, in 2007–2008, prescription drugs accounted for about one-third of total expenditures for children treated for asthma but only 11 percent of the total for children without treatment for asthma (figure 2).
The average annual prescription drug expenditures for Hispanics nearly doubled from $312 in 1997–1998 to $620 in 2007–2008. Over the same period, average annual prescription drug expenditures more than doubled for non-Hispanic whites/other ($383 to $976) and non-Hispanic blacks ($279 to $586). The average annual prescription drug expenditures for non-Hispanic whites/other in 2007–2008 were about 1.6 times higher than those for non-Hispanic blacks and Hispanics (figure 4).
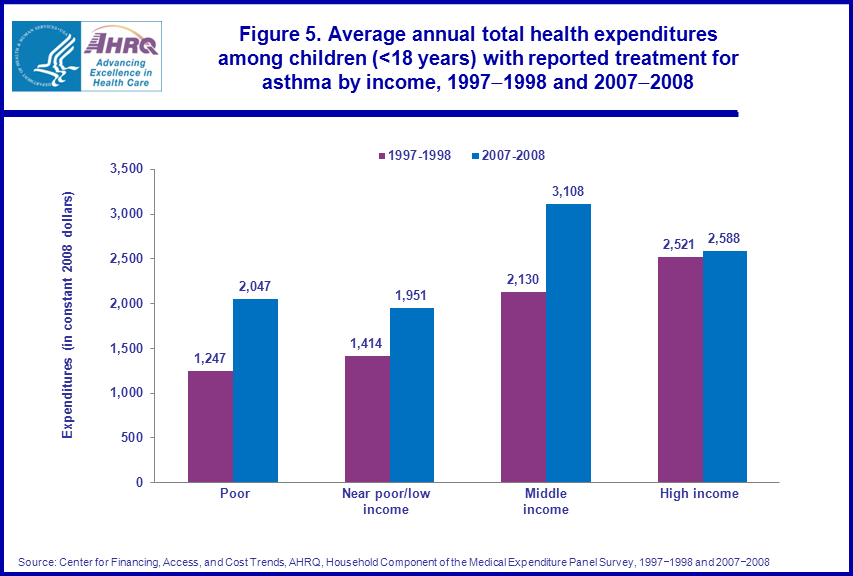
Among children with reported treatment for asthma in 1997–1998 and 2007–2008, average annual total health care expenditures increased significantly for those in the poor income category and those with near poor/low family incomes. The changes in average annual total health care expenditures for those with high and middle family incomes were not statistically significant. In both 1997–1998 and 2007–2008, average annual total health care expenditures were higher for those with high ($2,521 and $2,588) and middle ($2,130 and $3,108) family incomes than for those who were poor ($1,247 and $2,047) or those with near poor/low ($1,414 and $1,951) family incomes (figure 5).
The average annual prescription drug expenditures nearly doubled for those with middle family incomes and more than doubled for those classified as poor, those with near poor/low family incomes, and those with high family incomes from 1997–1998 to 2007–2008. Average annual prescription drug expenditures were higher for those with middle ($432) family incomes than for those who were poor ($242) in 1997–1998. Also, average annual prescription drugs expenditures were higher for those with high ($1,105) family incomes than for those classified as poor ($651), and those with near poor/low ($709) and middle ($791) family incomes in 2007–2008 (figure 6).
Data Source
The estimates presented in this Statistical Brief were derived from the MEPS Full Year Consolidated Data Files and MEPS Conditions Files for 1997, 1998, 2007, and 2008.Definitions
Treated prevalence for asthmaChildren with treatment for asthma were identified using the three-digit ICD-9-CM diagnosis condition variable (ICD9CODX = “493”) on the 1997–1998 and 2007–2008 MEPS Medical Conditions Files to construct an asthma indicator variable. The Conditions files contain coded information on conditions reported by MEPS respondents as being associated with medical events, disability days, and/or were bothersome during the year. Children with reported treatment for asthma within the sample were identified by tying the asthma diagnosis to any reported health services utilization (i.e., home health, inpatient hospital stays, outpatient, office-based, emergency room visits, and prescription drugs) during the year.
Expenditures
Total medical expenditures include the total direct payments from all sources to hospitals, physicians, other health care providers (including dental care and home health care), pharmacies, and other medical services and/or equipment for services reported in the MEPS-HC. MEPS expenditures are defined as the sum of direct payments received, including out-of-pocket payments for care received and payments made by private insurance, Medicare, Medicaid, and other sources. Payments for over-the-counter drugs and alternative care services are not included in MEPS total expenditures. Indirect payments not related to specific medical events, such as Medicaid Disproportionate Share and Medicare Direct Medical Education subsidies, are also not included. Expenditures for each year were adjusted using the Consumer Price Index (CPI) and all estimates in this report are reported in 2008 dollars.
Race/ethnicity
Classification by race and ethnicity was based on information provided by the household respondent for each household member. From 1997 to 2001, the respondent was asked if each person’s race was best described as black, white, Asian or Pacific Islander, American Indian, or Alaska Native. Beginning in 2002, the respondent was able to describe each person’s race by specifying any combination of races that applied (i.e., multiracial). In all years, respondents were asked if each person’s main national origin or ancestry was Puerto Rican, Cuban, Mexican, Mexicano, Mexican American, or Chicano; other Latin American; or other Spanish. Persons claiming a main national origin or ancestry in one of these Hispanic groups, regardless of racial background, were classified as Hispanic. Since the Hispanic grouping can include persons of any race, the race categories of black, white, and other exclude Hispanics. The other category includes people with single races other than white and black as well as people who report multiple races. The white and other categories were collapsed into a single category “white/other”.
Income
In MEPS, personal income from all household members is summed to create family income. Potential sources of income include annual earnings from wages, salaries, bonuses, tips, and commissions; business and farm gains and losses; unemployment and Workers’ Compensation payments; interest and dividends; alimony, child support, and other private cash transfers; private pensions; individual retirement account (IRA) withdrawals; Social Security and Department of Veterans Affairs payments; Supplemental Security Income and cash welfare payments from public assistance, TANF (Temporary Assistance for Needy Families; formerly known as Aid to Families with Dependent Children, or AFDC); gains or losses from estates, trusts, partnerships, S corporations, rent, and royalties; and a small amount of “other” income. Individuals were classified according to their family’s income in terms of poverty status. Poverty status is the ratio of the family’s income to the Federal poverty thresholds, which control for the size of the family and the age of the head of the family. The following classification of poverty status was used:
- Poor: Persons in families with income of 100 percent of the poverty line or less, including those who reported negative income.
- Near poor/low income: Persons in families with income from over 100 percent through 200 percent of the poverty line.
- Middle income: Persons in families with income from over 200 percent through 400 percent of the poverty line.
- High income: Persons in families with income over 400 percent of the poverty line.
About MEPS-HC
MEPS-HC is a nationally representative longitudinal survey that collects detailed information on health care utilization and expenditures, health insurance, and health status, as well as a wide variety of social, demographic, and economic characteristics for the U.S. civilian noninstitutionalized population. It is cosponsored by the Agency for Healthcare Research and Quality and the National Center for Health Statistics.For more information about MEPS, call the MEPS information coordinator at AHRQ (301-427-1656) or visit the MEPS Web site at http://www.meps.ahrq.gov/.
References
For a detailed description of the MEPS survey design, sample design, and methods used to minimize sources of nonsampling error, see the following publications:Cohen, J. Design and Methods of the Medical Expenditure Panel Survey Household Component. MEPS Methodology Report No. 1. AHCPR Pub. No. 97-0026. Rockville, MD: Agency for Health Care Policy and Research, 1997. http://www.meps.ahrq.gov/mepsweb/data_files/publications/mr1/mr1.shtml
Cohen, S. Sample Design of the 1996 Medical Expenditure Panel Survey Household Component. MEPS Methodology Report No. 2. AHCPR Pub. No. 97-0027. Rockville, MD: Agency for Health Care Policy and Research, 1997. http://www.meps.ahrq.gov/mepsweb/data_files/publications/mr2/mr2.shtml
Cohen, S. Design Strategies and Innovations in the Medical Expenditure Panel Survey. Medical Care, July 2003: 41(7) Supplement: III-5–III-12.
Suggested Citation
Sarpong, E.M. Health Care Expenditures among Children with Asthma, United States, 1997–1998 and 2007–2008. Statistical Brief #332. July 2011. Agency for Healthcare Research and Quality, Rockville, MD. http://www.meps.ahrq.gov/mepsweb/data_files/publications/st332/stat332.shtmlAHRQ welcomes questions and comments from readers of this publication who are interested in obtaining more information about access, cost, use, financing, and quality of health care in the United States. We also invite you to tell us how you are using this Statistical Brief and other MEPS data and tools and to share suggestions on how MEPS products might be enhanced to further meet your needs. Please e-mail us at MEPSProjectDirector@ahrq.hhs.gov or send a letter to the address below:
Steven B. Cohen, PhD, Director
Center for Financing, Access, and Cost Trends
Agency for Healthcare Research and Quality
540 Gaither Road
Rockville, MD 20850
1 Akinbami L. J. (2006). The State of Childhood Asthma, United States, 1980–2005. Advance data from vital and health statistics; no 381, Hyattsville, MD: National Center for Health Statistics.
 |
||||||||||||||||||||||||||||||
|
||||||||||||||||||||||||||||||
|
|
||||||||||||||||||||||||||||||
 |
||||||||||||||||||||||||||||||
|
||||||||||||||||||||||||||||||
|
|
||||||||||||||||||||||||||||||
 |
||||||||||||||||||||||||||||||
|
||||||||||||||||||||||||||||||
|
|
||||||||||||||||||||||||||||||
 |
||||||||||||||||||||||||||||||
|
||||||||||||||||||||||||||||||
|
|
||||||||||||||||||||||||||||||
 |
||||||||||||||||||||||||||||||
|
||||||||||||||||||||||||||||||
|
|
||||||||||||||||||||||||||||||
 |
||||||||||||||||||||||||||||||
|
||||||||||||||||||||||||||||||
|
|
||||||||||||||||||||||||||||||


