
|
|
Font Size:
|
||||
|
|
|
|
||||
STATISTICAL BRIEF #366:
Changes in Premiums for Civilian Employees: Employer-Sponsored Health Insurance, by Census Division, 2010 versus 2008
Highlights
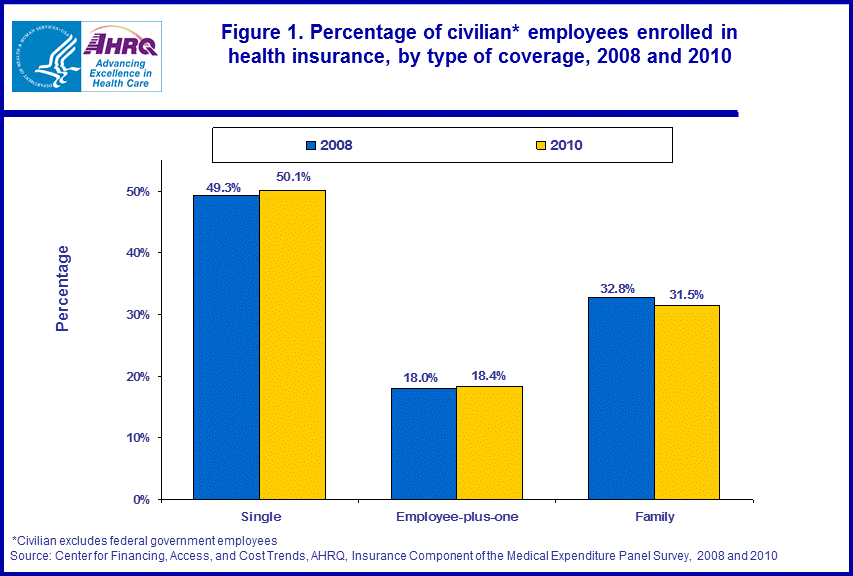
- Among civilian employees with employer sponsored health insurance in 2010, 50.1 percent had a single coverage health insurance plan, 18.4 percent had employee-plus-one coverage, and 31.5 percent had family coverage.
- The percentage of civilian enrollees in 2010 with single coverage increased slightly by 0.8 percentage points, and the percentage of enrollees with family coverage decreased slightly by 1.3 percentage points over 2008.
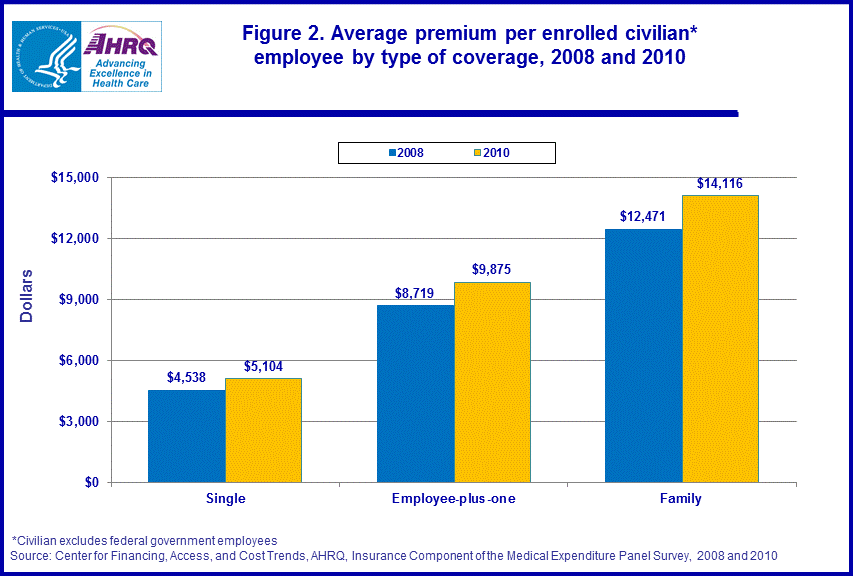
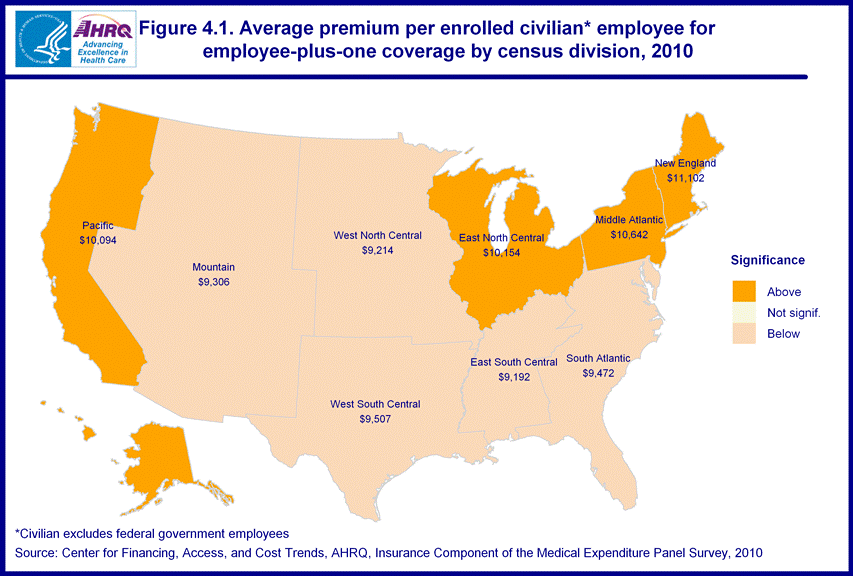
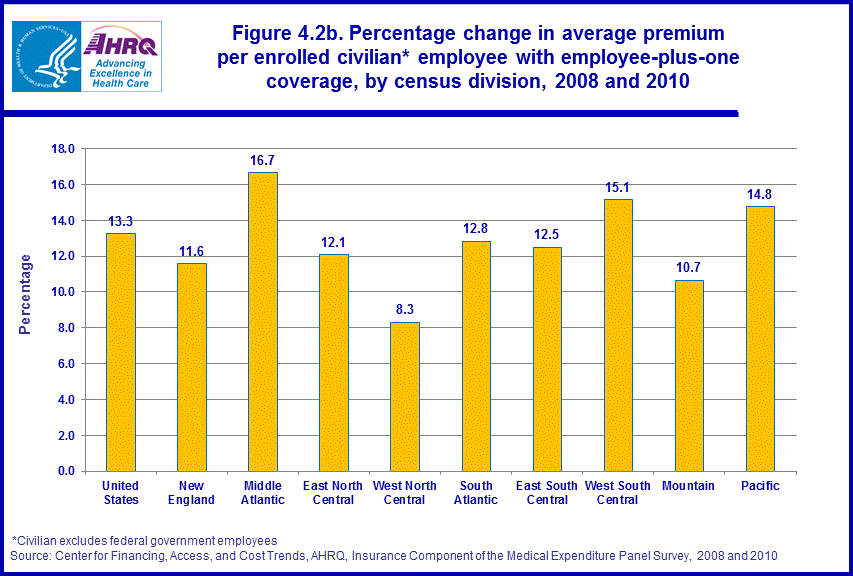
- Average premiums for civilian employees in 2010 were $5,104 for single coverage, $9,875 for employee-plus-one coverage, and $14,116 for family coverage. Premiums in 2010 were about 13 percent higher than 2008 regardless of type of coverage.
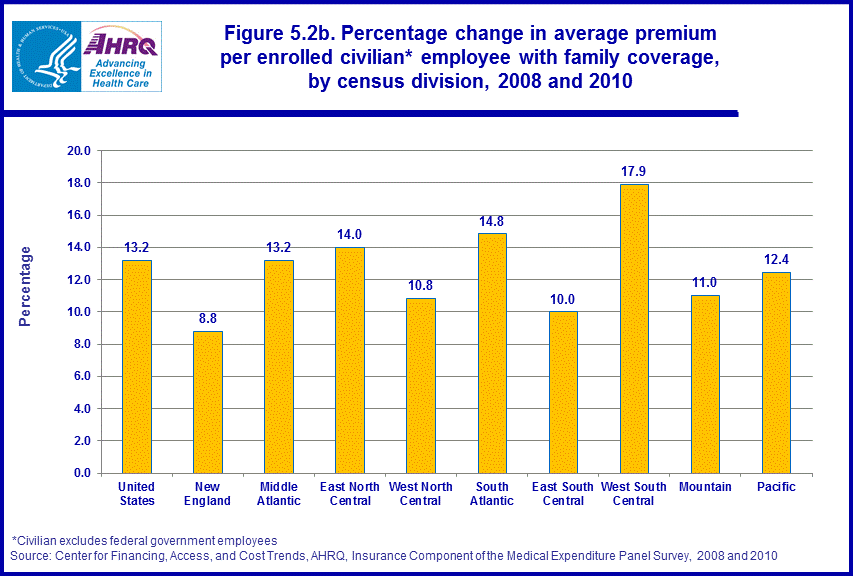
- During 2008 to 2010, the percentage change in family premiums for the New England division (8.8 percent) was significantly lower than average.
Introduction
Employer-sponsored health insurance for current workers is one of the primary sources of health insurance coverage in the United States. According to data from the Insurance Component of the 2010 Medical Expenditure Panel Survey (MEPS-IC), approximately 113.2 million of the 128.0 million civilian employees (including private and state and local, but not federal employees) worked where the employer offered health insurance. Of those employees who worked where health insurance was offered, approximately 69.1 million were enrolled.Beginning in September 2011, the Rate Review program established under the Patient Protection and Affordable Care Act requires health insurers to justify premium rate increases of 10 percent or more before the increase can take effect. This Statistical Brief presents MEPS-IC estimates by type of coverage (single, employee-plus-one, and family) on average premiums for 2010 and changes relative to 2008 (the height of the economic downturn). Estimates are also presented by census geographic division for employees who enrolled in offered health insurance plans. A companion Brief, Statistical Brief #365, also describes recent changes in average premiums by census division but provides estimates separately for the public and private sectors. Only those estimates that had a statistically significant difference from the national average at the 0.05 percent significance level are noted in the text.
Findings
Among the 128.0 million civilian employees who worked for private and public sector employers in 2010, 88.4 percent worked where the employer offered health insurance (estimate not shown in figures) and 69.1 million enrolled. Among those enrolled in 2010, 50.1 percent had single coverage, 18.4 percent had employee-plus-one coverage, and 31.5 percent had family coverage (figure 1). The percent of enrollees that enrolled in single coverage increased slightly by 0.8 percentage points, and decreased slightly for family coverage by 1.3 percentage points over 2008. There was no significant difference in enrollment for employee-plus-one coverage in 2010 versus 2008.In the U.S. as a whole, civilian employees had average premiums in 2010 of $5,104 for single coverage, $9,875 for employee-plus-one coverage, and $14,116 for family coverage (figure 2). Each of these averages was approximately 13 percent higher than in 2008, which exceeds the 1.3 percent rise between 2008 and 2010 in overall consumer prices for urban consumers (i.e., CPI index).
Single, employee-plus-one, and family coverage variations by census geographic division
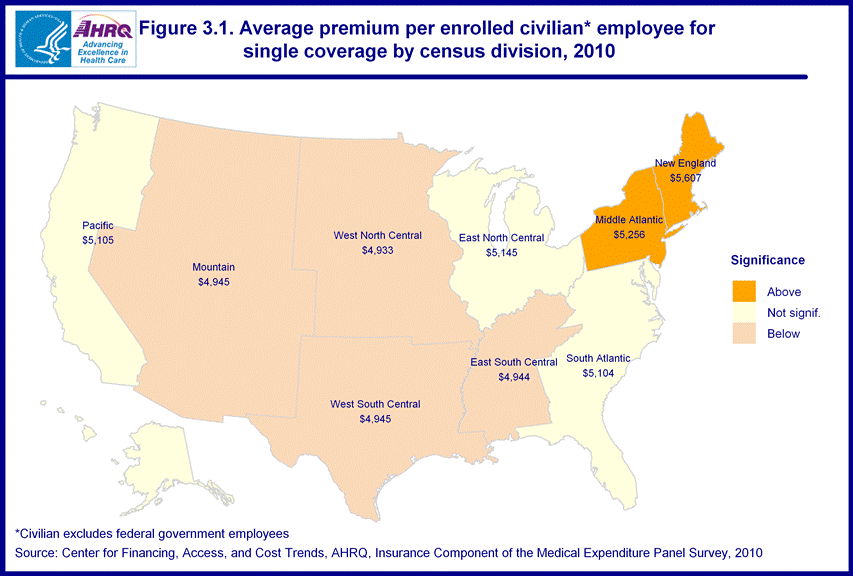
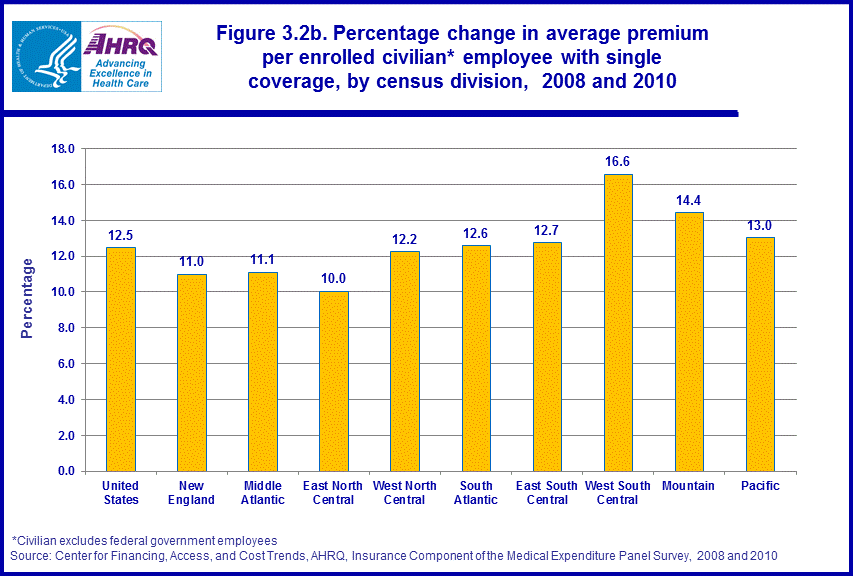
In 2010, the New England and Middle Atlantic geographic divisions had single premiums significantly higher than the national average at $5,607 and $5,256, respectively (figure 3.1). The West North Central, East South Central, West South Central, and Mountain areas had below national average single premiums of $4,933, $4,944, $4,945 and $4,945, respectively. During 2008 to 2010, the overall change in average annual health insurance premiums per enrolled civilian employee with single coverage was 12.5 percent (figure 3.2b). This percent change did not vary significantly by census division.
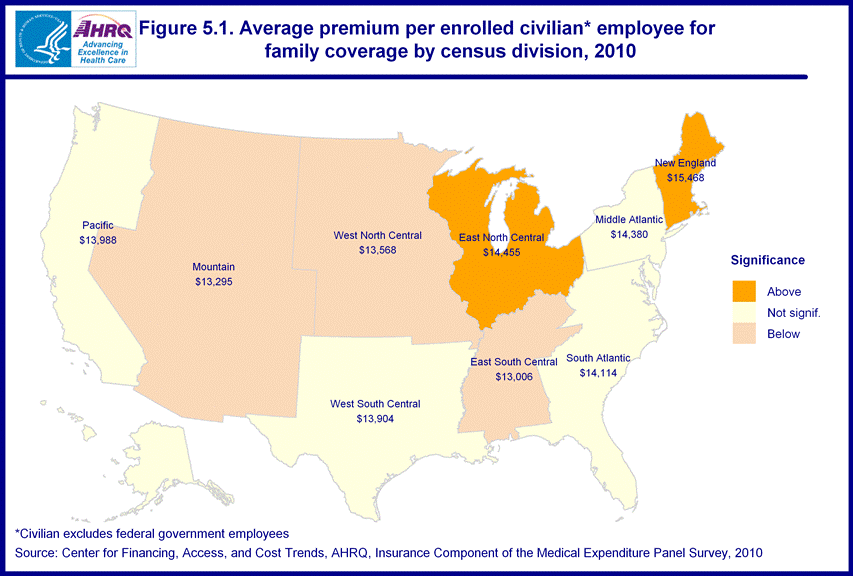
In 2010, the New England and East North Central geographic divisions had family premiums significantly higher than the U.S. average at $15,468 and $14,455, respectively (figure 5.1). East South Central, Mountain, and West North Central areas had below average family premiums at $13,006, $13,295, and $13,568, respectively. During 2008 to 2010, the change in average annual health insurance premiums per enrolled civilian employee with family coverage was 13.2 percent (figure 5.2b). The percent change in family premiums for the New England division (8.8 percent) was significantly lower than average during this period.
Data Source
This Statistical Brief summarizes data from the 2008 and 2010 MEPS-IC. The data are available on the MEPS Web site at http://www.meps.ahrq.gov/mepsweb/survey_comp/Insurance.jsp or have been produced using special computation runs on the confidential MEPS-IC data available at the U.S. Census Bureau.Definitions
States were grouped into nine census divisions as follows:- New England: Connecticut, Maine, Massachusetts, New Hampshire, Rhode Island, Vermont
- Middle Atlantic: New Jersey, New York, Pennsylvania
- East North Central: Illinois, Indiana, Michigan, Ohio, Wisconsin
- West North Central: Iowa, Kansas, Minnesota, Missouri, Nebraska, North Dakota, South Dakota
- South Atlantic: Delaware, District of Columbia, Florida, Georgia, Maryland, North Carolina, South Carolina, Virginia, West Virginia
- East South Central: Alabama, Kentucky, Mississippi, Tennessee
- West South Central: Arkansas, Louisiana, Oklahoma, Texas
- Mountain: Arizona, Colorado, Idaho, Montana, Nevada, New Mexico, Utah, Wyoming
- Pacific: Alaska, California, Hawaii, Oregon, Washington
Civilian employees include those employed in the private sector and in the public (state/local government) sector. Federal government employees, postal workers, military, and unincorporated self-employed individuals with no employees are not included.
Employee-plus-one coverage
Health insurance that covers the employee and one other family member at a lower premium level than family coverage. For the MEPS-IC survey, if premiums are different for employee-plus-spouse and employee-plus-child coverage, the costs for employee-plus-child coverage are collected.
Family coverage
Health insurance that covers the employee and one or more members of his/her immediate family (spouse and/or children as defined by the plan). For the MEPS-IC survey, “family coverage” is any coverage other than single and employee-plus-one. Some plans offer more than one rate for family coverage, depending on family size and composition. If more than one rate is offered, survey respondents are asked to report costs for a family of four.
Premium
Agreed upon fees paid for coverage of medical benefits for a defined benefit period. Premiums can be paid by employers, unions, employees, or split between the insured individual and the plan sponsor.
Single coverage
Health insurance that covers the employee only. This is also known as employee-only coverage.
About MEPS-IC
The MEPS-IC is a survey of business establishments and governments that collects information on employer-sponsored health insurance, such as whether insurance is offered, enrollments, types of plans, and premiums. The survey is conducted annually by the U.S. Census Bureau under the sponsorship of the Agency for Healthcare Research and Quality (AHRQ). A total sample of approximately 42,000 private sector establishments was selected for the 2010 survey; with 8.3 percent of the sample determined to be out-of-scope during the data collection process. The response rate for the private-sector was 82.7 percent of the remaining in-scope sample units. For state and local governments, a sample of approximately 3,100 governmental units was selected with a response rate of 93.4 percent.For more information on this survey, see MEPS Methodology Reports 6, 8, 10, 14, 17, and 18 and the MEPS-IC Technical Notes and Survey Documentation, which are available on the MEPS Web site (http://www.meps.ahrq.gov).
References
U.S. Department of Health and Human Services. Key Features of the Law: Insurance Costs. Available at: http://www.healthcare.gov/law/features/costs/rate-review/index.html.Suggested Citation
Davis, K. Changes in Premiums for Civilian Employees: Employer-Sponsored Health Insurance, by Census Division, 2010 versus 2008. Statistical Brief #366. March 2012. Agency for Healthcare Research and Quality, Rockville, MD. http://www.meps.ahrq.gov/mepsweb/data_files/publications/st366/stat366.shtmlThe author wishes to thank Fred Rohde for assistance with graphical content.
AHRQ welcomes questions and comments from readers of this publication who are interested in obtaining more information about access, cost, use, financing, and quality of health care in the United States. We also invite you to tell us how you are using this Statistical Brief and other MEPS data and tools and to share suggestions on how MEPS products might be enhanced to further meet your needs. Please e-mail us at MEPSProjectDirector@ahrq.hhs.gov or send a letter to the address below:
Steve B. Cohen, PhD, Director
Center for Financing, Access, and Cost Trends
Agency for Healthcare Research and Quality
540 Gaither Road
Rockville, MD 20850
 |
||||||||||||||||||||||||||
|
||||||||||||||||||||||||||
|
|
||||||||||||||||||||||||||
 |
||||||||||||||||||||||||||
|
||||||||||||||||||||||||||
|
|
||||||||||||||||||||||||||
 |
||||||||||||||||||||||||||
|
||||||||||||||||||||||||||
|
|
||||||||||||||||||||||||||
 |
||||||||||||||||||||||||||
|
||||||||||||||||||||||||||
|
|
||||||||||||||||||||||||||
 |
||||||||||||||||||||||||||
|
||||||||||||||||||||||||||
|
|
||||||||||||||||||||||||||
 |
||||||||||||||||||||||||||
|
||||||||||||||||||||||||||
|
|
||||||||||||||||||||||||||
 |
||||||||||||||||||||||||||
|
||||||||||||||||||||||||||
|
|
||||||||||||||||||||||||||
 |
||||||||||||||||||||||||||
|
||||||||||||||||||||||||||
|
|
||||||||||||||||||||||||||


