|
|
Font Size:
|
||||
|
|
|
|
||||
STATISTICAL BRIEF #40:
Health Insurance Coverage and Income Levels for the U.S. Noninstitutionalized Population under Age 65, 2001
Highlights
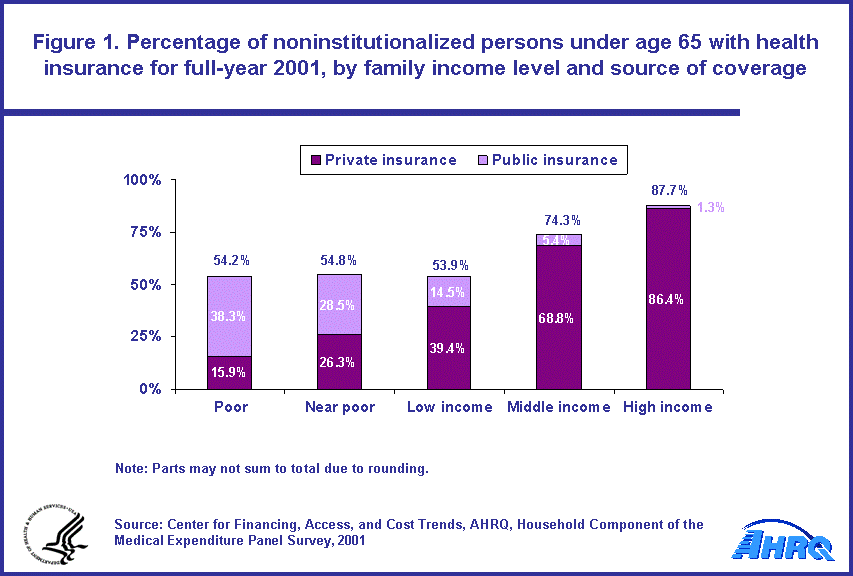
- Persons under age 65 living in middle and high income families were much more likely to have continuous health insurance throughout 2001 than those in lower income households. Slightly more than half of persons in the poor, near poor, and low income groups had health insurance for the full year versus 87.7 percent of those in the high income group and 74.3 percent of those in the middle income group.
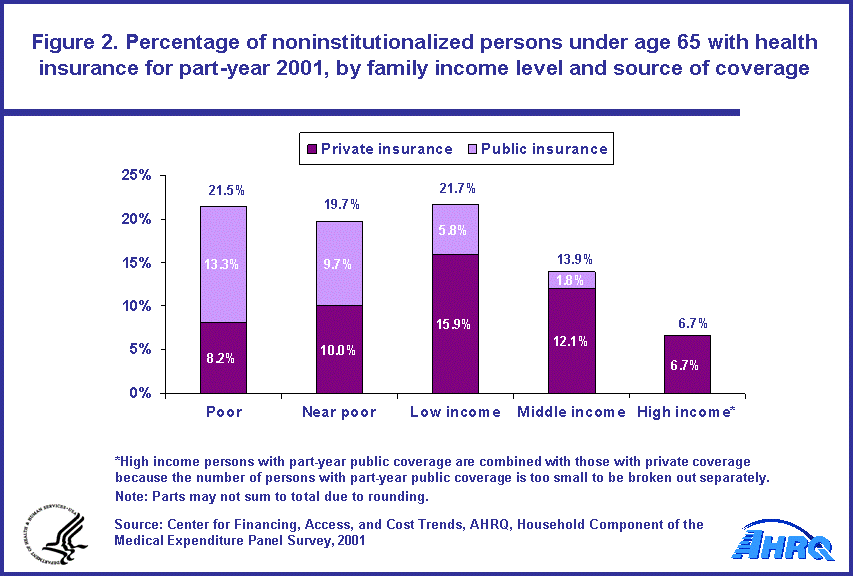
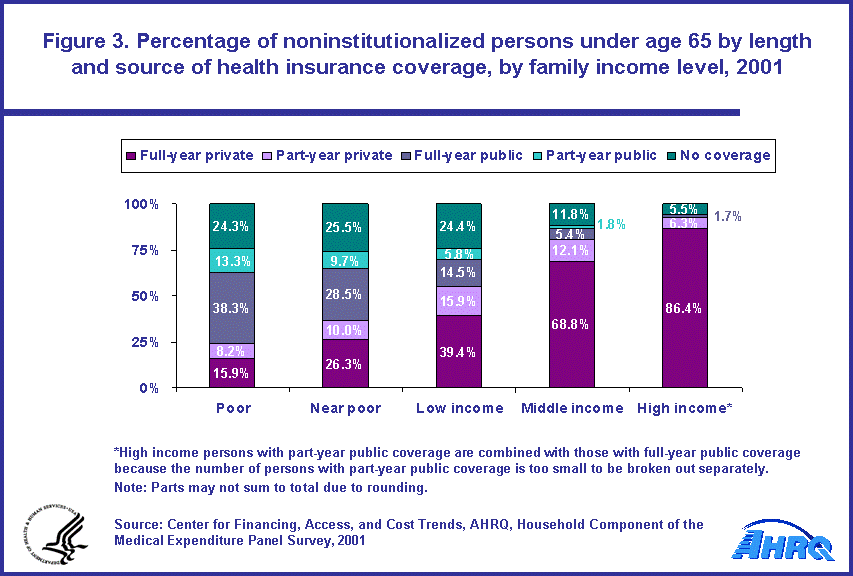
- Approximately one-fourth of persons in poor, near poor, or low income families were not covered by health insurance at any time during the year. About 20 percent of individuals in these lowest three income levels had coverage for part of 2001, but not the entire year.
- The higher the family income level, the more likely it was that a person's insurance came from a private, rather than a public, source.
Introduction
In 2001, persons under age 65 who lived in middle or high income families were much more likely to have health insurance coverage for the entire year than those in lower income households. In addition, the larger a person's family income, the more likely coverage was to come from private, rather than public, insurance.
This Statistical Brief discusses differences in the sources and duration of health insurance coverage by family income level for persons under age 65 in the noninstitutionalized population included in the Household Component of the Medical Expenditure Panel Survey (MEPS-HC) in 2001. MEPS-HC obtains information on both private and public health insurance coverage. The survey also collects family income data that are compared to poverty-level thresholds, which vary by family size and composition, in order to determine family poverty status: poor, near poor, low income, middle income, or high income. All differences between estimates discussed in the text are statistically significant at the 0.05 level.
Findings
Slightly more than half of persons under age 65 in the lowest three income groups had health insurance for the full-year 2001--54.2 percent of the poor, 54.8 percent of the near poor, and 53.9 percent of low income persons (figure 1). In contrast, middle income persons were much more likely to have full-year coverage (74.3 percent). An even higher proportion (87.7 percent) of high income persons were covered for the full year.
Roughly one in five persons in the lowest three income categories had health insurance coverage for part, but not all, of 2001 (figure 2). Part-year coverage was much less common in the middle (13.9 percent) and high (6.7 percent) income groups.
Only 5.5 percent of high income persons and 11.8 percent of middle income persons under age 65 did not have any health insurance during 2001 (figure 3). In contrast, about one-fourth of those in the lowest three income groups lacked coverage throughout the year. There was little variation between the three groups, with low income persons at 24.4 percent, the near poor at 25.5 percent, and the poor at 24.3 percent.
Despite the similarity in overall full-year coverage rates within the lowest income groups, the degree to which that full-year coverage came from private versus public sources varied substantially. While only 15.9 percent of persons in poor families had private health insurance for all of 2001, that number rose to 26.3 percent for the near poor and 39.4 percent for low income persons. In contrast, 68.8 percent of middle income persons and 86.4 percent of high income persons had private coverage.
Persons in poor families with part-year coverage were more likely to have public than private insurance. The opposite was true for persons in other income groups.
Data Source
This Statistical Brief summarizes data on health insurance coverage for different income groups, as defined by poverty levels, for the U.S. civilian noninstitutionalized population in year 2001, as derived from the MEPS-HC 2001 Full-Year Consolidated File (HC-060).
Definitions
The target population for this analysis consists of the U.S. civilian noninstitutionalized population who were community residents for all of 2001 and who were under age 65 on December 31, 2001.
Family
Both family and one-person households are referred to as families in this analysis. See detailed definitions used by the U.S. Bureau of the Census at http://www.census.gov/population/www/cps/cpsdef.html.
Health insurance
Public Coverage: Persons were considered to have public health insurance coverage if they were covered by Medicare, Medicaid or the State Children's Health Insurance Program, TRICARE, or other public hospital and physician coverage.
Private Coverage: Private health insurance coverage was defined for this report as insurance that provides coverage for hospital and physician care (including Medigap coverage). Private health insurance could have been obtained through an employer, union, self-employed business, directly from an insurance company or health maintenance organization (HMO), or through a group or association.
Duration
The coverage period is defined as the full calendar year (12 months), part of the calendar year (one to 11 months), or not at all during the year (zero months).
Overall, 4.2 percent of persons in the population had some combination of private and public coverage in 2001. In order to make the public and private designations mutually exclusive, for purposes of this analysis each of these persons was identified as having one or the other type of coverage for the year, as follows: Persons with continuous full-year public plus part-year private coverage were classified as having full-year public insurance; all other persons with a combination of private and public insurance were classified based on their private coverage status for the year. Those in the low income group were more likely to have a combination of coverage (8.3 percent) during the year than those in the other income groups.
Income
Family income includes annual earnings from wages, salaries, bonuses, tips, commissions; business and farm gains and losses; unemployment and workers' compensation; interest and dividends; alimony, child support, and other private cash transfers; private pensions, IRA withdrawals, social security, and veterans' payments; supplemental security income and cash welfare payments from public assistance, Temporary Assistance for Needy Families, and related programs; gains or losses from estates, trusts, partnerships, S corporations, rent, and royalties; and "other" income. Family income excludes tax refunds and capital gains.
Poverty-level categories, based on thresholds developed by the U.S. Bureau of the Census
- If family income is less than 100 percent of the poverty-level income, persons in the family are considered to be "poor." (12.0 percent of persons under age 65 in MEPS)
- If family income is 100 percent or more but less than 125 percent of the poverty-level income, persons in the family are considered to be "near poor." (4.1 percent of persons under age 65 in MEPS)
- If family income is 125 percent or more but less than 200 percent of the poverty-level income, persons in the family are considered to be "low income." (12.9 percent of persons under age 65 in MEPS)
- If family income is 200 percent or more but less than 400 percent of the poverty-level income, persons in the family are considered to be "middle income." (31.6 percent of persons under age 65 in MEPS)
- If family income is 400 percent or more of the poverty-level income, persons in the family are considered to be "high income." (39.4 percent of persons under age 65 in MEPS)
About MEPS-HC
MEPS-HC is a nationally representative longitudinal survey that collects detailed information on health care utilization and expenditures, health insurance, and health status, as well as a wide variety of social, demographic, and economic characteristics for the civilian noninstitutionalized population. It is cosponsored by the Agency for Healthcare Research and Quality and the National Center for Health Statistics.
References
For a detailed description of the MEPS-HC survey design, sample design, and methods used to minimize sources on nonsampling error, see the following publications:
Cohen, J. Design and Methods of the Medical Expenditure Panel Survey Household Component. MEPS Methodology Report No. 1. AHCPR Pub. No. 97-0026. Rockville, Md.: Agency for Health Care Policy and Research, 1997.
Cohen, S. Sample Design of the 1996 Medical Expenditure Panel Survey Household Component. MEPS Methodology Report No. 2. AHCPR Pub. No. 97-0027. Rockville, Md.: Agency for Health Care Policy and Research, 1997.
These publications are available from the AHRQ Clearinghouse (1-800-358-9295) and on the MEPS Web site (http://www.meps.ahrq.gov).
Suggested Citation
Crimmel, B.L. Health Insurance Coverage and Income Levels for the U.S. Noninstitutionalized Population under Age 65, 2001. Statistical Brief #40. May 2004. Agency for Healthcare Research and Quality, Rockville, MD. http://www.meps.ahrq.gov/mepsweb/data_files/publications/st40/stat40.shtml
 |
||||||||||||||||||||||||||||||||||||||||||||||||
|
||||||||||||||||||||||||||||||||||||||||||||||||
|
|
||||||||||||||||||||||||||||||||||||||||||||||||
 |
||||||||||||||||||||||||||||||||||||||||||||||||
|
||||||||||||||||||||||||||||||||||||||||||||||||
|
|
||||||||||||||||||||||||||||||||||||||||||||||||
 |
||||||||||||||||||||||||||||||||||||||||||||||||
|
||||||||||||||||||||||||||||||||||||||||||||||||
|
|
||||||||||||||||||||||||||||||||||||||||||||||||


