
|
|
Font Size:
|
||||
|
|
|
|
||||
STATISTICAL BRIEF #406:
Access and Experiences Regarding Health Care: Estimates for the U.S. Civilian Noninstitutionalized Population Age 18 and Older, 2010
Highlights
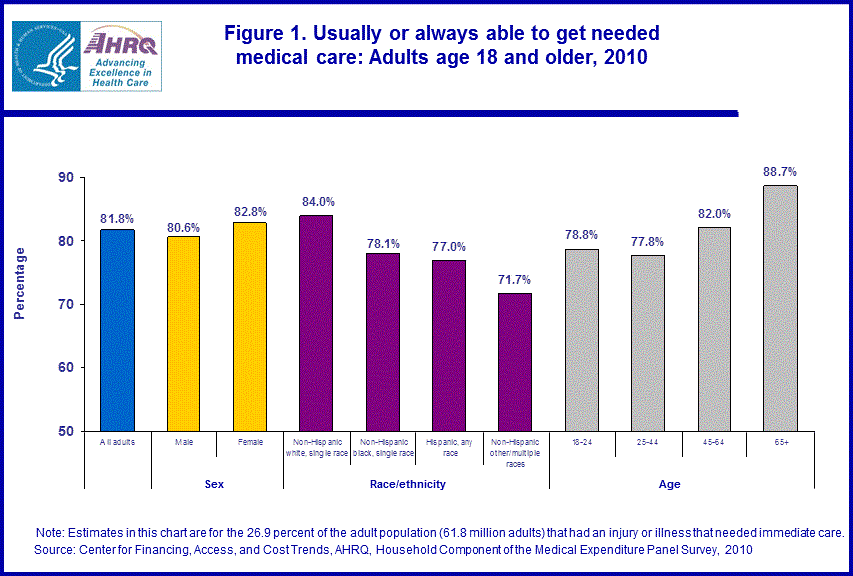
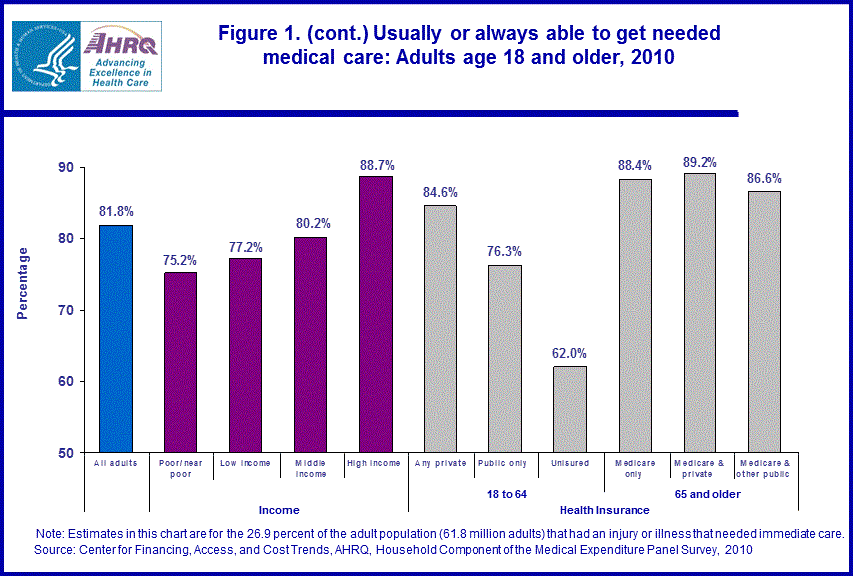
- Based on comparisons by race and ethnicity, white non-Hispanics were the most likely (84.0 percent) while non-Hispanic other/multiple races were the least likely (71.7 percent) to report usually or always able to get needed medical care.
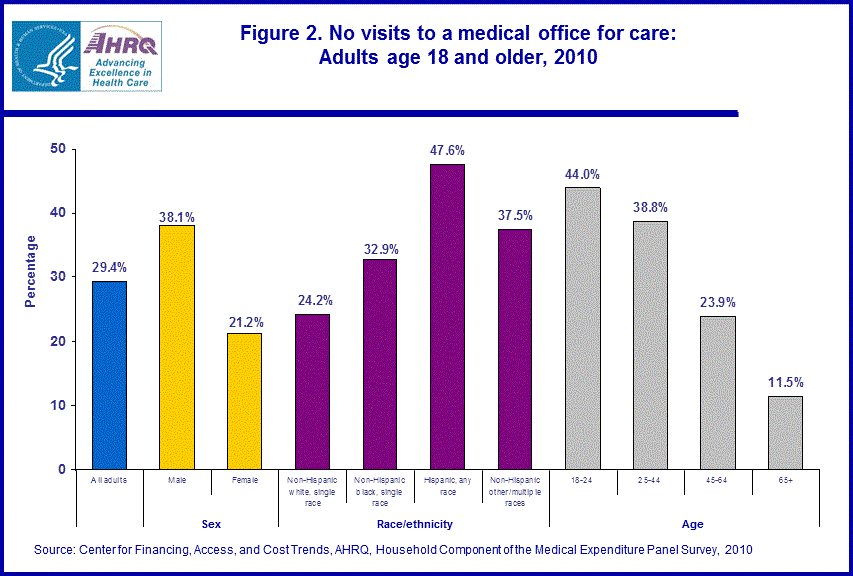
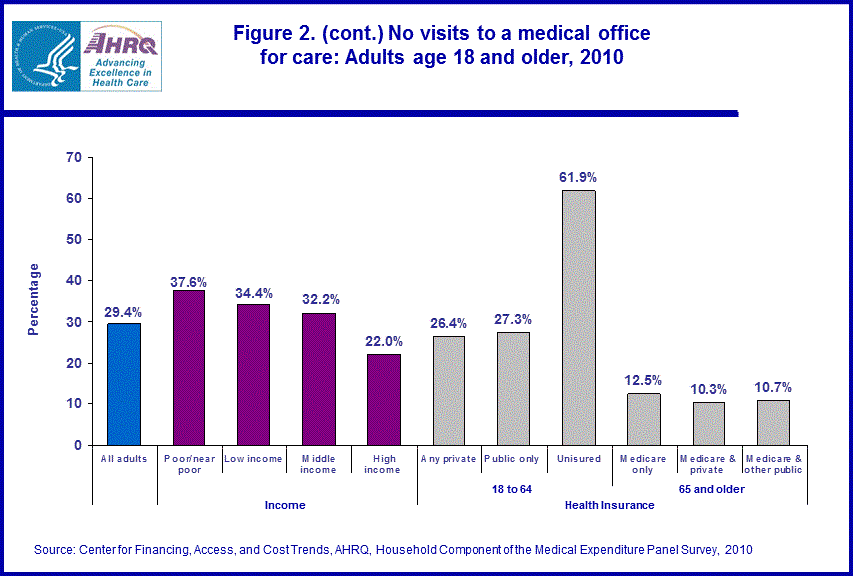
- Individuals, ages 18 to 64, that were uninsured were the most likely to report (61.9 percent) no medical office or clinic visits during the past 12 months relative to their uninsured counterparts.
- Individuals in a family that was poor or near poor were least likely (84.8 percent) while those in a family with a high income were most likely (93.9 percent) to report usually or always that doctors or other health providers explained things in a way that was easily understood.
- Those age 65 and older, compared to all other adult age groups, were least likely (6.9 percent) to report dissatisfaction with health care received.
Introduction
Access to and the quality of the health care received by Americans is an issue of public policy concern because the level of quality of health care impacts the capacity to deliver timely, accessible, and efficient medical care to the population in need of services. Estimates of quality are important in evaluating the costs and outcomes of health care delivery and to help identify potential areas where improvements can be made.A self-administered questionnaire (SAQ) is distributed to all adults age 18 and older within the Household Component of Medical Expenditure Panel Survey (MEPS-HC) to collect information on health care utilization, access, health status, and the quality of health care received. The quality of care measures in the SAQ are the same as those based on questions in another AHRQ-sponsored instrument, the Consumer Assessments of Health Plans (CAHPS®) which refer to events experienced in the last 12 months. This Statistical Brief presents findings based on the data obtained from the SAQ that was administered in the fall of 2010. All comparisons discussed in the text are statistically significant at the 0.05 level unless otherwise noted.
Findings
In 2010, among the 230 million adults in the U.S. civilian noninstitutionalized population, 26.9 percent had an injury or illness that needed immediate care and 81.8 percent of these were usually or always able to get medical care when they needed it. Also in 2010, 68.3 percent of all adults had at least one visit to a medical office for care and 90.5 percent of these felt that the doctor usually or always explained things so that they understood and 86.8 percent rated their health care 7 or higher on a 10 point scale (data not shown). The following sections describe variations in the percentage of adults able to get needed care and their experience with this care by selected characteristics.Access to care
Among the 61.8 million adults that had an injury or illness that needed immediate care, the percentage reporting they usually or always were able to get needed medical care varied by race/ethnicity, age, income level, and health insurance status. White non-Hispanics were the most likely (84.0 percent) while non-Hispanic other/multiple races were the least likely (71.7 percent) to report usually or always able to get needed medical care for comparisons by race and ethnicity. Those age 65 and older were the most likely to report (88.7 percent) usually or always able to get needed medical care for comparisons by age. Individuals in a family with a high income were more likely to report (88.7 percent) usually or always able to get needed medical care than persons in other lower income categories. Individuals, ages 18 to 64, that were uninsured were the least likely (62.0 percent) while their counterparts with private health insurance were the most likely (84.6 percent) to report usually or always able to get needed medical care (figure 1).
An estimated 67.5 million adults had no visits to a medical office or clinic for care during the past 12 months. The percentage of adults with no visits varied by a number of demographic characteristics: sex; race/ethnicity; age; income level; and health insurance status. Males were more likely (38.1 percent) than females (21.2 percent) to report no medical office or clinic visits during the past 12 months. Non-Hispanic whites were the least likely (24.2 percent) to report no medical office or clinic visits while Hispanics were the most likely (47.6 percent) not having a medical office or clinic visit for comparisons by race and ethnicity. Young adults (ages 18–24) were the most likely (44.0 percent) to report no medical office or clinic visits while the elderly (age 65 and older) were the least likely (11.5 percent) for comparisons by age. High income family members were less likely (22.0 percent) to report having no medical office or clinic visits during the past 12 months than those in lower income groups (32.2 percent to 37.6 percent). Individuals, ages 18 to 64, that were uninsured were more than twice as likely to report no medical office or clinic visits (61.9 percent) as those with public-only (27.3 percent) or private insurance (26.4 percent) (figure 2).
Experiences with health care
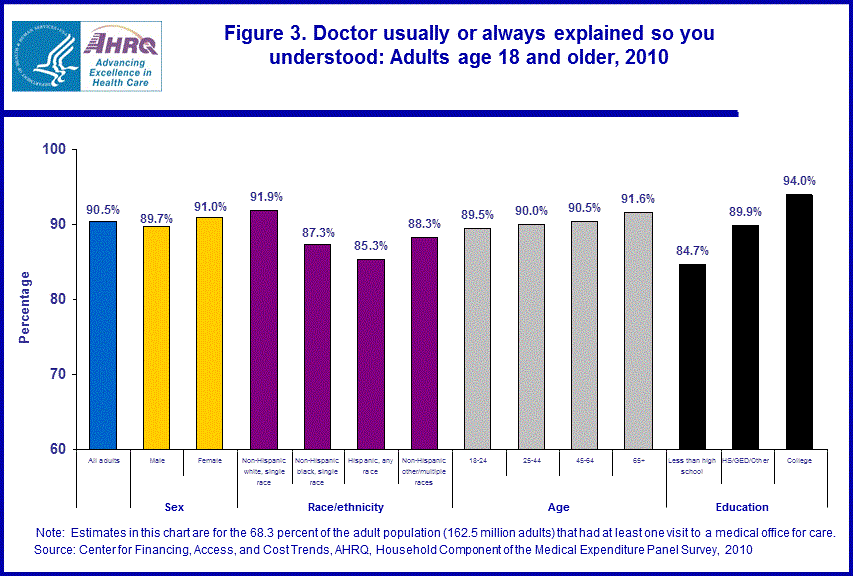
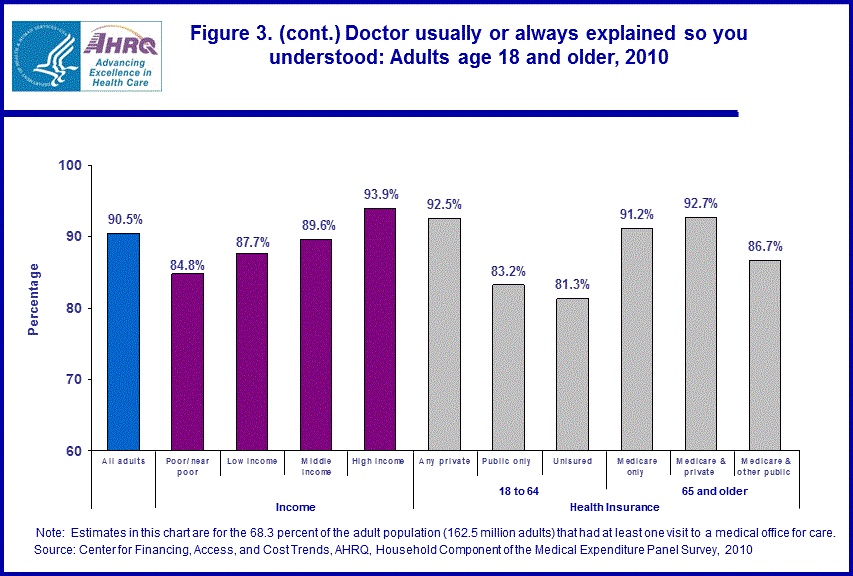
Among the 162.5 million adults with at least one visit to a medical office for care, those reporting that doctors or other health providers usually or always explained things in a way that was easy to understand varied by race/ethnicity, education, income level and health insurance status. Non-Hispanic whites were more likely (91.9 percent) than all other race/ethnic groups (85.3 percent to 88.3 percent) to report doctors or other health providers usually or always explained things in a way that was easy to understand. Education was positively associated with individuals reporting health providers usually or always explained things in a way that was easy to understand: less than high school (84.7 percent); high school graduate (89.9 percent); and college graduate (94.0 percent). Individuals in a family that was poor or near poor were the least likely (84.8 percent) while those in a family with a high income were the most likely (93.9 percent) to report usually or always that doctors or other health providers explained things in a way that was easily understood. Individuals, age 18 to 64, that had private health insurance were more likely to report doctors and other health providers explained things in a way that was easy to understand (92.5 percent) than those who had public-only insurance (83.2 percent) or were uninsured (81.3 percent). For the elderly (age 65 and older) those with Medicare and other public insurance were the least likely (86.7 percent) to report doctors and other health providers explained things in a way that was easy to understand (figure 3) relative to their remaining counterparts.
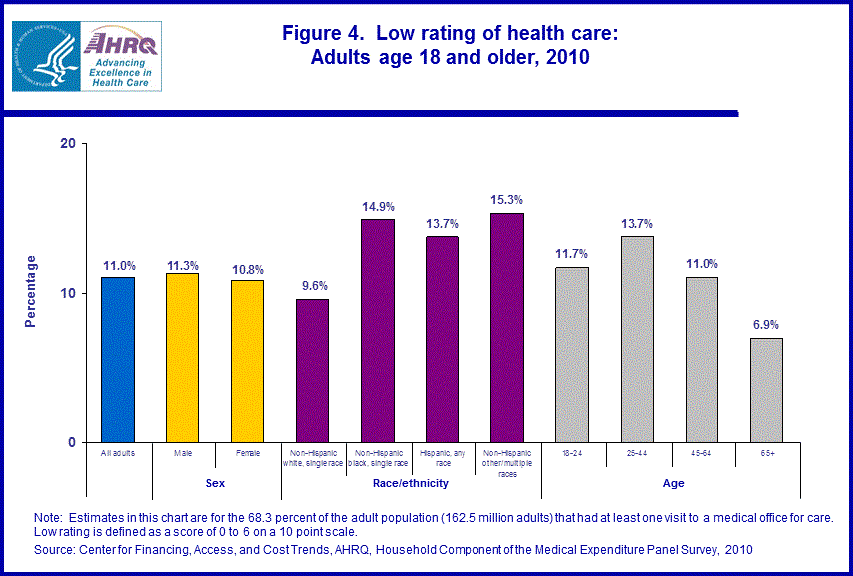
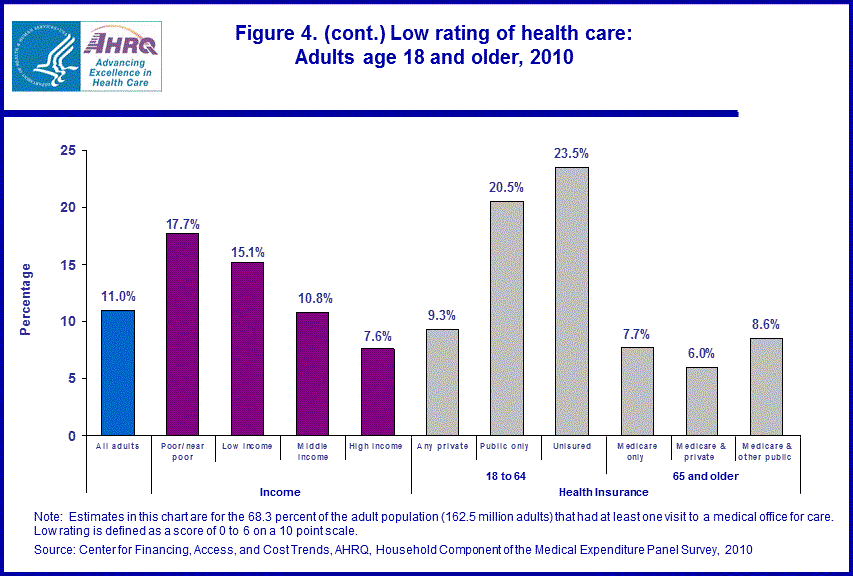
Among the 162.5 million adults with at least one visit to a medical office for care, the percentage reporting a low rating (defined as a score of 0 to 6 on a 10 point scale) with health care received varied by race/ethnicity, age, income level, and health insurance status. Non-Hispanic whites less likely (9.6 percent) to report a low rating of health care received than other race/ethnic groups (13.7 percent to 15.3 percent). Those age 65 and older, compared to all other adult age groups, were the least likely (6.9 percent) to report dissatisfaction with some health care received. Individuals in a family with high income were less likely to report (7.6 percent) a low rating of health care received as compared to all other income levels. Individuals, ages 18 to 64, with private health insurance were much less likely to report dissatisfaction with health care received (9.3 percent) than those with public-only insurance (20.5 percent) or those who were uninsured (23.5 percent) (figure 4).
Data Source
The estimates shown in this Statistical Brief are drawn from MEPS public use file, MEPS HC-138: 2010 Full Year Consolidated Data File.Definitions
Race/EthnicityClassification by race and ethnicity is mutually exclusive and based on information reported for each family member. Respondents were asked if each family member's race was best described as white, black, Asian, American Indian, Alaska Native, native Hawaiian, Pacific Islander, or multiple races. All persons whose main national origin or ancestry was reported as Hispanic, regardless of racial background, are classified as Hispanic. All non-Hispanic persons whose race was reported as Asian, American Indian, Alaska native, native Hawaiian, or multiple races are classified in the 'other' race category. For this analysis, the following classification by race and ethnicity was used: Hispanic (of any race), non-Hispanic black single race, non-Hispanic white single race and non-Hispanic other/multiple races.
Age
Defined using the last available age for each sampled person.
Poverty status
Each person in the survey sample was classified according to the total yearly income of his or her family. Within a household, all individuals related by blood, marriage, or adoption were considered to be a family. Personal income from all family members was summed to create family income. Poverty status is the ratio of family income to the federal poverty thresholds, which control for family size and age of the head of family. Categories are defined as follows:
- Poor/Near poor: This refers to persons in families with incomes under 125 percent of the poverty line, including persons with negative income.
- Low income: This category includes persons in families with income equal to or greater than 125 percent but less than 200 percent of the poverty line.
- Middle income: This category includes persons in families with income equal to or greater than 200 percent but less than 400 percent of the poverty line.
- High income: This category includes persons in families with income equal to or greater than 400 percent of the poverty line.
Education is measured as the highest level of education each individual has attained. We use the following three education categories:
- Less than high school: No HS diploma, GED or equivalent.
- High school graduate: HS diploma, GED or equivalent, or other degree.
- College graduate: Bachelor's, Master's, or Doctorate.
Based on household responses to health insurance status questions, adults ages 18–64 were classified in the following 3 insurance categories:
- Private health insurance: Individuals who, at any time during the year, had insurance that provides coverage for hospital and physician care (other than Medicare, Medicaid, or other public hospital/physician coverage). Coverage by TRICARE (Armed Forces-related coverage) was also included as private health insurance. Insurance that provides coverage for a single service only, such as dental or vision coverage, was not included.
- Public coverage only: Individuals who met both of the following criteria: 1) not covered by private insurance at any time during the year, 2) were covered by any of the following public programs at any point during the year: Medicare, Medicaid, or other public hospital/physician coverage.
- Uninsured: Persons not covered by private hospital/physician insurance, TRICARE, Medicare, Medicaid, or other public hospital/physician programs at any time during the entire year (or period of eligibility for the survey if that was less than a year).
- Medicare and private insurance: This category includes persons covered by Medicare and a supplementary private policy.
- Medicare and other public insurance: This category includes persons classified as Medicare beneficiaries who were not covered by private insurance at any point during the year but were covered by Medicaid or other public hospital/physician coverage at some point during the year.
- Medicare only: Persons classified as Medicare beneficiaries but not classified in either of the two categories above.
Variables from the Adult Self-Administered Questionnaire
The 2010 Self-Administered Questionnaire (SAQ), a paper-and-pencil questionnaire, was fielded during Panel 14 Round 4 and Panel 15 Round 2 of the 2010 Medical Expenditure Panel Survey (MEPS). The survey was designed to collect a variety of health status and health care quality measures of adults. All adults age 18 and older as of the Round 2 or 4 interview date in MEPS households were asked to complete a SAQ. The questionnaires were administered in late 2010 and early 2011. The following four variables from the SAQ are used in this Statistical Brief:
- How often individual got an appointment for health care as soon as he or she thought it was needed. The response categories are never, sometimes, usually or always. The categories "usually" and "always" were combined and the percentage of the responses for this combined category is reported. Only asked for persons that reported an injury or illness in the past 12 months that required immediate medical care.
- Number of times individual went to doctor's office or clinic to get care. The percentage of persons with no doctor's office or clinic visits is reported. Estimates differ slightly from those produced from the office-based medical provider visits file, presumably due to the longer recall period used in the SAQ. For example, based on the office-based medical provider visits file 27.1 percent of all adults had no visit to a doctor's office or clinic to get care, compared to 29.4 percent using the SAQ. This is a statistically significant difference at the 0.05 level.
- How often health providers explained things in a way that was easy to understand. The response categories are never, sometimes, usually or always. The categories "usually" and "always" were combined and the percentage of the responses for this combined category is reported. Only asked for persons with at least one visit to a medical office for care in the past 12 months.
- Rating of all health care in last 12 months, from 0 (worst health care possible) to 10 (best health care possible). The values of 0 to 6 were combined and defined as a "low rating of health care" and the percentage of the responses for this combined category is reported. Only asked for persons with at least one visit to a medical office for care in the past 12 months.
About MEPS-HC
The Medical Expenditure Panel Survey (MEPS) collects nationally representative data on health care use, expenditures, sources of payment, and insurance coverage for the U.S. civilian noninstitutionalized population. MEPS is cosponsored by the Agency for Healthcare Research and Quality (AHRQ) and the National Center for Health Statistics (NCHS). More information about MEPS can be found on the MEPS Web site at http://www.meps.ahrq.gov/. For a detailed description of the MEPS survey design see Methodology Report #22: Sample Design of the Medical Expenditure Panel Survey Household Component, 1998–2007, http://www.meps.ahrq.gov/mepsweb/data_files/publications/mr22/mr22.shtml.References
For a detailed description of the MEPS-HC survey design, sample design, and methods used to minimize sources of nonsampling error, see the following publications:Cohen, J. Design and Methods of the Medical Expenditure Panel Survey Household Component. MEPS Methodology Report No. 1. AHCPR Pub. No. 97-0026. Rockville, MD: Agency for Health Care Policy and Research, 1997. http://www.meps.ahrq.gov/mepsweb/data_files/publications/mr1/mr1.shtml
Cohen, S. Sample Design of the 1996 Medical Expenditure Panel Survey Household Component. MEPS Methodology Report No. 2. AHCPR Pub. No. 97-0027. Rockville, MD: Agency for Health Care Policy and Research, 1997. http://www.meps.ahrq.gov/mepsweb/data_files/publications/mr2/mr2.shtml
Cohen, S. Design Strategies and Innovations in the Medical Expenditure Panel Survey. Medical Care, July 2003: 41(7)Supplement: III-5–III-12.
Ezzati-Rice, TM, Rohde, F, Greenblatt, J, Sample Design of the Medical Expenditure Panel Survey Household Component, 1998–2007. Methodology Report No. 22. March 2008. Agency for Healthcare Research and Quality, Rockville, MD. http://www.meps.ahrq.gov/mepsweb/data_files/publications/mr22/mr22.shtml
Suggested Citation
Carroll, W. and Rhoades, J. Access and Experiences Regarding Health Care: Estimates for the U.S. Civilian Noninstitutionalized Population Age 18 and Older, 2010. Statistical Brief #406. May 2013. Agency for Healthcare Research and Quality, Rockville, MD. http://www.meps.ahrq.gov/mepsweb/data_files/publications/st406/stat406.shtmlAHRQ welcomes questions and comments from readers of this publication who are interested in obtaining more information about access, cost, use, financing, and quality of health care in the United States. We also invite you to tell us how you are using this Statistical Brief and other MEPS data and tools and to share suggestions on how MEPS products might be enhanced to further meet your needs. Please email us at mepsprojectdirector@ahrq.hhs.gov or send a letter to the address below:
Steven B. Cohen, PhD, Director
Center for Financing, Access, and Cost Trends
Agency for Healthcare Research and Quality
540 Gaither Road
Rockville, MD 20850
 |
||||||||||||||||||||||||||||||||||||||||||||||||||||||||||||||||||||||
|
||||||||||||||||||||||||||||||||||||||||||||||||||||||||||||||||||||||
|
|
||||||||||||||||||||||||||||||||||||||||||||||||||||||||||||||||||||||
 |
||||||||||||||||||||||||||||||||||||||||||||||||||||||||||||||||||||||
|
||||||||||||||||||||||||||||||||||||||||||||||||||||||||||||||||||||||
|
|
||||||||||||||||||||||||||||||||||||||||||||||||||||||||||||||||||||||
 |
||||||||||||||||||||||||||||||||||||||||||||||||||||||||||||||||||||||
|
||||||||||||||||||||||||||||||||||||||||||||||||||||||||||||||||||||||
|
|
||||||||||||||||||||||||||||||||||||||||||||||||||||||||||||||||||||||
 |
||||||||||||||||||||||||||||||||||||||||||||||||||||||||||||||||||||||
|
||||||||||||||||||||||||||||||||||||||||||||||||||||||||||||||||||||||
|
|
||||||||||||||||||||||||||||||||||||||||||||||||||||||||||||||||||||||
 |
||||||||||||||||||||||||||||||||||||||||||||||||||||||||||||||||||||||
|
||||||||||||||||||||||||||||||||||||||||||||||||||||||||||||||||||||||
|
|
||||||||||||||||||||||||||||||||||||||||||||||||||||||||||||||||||||||
 |
||||||||||||||||||||||||||||||||||||||||||||||||||||||||||||||||||||||
|
||||||||||||||||||||||||||||||||||||||||||||||||||||||||||||||||||||||
|
|
||||||||||||||||||||||||||||||||||||||||||||||||||||||||||||||||||||||
 |
||||||||||||||||||||||||||||||||||||||||||||||||||||||||||||||||||||||
|
||||||||||||||||||||||||||||||||||||||||||||||||||||||||||||||||||||||
|
|
||||||||||||||||||||||||||||||||||||||||||||||||||||||||||||||||||||||
 |
||||||||||||||||||||||||||||||||||||||||||||||||||||||||||||||||||||||
|
||||||||||||||||||||||||||||||||||||||||||||||||||||||||||||||||||||||
|
|
||||||||||||||||||||||||||||||||||||||||||||||||||||||||||||||||||||||


