
|
|
Font Size:
|
||||
|
|
|
|
||||
STATISTICAL BRIEF #408:
Heart Disease among Near Elderly Americans: Estimates for the U.S. Civilian Noninstitutionalized Population, 2010
Highlights
- In 2010, 16.8 percent of the 60.5 million near elderly persons in the U.S. reported that they had been diagnosed with heart disease.
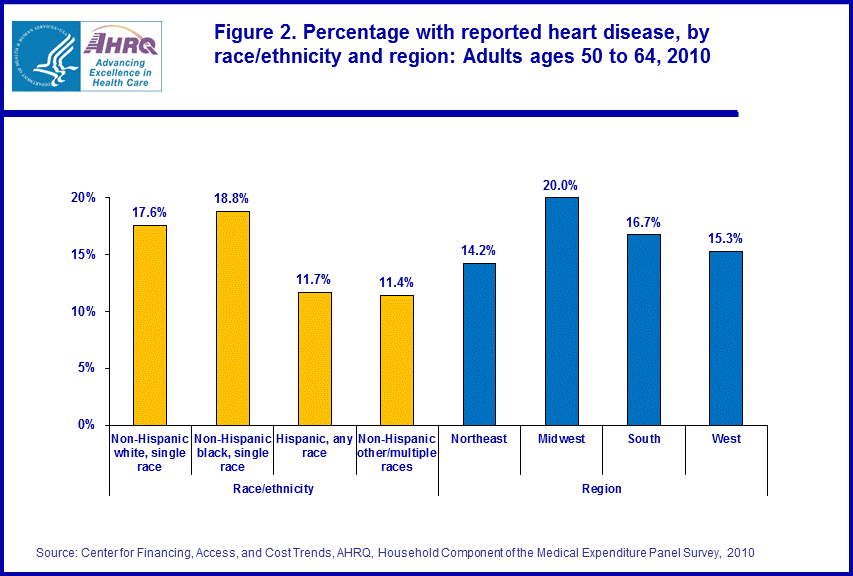
- Non-Hispanic whites and non-Hispanic blacks were both more likely than Hispanics and non-Hispanic individuals with other/multiple races to be diagnosed with heart disease (17.6 percent, 18.8 percent, 11.7 percent, and 11.4 percent respectively).
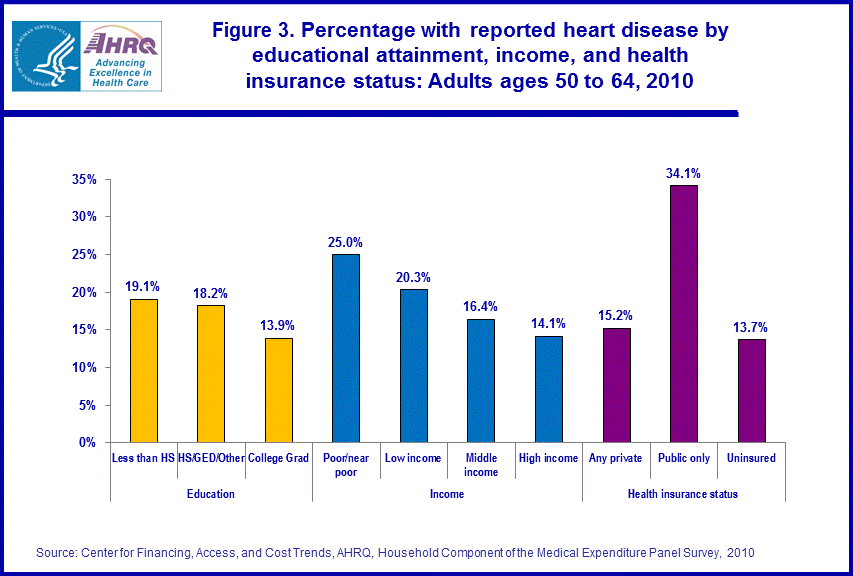
- Individuals in poor/near poor and low income families and those with public insurance were more likely than others to be diagnosed with heart disease (25.0 percent, 20.3 percent, and 34.1 percent respectively).
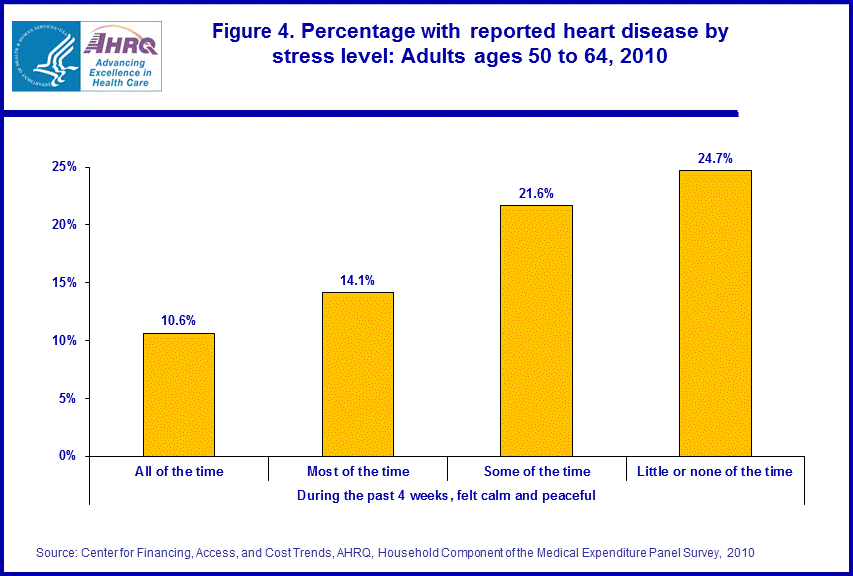
- Near elderly individuals who felt calm "all of the time" were less likely than others to have been diagnosed with heart disease (10.6 percent).
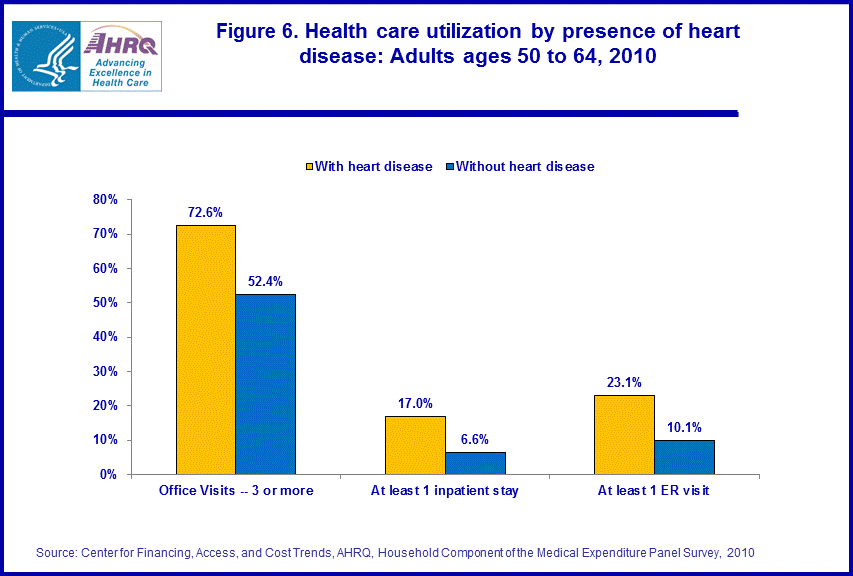
- Near elderly individuals with heart disease were more than twice as likely as those who had not been diagnosed with the condition to have at least one inpatient hospital stay (17.0 percent versus 6.6 percent) and at least one emergency room visit (23.1 percent versus 10.1 percent) during the year.
Introduction
Heart disease, which includes coronary heart disease, angina and heart attacks, is the leading cause of death in the U.S., accounting for almost 1 in every 4 deaths. Among near elderly (ages 50 to 64) adults there were more than 90,000 deaths due to heart disease in 2010, or 21.6 percent of all deaths for this age group.1 Heart disease is the leading cause of death for both men and women and for most racial/ethnic groups including whites, blacks, and Hispanics. A number of factors including high blood pressure, high LDL cholesterol, diabetes, being overweight or obese and physical inactivity, increase the risk of heart disease.2 About 1 in 6 near elderly adults in the U.S. civilian noninstitutionalized population was diagnosed with heart disease in 2010.3This Statistical Brief presents data from the 2010 Medical Expenditure Panel Survey (MEPS) on the percentage of near elderly persons in the U.S. population who have ever been told by a doctor, or other health professional, that they have heart disease. This Brief examines variation in the percentage of near elderly persons diagnosed with heart disease by demographic and socioeconomic characteristics and selected risk factors. The Brief also compares health care use and expenditures for near elderly persons with, and without, a diagnosis of heart disease.
Only differences that are statistically significant at the 0.05 level are discussed in the text.
Findings
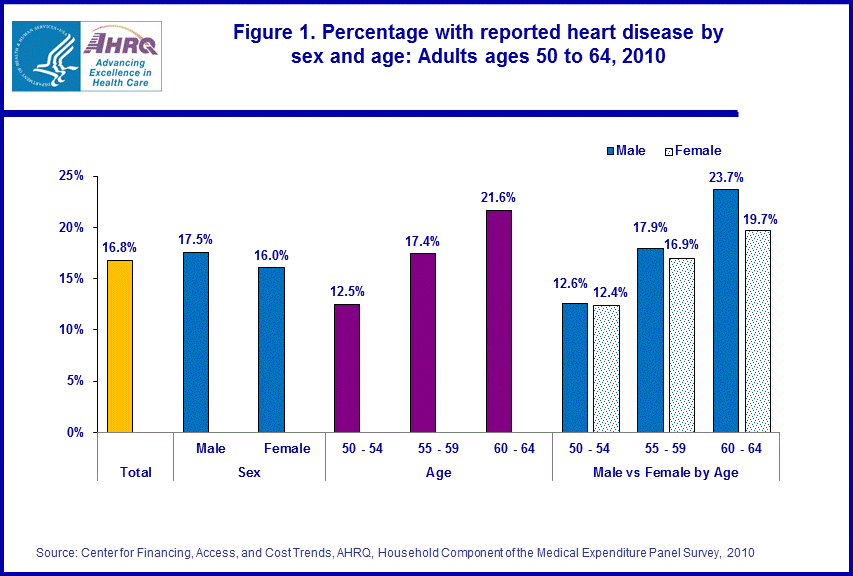
In 2010, 16.8 percent of the 60.5 million near elderly (ages 50 to 64) persons in the U.S. civilian noninstitutionalized population had been diagnosed at some time by a doctor as having coronary heart disease, angina, myocardial infarction (heart attack), or some other unspecified heart disease. The following sections describe variations in the percentage of near elderly persons with heart disease by selected characteristics.In 2010, there were significant differences by age, race/ethnicity, and geographic region in the proportion of near elderly persons who had been diagnosed with heart disease, but there were no statistically significant differences between men and women in the percentage reporting the condition (figures 1 and 2). Among the near elderly, heart disease increased with age as those ages 50–54 were the least likely, and those ages 55–59 were less likely than those ages 60–64 to have been diagnosed with the condition (12.5 percent, 17.4 percent, and 21.6 percent respectively). Non-Hispanic whites and non-Hispanic blacks were both more likely than Hispanics and non-Hispanic individuals with other/multiple races to have been diagnosed with heart disease (17.6 percent, 18.8 percent, 11.7 percent, and 11.4 percent respectively). Individuals living in the Midwest were more likely than those living in the Northeast, South, or West to have been diagnosed with heart disease (20.0 percent, 14.2 percent, 16.7 percent, and 15.3 percent respectively).
There were also significant differences in the percentage of near elderly persons with heart disease by education, income, and insurance status (figure 3). Individuals with less than a high school education and those with a high school degree were both more likely than those with at least a college education to have been diagnosed with heart disease (19.1 percent, 18.2 percent, and 13.9 percent respectively). Individuals in poor/near poor and low income families were both more likely than those in middle or high income families to have been diagnosed with heart disease (25.0 percent, 20.3 percent, 16.4 percent, and 14.1 percent respectively). Finally, near elderly persons with public insurance were more than twice as likely as the privately insured or the uninsured to have been diagnosed with heart disease (34.1 percent, 15.2 percent, and 13.7 percent respectively).
Risk factors (figures 4 and 5)
As shown in figure 4, the percentage of persons diagnosed with heart disease tends to increase with the level of stress. Near elderly persons who indicated that they felt calm "all of the time" in the previous 4 weeks were the least likely to have been diagnosed with heart disease. Further, those who felt calm "all of the time" or "most of the time" were both less likely to have been diagnosed with heart disease than those who only felt calm "some of the time or little" or "none of the time" (10.6 percent, 14.1 percent, 21.6 percent, and 24.7 percent respectively).
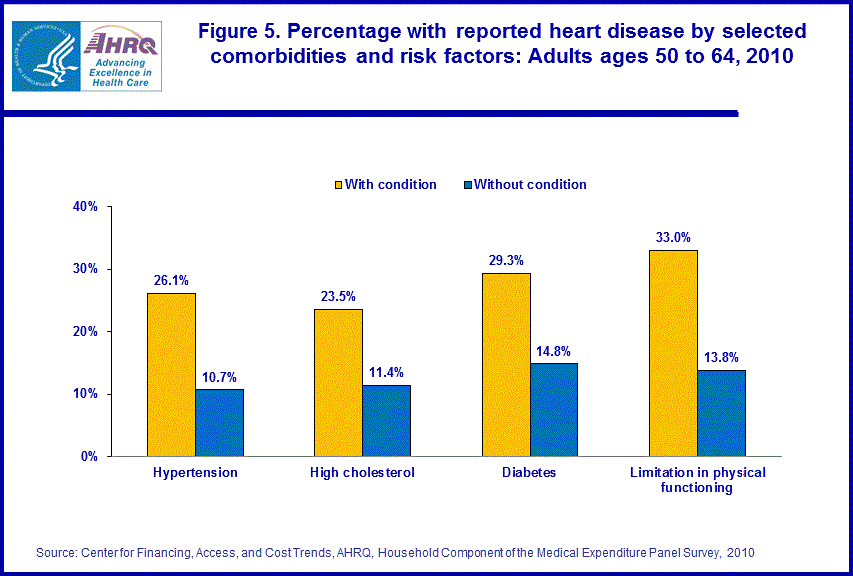
A number of related medical conditions were also associated with an increased rate of heart disease (figure 5). Near elderly persons who had been diagnosed with hypertension were significantly more likely to have heart disease than persons who did not have a diagnosis of hypertension (26.1 percent and 10.7 percent respectively). Similar differences in the diagnosis of heart disease existed for those with and without high cholesterol (23.5 percent versus 11.4 percent), diabetes (29.3 percent versus 14.8 percent), and limitations in physical functioning (33.0 percent versus 13.8 percent).
Health care use and expenditures (figures 6 and 7)
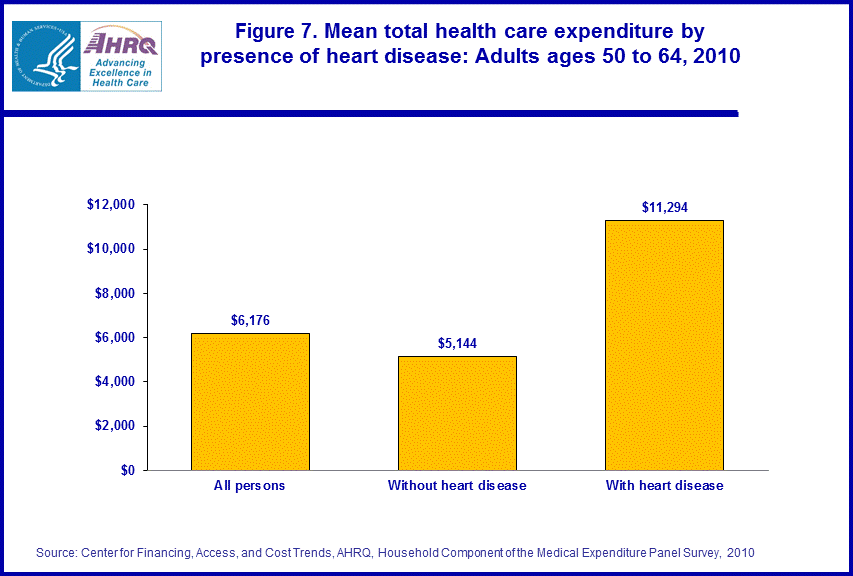
In 2010, near elderly persons with a diagnosis of heart disease made more intensive use of health care, on average, than persons without the condition. In particular, near elderly individuals with heart disease were more likely than those without the condition to have 3 or more office-based medical visits (72.6 percent versus 52.4 percent), and were more than twice as likely to have at least one inpatient hospital stay (17.0 percent versus 6.6 percent) and at least one emergency room visit (23.1 percent versus 10.1 percent) during the year. As a result of their more intensive use of medical care, average annual health expenditures for individuals with heart disease were a little more than double the average expenditure for individuals who had not been diagnosed with heart disease ($11,294 versus $5,144).
Data Source
The estimates shown in this Statistical Brief are drawn from the MEPS public use file, MEPS HC-138: 2010 Full Year Consolidated Data File.Definitions
AgeDefined using the last available age for each sampled person.
Race/ethnicity
Classification by race and ethnicity is mutually exclusive and based on information reported for each family member. Respondents were asked if each family member's race was best described as white, black, Asian, American Indian, Alaska Native, native Hawaiian, Pacific Islander, or multiple races. All persons whose main national origin or ancestry was reported as Hispanic, regardless of racial background, are classified as Hispanic. All non-Hispanic persons whose race was reported as Asian, American Indian, Alaska native, native Hawaiian, or multiple races are classified in the "other" race category. For this analysis, the following classification by race and ethnicity was used: Hispanic (of any race), non-Hispanic black, non-Hispanic white and non-Hispanic other/multiple races.
Census region
Each MEPS sampled person was classified as living in one of the following four regions as defined by the U.S. Census Bureau:
- Northeast: Maine, New Hampshire, Vermont, Massachusetts, Rhode Island, Connecticut, New York, New Jersey, and Pennsylvania
- Midwest: Ohio, Indiana, Illinois, Michigan, Wisconsin, Minnesota, Iowa, Missouri, South Dakota, North Dakota, Nebraska, and Kansas
- South: Delaware, Maryland, District of Columbia, Virginia, West Virginia, North Carolina, South Carolina, Georgia, Florida, Kentucky, Tennessee, Alabama, Mississippi, Arkansas, Louisiana, Oklahoma, and Texas
- West: Montana, Idaho, Wyoming, Colorado, New Mexico, Arizona, Utah, Nevada, Washington, Oregon, California, Alaska, and Hawaii
Education is measured as the highest level of education each individual has attained. We use the following three education categories:
- Less than high school: No HS diploma, GED, or equivalent.
- High school graduate: HS diploma, GED or equivalent, or other degree.
- College graduate: Bachelor's, Master's, or Doctorate.
Each person in the survey sample was classified according to the total yearly income of his or her family. Within a household, all individuals related by blood, marriage, or adoption were considered to be a family. Personal income from all family members was summed to create family income. Poverty status is the ratio of family income to the federal poverty thresholds, which control for family size and age of the head of family. Categories are defined as follows:
- Poor/near poor income: People in families with income of 125 percent of the Federal poverty line or less, including those who reported negative income.
- Low income: People in families with income from over 125 percent through 200 percent of the Federal poverty line.
- Middle income: People in families with income from over 200 percent through 400 percent of the Federal poverty line.
- High income: People in families with income over 400 percent of the Federal poverty line.
Based on household responses to health insurance status questions, adults ages 50–64 were classified in the following three insurance categories:
- Private health insurance: Individuals who, at any time during the year, had insurance that provides coverage for hospital and physician care (other than Medicare, Medicaid, or other public hospital/physician coverage). Coverage by TRICARE (Armed Forces-related coverage) was also included as private health insurance. Insurance that provides coverage for a single service only, such as dental or vision coverage, was not included.
- Public coverage only: Individuals who met both of the following criteria: 1) not covered by private insurance at any time during the year, 2) were covered by any of the following public programs at any point during the year: Medicare, Medicaid, or other public hospital/physician coverage.
- Uninsured: Persons not covered by private hospital/physician insurance, TRICARE, Medicare, Medicaid, or other public hospital/physician programs at any time during the entire year (or period of eligibility for the survey if that was less than a year).
The following question from the Self-Administered Questionnaire was used as a measure for stress: "How much of the time during the past 4 weeks have you felt calm and peaceful? All of the time, most of the time, some of the time, a little of the time, or none of the time?"
Heart disease
Persons who were ever told by a doctor or other health professional that they had coronary heart disease, angina, heart attack (or myocardial infarction), or other unspecified heart disease were classified as having heart disease.
Diabetes
Persons who were ever told by a doctor or other health professional that they had diabetes or sugar diabetes were classified as having diabetes.
High cholesterol
Persons who were ever told by a doctor or other health professional that they had high cholesterol were classified as having high cholesterol.
Hypertension
Persons who were told by a doctor or other health professional, on two or more different visits, that they had hypertension, or high blood pressure, were classified as having hypertension.
Functional Limitation
Persons who had difficulties walking, climbing stairs, grasping objects, reaching overhead, lifting, bending or stooping, or standing for long periods of time were classified as having a functional limitation.
About MEPS-HC
The Medical Expenditure Panel Survey (MEPS) collects nationally representative data on health care use, expenditures, sources of payment, and insurance coverage for the U.S. civilian noninstitutionalized population. MEPS is cosponsored by the Agency for Healthcare Research and Quality (AHRQ) and the National Center for Health Statistics (NCHS). More information about MEPS can be found on the MEPS Web site at http://www.meps.ahrq.gov/.References
For a detailed description of the MEPS-HC survey design, sample design, and methods used to minimize sources of nonsampling error, see the following publications:Cohen, J. Design and Methods of the Medical Expenditure Panel Survey Household Component. MEPS Methodology Report No. 1. AHCPR Pub. No. 97-0026. Rockville, MD: Agency for Health Care Policy and Research, 1997. http://www.meps.ahrq.gov/mepsweb/data_files/publications/mr1/mr1.shtml
Cohen, S. Sample Design of the 1996 Medical Expenditure Panel Survey Household Component. MEPS Methodology Report No. 2. AHCPR Pub. No. 97-0027. Rockville, MD: Agency for Health Care Policy and Research, 1997. http://www.meps.ahrq.gov/mepsweb/data_files/publications/mr2/mr2.shtml
Cohen, S. Design Strategies and Innovations in the Medical Expenditure Panel Survey. Medical Care, July 2003: 41(7) Supplement: III-5–III-12.
Ezzati-Rice, T. M., Rohde, F., Greenblatt, J. Sample Design of the Medical Expenditure Panel Survey Household Component, 1998–2007. Methodology Report No. 22. March 2008. Agency for Healthcare Research and Quality, Rockville, MD. http://www.meps.ahrq.gov/mepsweb/data_files/publications/mr22/mr22.shtml
Suggested Citation
Carroll, W. and Miller, G. E. Heart Disease among Near Elderly Americans: Estimates for the U.S. Civilian Noninstitutionalized Population, 2010. Statistical Brief #408. June 2013. Agency for Healthcare Research and Quality, Rockville, MD. http://www.meps.ahrq.gov/mepsweb/data_files/publications/st408/stat408.shtmlAHRQ welcomes questions and comments from readers of this publication who are interested in obtaining more information about access, cost, use, financing, and quality of health care in the United States. We also invite you to tell us how you are using this Statistical Brief and other MEPS data and tools and to share suggestions on how MEPS products might be enhanced to further meet your needs. Please email us at MEPSProjectDirector@ahrq.hhs.gov or send a letter to the address below:
Steven B. Cohen, PhD, Director
Center for Financing, Access, and Cost Trends
Agency for Healthcare Research and Quality
540 Gaither Road
Rockville, MD 20850
1 Centers for Disease Control and Prevention, National Center for Health Statistics. Multiple Cause of Death 1999–2010 on CDC WONDER Online Database released 2012. Data are from the Multiple Cause of Death Files, 1999–2010
2 Centers for Disease Control and Prevention. Division for Heart Disease and Stroke Prevention. Heart Disease Fact Sheet. Accessed on February 13, 2013. http://www.cdc.gov/dhdsp/data_statistics/fact_sheets/fs_heart_disease.htm.
3 Authors' calculations from the 2010 Medical Expenditure Panel Survey Household Component.
 |
||||||||||||||||||||||||||||||||||||||||||||||||||||||||||||
|
||||||||||||||||||||||||||||||||||||||||||||||||||||||||||||
|
|
||||||||||||||||||||||||||||||||||||||||||||||||||||||||||||
 |
||||||||||||||||||||||||||||||||||||||||||||||||||||||||||||
|
||||||||||||||||||||||||||||||||||||||||||||||||||||||||||||
|
|
||||||||||||||||||||||||||||||||||||||||||||||||||||||||||||
 |
||||||||||||||||||||||||||||||||||||||||||||||||||||||||||||
|
||||||||||||||||||||||||||||||||||||||||||||||||||||||||||||
|
|
||||||||||||||||||||||||||||||||||||||||||||||||||||||||||||
 |
||||||||||||||||||||||||||||||||||||||||||||||||||||||||||||
|
||||||||||||||||||||||||||||||||||||||||||||||||||||||||||||
|
|
||||||||||||||||||||||||||||||||||||||||||||||||||||||||||||
 |
||||||||||||||||||||||||||||||||||||||||||||||||||||||||||||
|
||||||||||||||||||||||||||||||||||||||||||||||||||||||||||||
|
|
||||||||||||||||||||||||||||||||||||||||||||||||||||||||||||
 |
||||||||||||||||||||||||||||||||||||||||||||||||||||||||||||
|
||||||||||||||||||||||||||||||||||||||||||||||||||||||||||||
|
|
||||||||||||||||||||||||||||||||||||||||||||||||||||||||||||
 |
||||||||||||||||||||||||||||||||||||||||||||||||||||||||||||
|
||||||||||||||||||||||||||||||||||||||||||||||||||||||||||||
|
|
||||||||||||||||||||||||||||||||||||||||||||||||||||||||||||


