STATISTICAL BRIEF #522:
|
||||||||||||||||||||||||||||||||||||||||||||||||||||||||||||||||
| May 2019 | ||||||||||||||||||||||||||||||||||||||||||||||||||||||||||||||||
|
William A. Carroll, MA and Steven C. Hill, PhD |
||||||||||||||||||||||||||||||||||||||||||||||||||||||||||||||||
Highlights
|
||||||||||||||||||||||||||||||||||||||||||||||||||||||||||||||||
IntroductionPrescribed medicines may save lives and improve quality of life, but rising expenditures on prescribed medicines are an area of concern for U.S. policymakers and health care consumers. Data on trends in person level prescribed medication expenditures by age and prescription drug coverage status provide information that is valuable to both decisionmakers and the public. This Statistical Brief examines trends in average and median total person level expenditures, average and median out-of-pocket expenditures, and average total and out-of-pocket expenditures by age and type of prescription drug coverage, for persons with at least one prescribed medication purchase during the years from 2009 to 2016. Only expenditures for prescriptions purchased or obtained in an outpatient setting are included in these estimates. Prescription medicines administered in an inpatient setting or in a clinic or physician's office are not recorded in the MEPS data. Total expenditures are in real dollars; estimates for 2009 to 2015 were adjusted to 2016 dollars. Dollar estimates are rounded but percentage change estimates are based on unrounded dollar estimates. All differences discussed in the text are statistically significant at the p<0.05 level, or better. |
||||||||||||||||||||||||||||||||||||||||||||||||||||||||||||||||
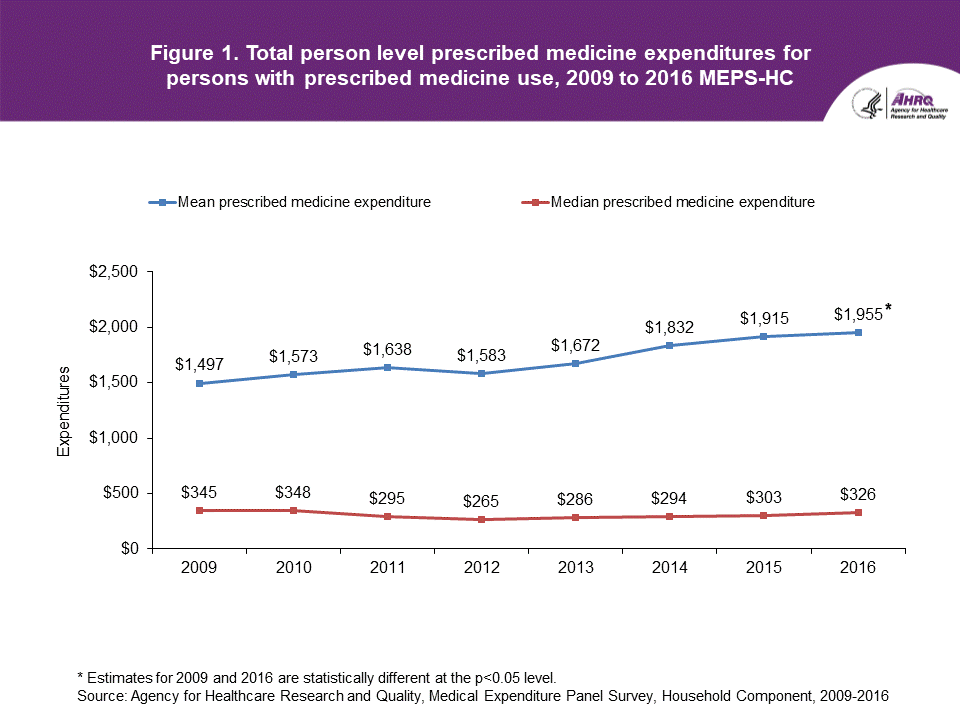
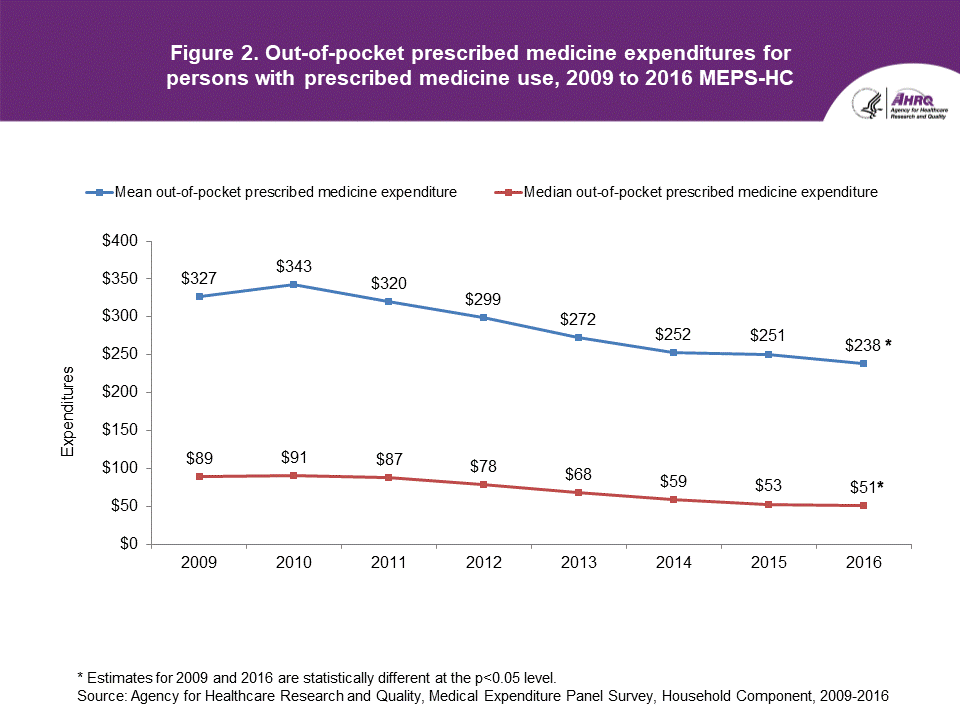
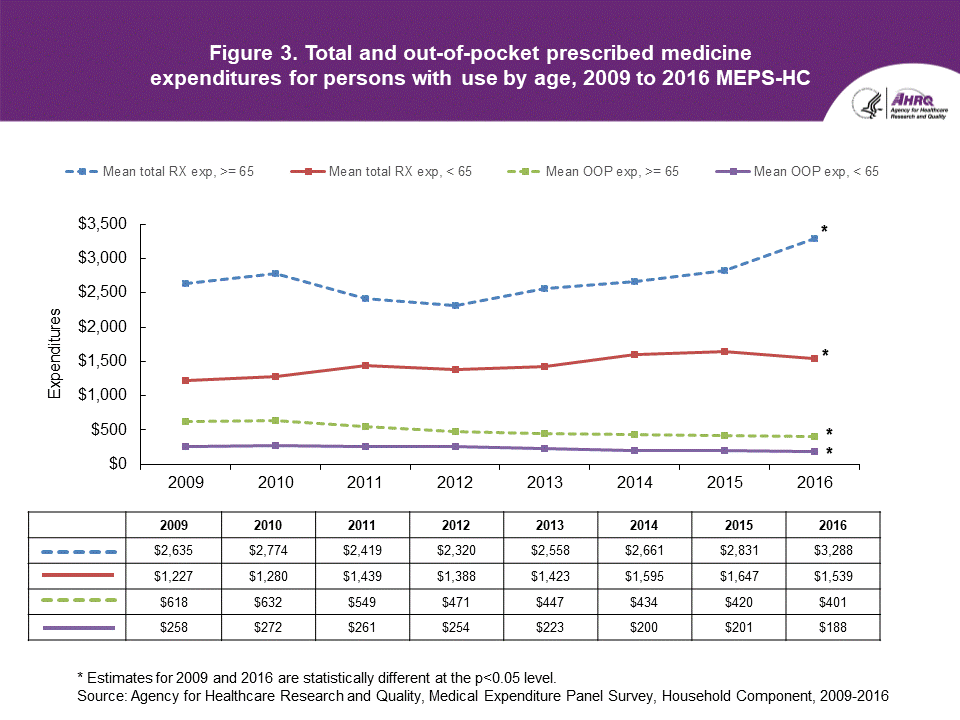
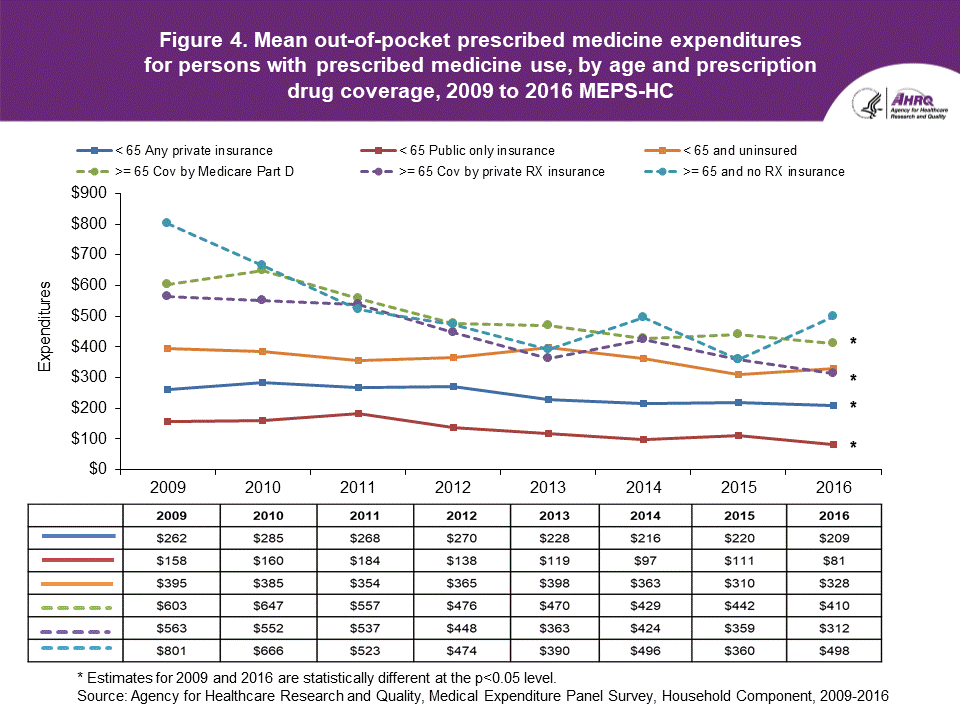
FindingsTotal and out-of-pocket person level expenditures (figures 1 and 2)Among persons who obtained at least one prescribed medication, there were different trends in average and median total expenditures on prescribed medications. Average total drug expenditures per person increased significantly from 2009 to 2016. In 2009, the average total expenditures per person with any medication use were $1,497, including the amount paid out of pocket plus any third party payments from health insurance or other sources. By 2016, mean expenditures had risen to $1,955, an increase of 30.6 percent, or an average annual increase of 3.9 percent per year. Note that there were also increases in average spending per capita (including those who did not obtain drugs), because the percentage of the population that obtained prescribed medicines was fairly constant (ranging from 60.3 to 62.8 percent) over this time period (not shown). However, median total expenditures per person who obtained prescribed medicines did not change significantly between the beginning and end of this time period. During this time period, out-of-pocket spending decreased. Average out-of-pocket spending for prescribed medications, among persons who obtained at least one prescribed medication, declined from $327 in 2009 to $238 by 2016, a decrease of $89. This is a 27.0 percent decrease or an average annual decrease of 4.4 percent per year. Median out-of-pocket costs also decreased over this time period, from $89 in 2009 to $51 in 2016, a $38 decrease, or 42.7 percent. Total and out-of-pocket expenditures by age (figure 3)In every year from 2009 to 2016, among persons who obtained at least one prescribed medication, the elderly had consistently higher total and out-of-pocket expenditures. For example, in 2016, the average total expenditure for the elderly was more than twice that of the non-elderly ($3,288 versus $1,539, respectively). In 2016, average out-of-pocket spending for the elderly was also more than twice that of the non-elderly ($401 versus $188, respectively). Average total expenditures for prescribed medications increased for both the elderly and non-elderly from 2009 to 2016. In 2009, the average total expenditure for the elderly was $2,635 and rose to $3,288 by 2016, an increase of $653 or 24.8 percent. The non-elderly had an average total expenditure of $1,227 in 2009 and $1,539 by 2016, an increase of $312 or 25.4 percent. The rates of increase were not statistically different for the two groups. Among persons who obtained at least one prescribed medication, the overall increase in the average expenditures, 30.6 percent, is higher than the increases for the subgroups, because the elderly, who had higher spending, grew from 19.2 percent of the total population in 2009 to 23.8 percent in 2016. Average out-of-pocket costs decreased for both the elderly and non-elderly from 2009 to 2016. The elderly had a decrease of $217, or 35.1 percent, from $618 in 2009 to $401 in 2016 while the non-elderly had a decrease of $70, or 27.1 percent, from $258 in 2009 to $188 in 2016. Average out-of-pocket spending by age and prescription drug coverage (figure 4)Among the non-elderly who obtained prescribed medicines, the uninsured paid significantly more out of pocket on average than their insured counterparts in all years. For example, in 2016 average out-of-pocket spending by the uninsured was $328, compared with $209 for those with any private health insurance, and $81 for those covered by public insurance only. In the analyses for this Brief, the elderly are divided into three categories of drug coverage: 1) those with Medicare Part D drug coverage; 2) those with private insurance that includes drug coverage; and 3) those with no drug coverage. From 2009 to 2016, among the elderly who obtained prescribed medicines, the category of drug coverage with higher out-of-pocket spending varied from year to year. In 2016, the elderly covered under Medicare Part D paid an average of $410 out of pocket, compared with $312 for those elderly covered under private prescribed medicine insurance. Average out-of-pocket costs for prescribed medications decreased across the four categories of elderly and non-elderly persons with at least some drug coverage during the year, but the uninsured and the elderly without drug coverage saw no significant change from 2009 to 2016. The non-elderly covered by public insurance saw a 48.7 percent decrease in the amount paid out of pocket, from $158 in 2009 to $81 in 2016. This was a significantly larger percentage decrease compared with the non-elderly covered by private insurance, who saw a 20.3 percent decrease over this time period, from $262 in 2009 to $209 in 2016. Among the elderly with drug coverage, rates of decrease in out-of-pocket spending were similar for those with Medicare Part D and those with private prescription drug coverage. |
||||||||||||||||||||||||||||||||||||||||||||||||||||||||||||||||
Data SourceThe estimates shown in this Statistical Brief are based on data from the 2009 to 2016 MEPS Full Year Consolidated Data Files: HC-129, HC-138, HC-147, HC-155, HC-163, HC-171, HC-181, HC-192. |
||||||||||||||||||||||||||||||||||||||||||||||||||||||||||||||||
DefinitionsTotal expenditures are the total direct payments from all sources to pharmacies for prescription fills reported by respondents in the MEPS-HC. Manufacturer rebates to payers and pharmacy benefit companies were not measured and were not subtracted from total direct payments. Out-of-pocket expenditures are the dollar amounts paid by individuals or their family members. Expenditures are in real dollars; estimates of total expenditures for 2009 to 2015 were adjusted to 2016 dollars based on the gross domestic product (GDP) Price Index, while out-of-pocket expenditures were adjusted using the Consumer Price Index (CPI).Prescription drug coverage categories:
|
||||||||||||||||||||||||||||||||||||||||||||||||||||||||||||||||
About MEPS-HCThe Medical Expenditure Panel Survey Household Component (MEPS-HC) collects nationally representative data on health care use, expenditures, sources of payment, and insurance coverage for the U.S. civilian noninstitutionalized population. The MEPS-HC is cosponsored by the Agency for Healthcare Research and Quality (AHRQ) and the National Center for Health Statistics (NCHS). More information about the MEPS-HC can be found on the MEPS Web site at https://meps.ahrq.gov/. |
||||||||||||||||||||||||||||||||||||||||||||||||||||||||||||||||
ReferencesFor a detailed description of the MEPS-HC survey design, sample design, and methods used to minimize sources of nonsampling error, see the following publications:Agency for Healthcare Research and Quality. Using Appropriate Price Indices for Analyses of Health Care Expenditures or Income across Multiple Years. Rockville, MD: Agency for Healthcare Research and Quality, 2018. https://meps.ahrq.gov/about_meps/Price_Index.shtml Cohen, J. Design and Methods of the Medical Expenditure Panel Survey Household Component. MEPS Methodology Report No. 1. AHCPR Pub. No. 97-0026. Rockville, MD: Agency for Healthcare Policy and Research, 1997. https://meps.ahrq.gov/data_files/publications/mr1/mr1.shtml Cohen, S. Sample Design of the 1996 Medical Expenditure Panel Survey Household Component. MEPS Methodology Report No. 2. AHCPR Pub. No. 97-0027. Rockville, MD: Agency for Health Care Policy and Research, 1997. https://meps.ahrq.gov/data_files/publications/mr2/mr2.shtml Cohen, S. Design Strategies and Innovations in the Medical Expenditure Panel Survey. Medical Care, July 2003:41(7) Supplement: III-5III-12. Ezzati-Rice, T.M., Rohde, F., Greenblatt, J. Sample Design of the Medical Expenditure Panel Survey Household Component, 19982007. Methodology Report #22. March 2008. Agency for Healthcare Research and Quality, Rockville, MD. https://meps.ahrq.gov/data_files/publications/mr22/mr22.shtml Hill, S.C., Roemer, M., Stagnitti, M.N. Outpatient Prescription Drugs: Data Collection and Editing in the 2011 Medical Expenditure Panel Survey. Methodology Report #29. March 2014. Agency for Healthcare Research and Quality, Rockville, MD. https://meps.ahrq.gov/data_files/publications/mr29/mr29.shtml Hill, S.C., Zuvekas, S.H., Zodet, M.W. The Validity of Reported Medicare Part D Enrollment in the Medical Expenditure Panel Survey. Medical Research and Review, December 2012:69(6):737750. Stagnitti, M.N., Beauregard, K., Solis, A. Design, Methods, and Field Results of the Medical Expenditure Panel Survey Medical Provider Component (MEPS MPC)2006 Calendar Year Data. Methodology Report #23. November 2008. Agency for Healthcare Research and Quality, Rockville, MD. https://meps.ahrq.gov/data_files/publications/mr23/mr23.shtml Bernard, D., Cowan, C., Selden, T., et al. Reconciling Medical Expenditure Estimates from the MEPS and NHEA, 2007. Medicare & Medicaid Research Review. 2012;2(4). https://www.ncbi.nlm.nih.gov/pmc/articles/PMC4006479/ |
||||||||||||||||||||||||||||||||||||||||||||||||||||||||||||||||
Suggested CitationCarroll, W.A. and Hill, S.C. Trends in Prescribed Medication Expenditures by Age and Prescription Drug Coverage, 2009 to 2016 MEPS-HC. Statistical Brief #522. May 2019. Agency for Healthcare Research and Quality, Rockville, MD. https://meps.ahrq.gov/data_files/publications/st522/stat522.shtml |
||||||||||||||||||||||||||||||||||||||||||||||||||||||||||||||||
|
AHRQ welcomes questions and comments from readers of this publication who are interested in obtaining more information about access, cost, use, financing, and quality of health care in the United States. We also invite you to tell us how you are using this Statistical Brief and other MEPS data and tools and to share suggestions on how MEPS products might be enhanced to further meet your needs. Please email us at MEPSProjectDirector@ahrq.hhs.gov or send a letter to the address below: Joel W. Cohen, PhD, Director Center for Financing, Access, and Cost Trends Agency for Healthcare Research and Quality 5600 Fishers Lane, Mailstop 07W41A Rockville, MD 20857 |
||||||||||||||||||||||||||||||||||||||||||||||||||||||||||||||||
 |
||||||||||||||||||||||||||||||||||||||||||||||||||||||||||||||||
|
||||||||||||||||||||||||||||||||||||||||||||||||||||||||||||||||
 |
||||||||||||||||||||||||||||||||||||||||||||||||||||||||||||||||
|
||||||||||||||||||||||||||||||||||||||||||||||||||||||||||||||||
 |
||||||||||||||||||||||||||||||||||||||||||||||||||||||||||||||||
|
||||||||||||||||||||||||||||||||||||||||||||||||||||||||||||||||
 |
||||||||||||||||||||||||||||||||||||||||||||||||||||||||||||||||
|

|
|
Font Size:
|
||||
|
|
|
|
||||


