
|
|
Font Size:
|
||||
|
|
|
|
||||
Dental Utilization and Expenditures, U.S. Civilian Noninstitutionalized Population Aged 2 and Older, 2019-2021
Statistical Brief #555 | March 2024 | R. Henry Olaisen, PhD, MPH, PMP and Richard J Manski, DDS, MBA, PhD
Highlights
- Dental utilization and expenditures in the United States declined in the first year of the COVID-19 pandemic. Total dental expenditures declined by 16.1% from 2019 to 2020; the number of people using dental services declined by 12.5%, and the total number of dental visits decreased by 19.0%.
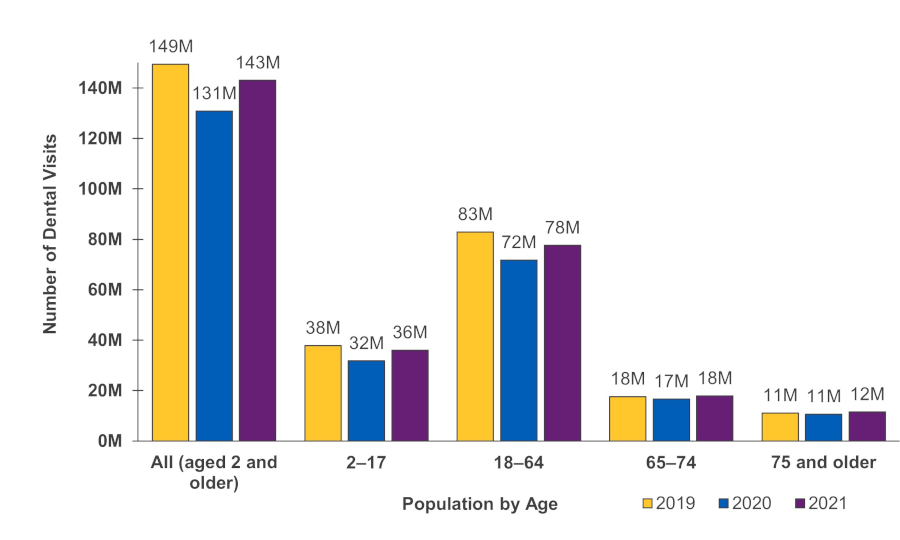
- In 2020, around 131 million persons utilized dental care (40.8% of the total U.S. civilian noninstitutionalized population aged 2 and over), 18 million fewer people than the year before (149 million; 46.7%).
- In 2020, the monthly dental visit volume dipped substantially for three consecutive months compared to the same months in 2019.
- Between 2019 and 2021, the average—inflation-adjusted—annual expenditures for dental care among persons with any dental care did not differ significantly.
Introduction
The COVID-19 pandemic exacerbated the already low utilization of oral healthcare services across the United States. In 2018, less than half (46.2%) of Americans age 2 and older used the oral healthcare system.1 Costs have long been recognized as a key barrier to timely dental treatment. Healthcare utilization, specifically for routine health services early in the pandemic, was substantially reduced compared to pre-pandemic trends.2
In this Statistical Brief, we compare dental service utilization and expenditures for the U.S. civilian noninstitutionalized population aged 2 and older from 2019 through 2021. These data were obtained from the Agency for Healthcare Research and Quality (AHRQ) 2019-2021 Medical Expenditure Panel Survey Household Component (MEPS-HC). We present data on patients with dental visits, and we highlight differences in dental utilization and expenditures by age, as well as trends in dental visits by month, comparing 2019-2021. All differences discussed in the text are statistically significant at the 0.05 level unless otherwise noted.
Note that all healthcare utilization in the MEPS is reported by household respondents, and medical expenditures associated with dental events are not verified using administrative records. Although the onset of the COVID-19 pandemic created concerns about reporting accuracy, due to the impacts on MEPS field operations, changes in response mode, and lower response rates, analyses indicate that these changes did not adversely affect the quality of reporting on healthcare use in MEPS.3
Findings
Number of people with dental visits (figure 1)
The number of people using dental services declined by 12.5% in the first year of the COVID-19 pandemic. Between 2019 and 2021, the number of people aged 2 and older who used dental services decreased from 149 million people in 2019 (46.7% of the population aged 2 and above) to 131 million in 2020 (40.8%; 2021: 143 million; 44.2%). The decline in visits between 2019 and 2020 was greatest among children (aged 2-17) and adults aged 18-64.
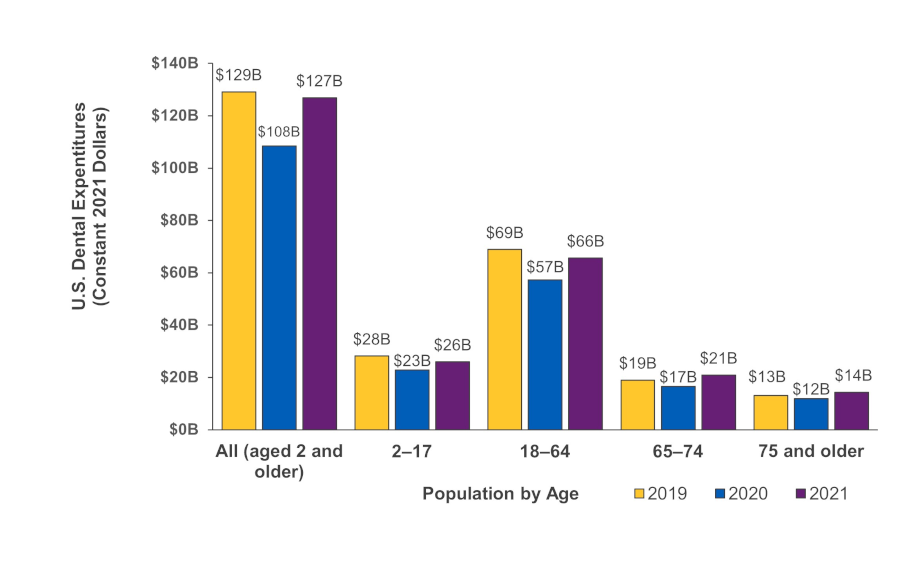
Total dental expenditures (figure 2)
In 2020, total annual dental expenditures declined by 16.1% compared to 2019 ($108 billion versus $129 billion, in inflation-adjusted dollars). The lower expenditures in 2020 were driven by reduced expenditures among children aged 2-17 and adults aged 18-64. Expenditures in 2021 were not significantly different from 2019 levels.
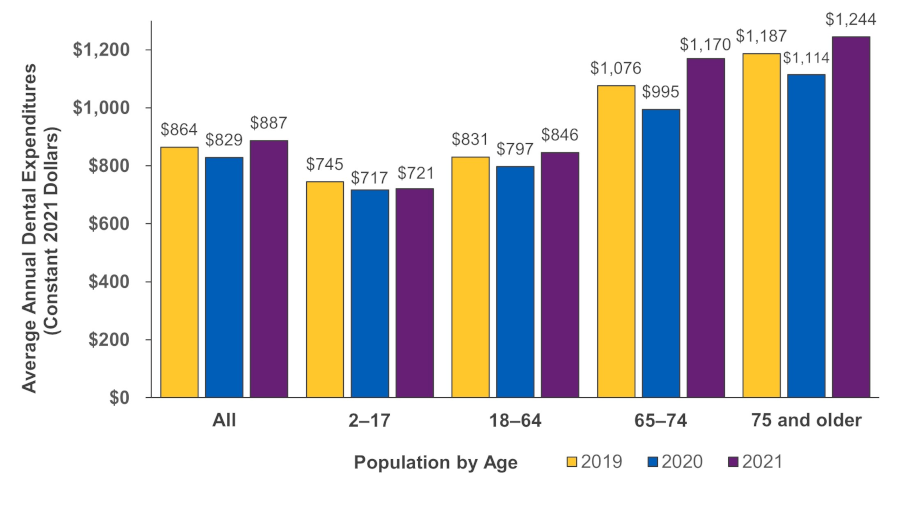
Average dental expenditures (figure 3)
Between 2019 and 2021, the average annual dental expenditures for each person with any dental visits did not vary significantly ($864, $829, and $887, respectively, in inflation-adjusted dollars). For all 3 years, average annual dental expenditures remained substantially higher among older adults (aged 75 and older) compared to children (aged 2-17).
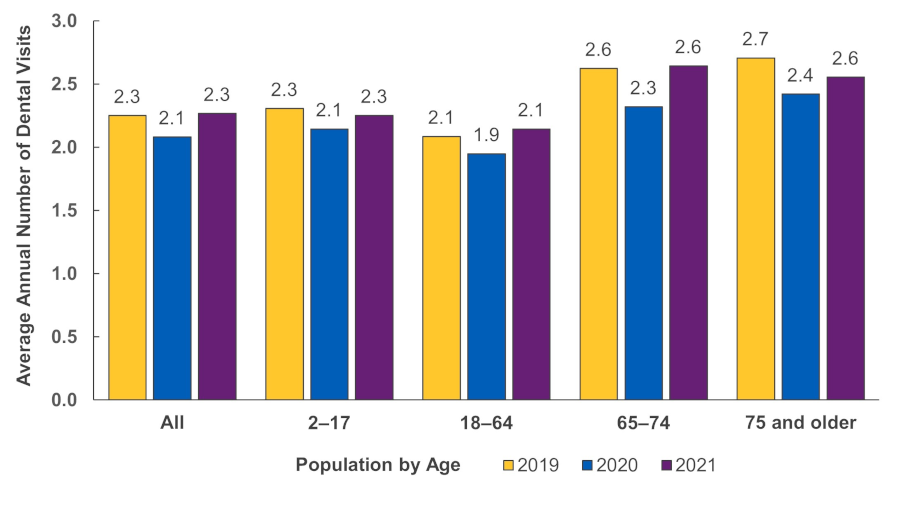
Average number of dental visits (figure 4)
Among those with any dental visits, the average number of visits declined from 2.3 in 2020 to 2.1 in 2019; the number of visits returned to the pre-pandemic average in 2021. The bounce-back was observed across all age groups. For all 3 years, adults aged 65-74 and adults aged 75 and older had a higher average number of dental visits than children (aged 2-17) and adults aged 18-64.
Total dental visits by month (figure 5)
Overall, the number of monthly dental visits decreased by 19.0% in 2020 and returned to pre-pandemic levels in 2021. Following the first substantial dip in spring 2020 (-81.9% in April 2020 compared to April 2019), a second, smaller dip occurred in late 2020 (-18.3% in October 2020 compared to October 2019).
Data Source
This Statistical Brief uses data from the 2019-2021 MEPS Full Year Consolidated Public Use Files (HC-216, HC-224 and HC-233) and the 2019-2021 Dental Visits Public Use Files (HC-213B, HC-220B, and HC-229B).
Definitions
Age
Age is defined by years lived at the end of the calendar year for which data were reported (or on the last date of MEPS eligibility if a person was out of scope at the end of the year). We focus on people aged 2 and older, consistent with the data methodology and denominator used in Healthy People 2030.1Dental utilization
Dental utilization refers to the use of the dental healthcare system, measured in this Statistical Brief as (1) the number of unique individuals seen by dental providers in an office-based setting, (2) the number of total dental visits, and (3) the average number of dental visits among those with any visits. Note that healthcare utilization is reported by household respondents, which is subject to recall bias and may therefore vary from actual utilization.Dental visits
Dental visits refer to care by, or visits to, any type of dental care provider, including general dentists, dental hygienists, dental technicians, dental surgeons, orthodontists, endodontists, and periodontists, within a dental office-based setting. This Statistical Brief excludes dental visits to urgent care, emergency departments, and in-patient hospitals, as these settings are not part of the U.S. office-based dental healthcare system.Expenditures
Expenditures in this report refer to what is paid for office-based dental services. More specifically, expenditures in MEPS are defined as the sum of payments for care received, including out-of-pocket payments and payments made by private insurance, Medicaid, Medicare, and other sources. Expenditures are in constant 2021 dollars; estimates for 2019 and 2020 are inflated to 2021 dollars based on the gross domestic product (GDP) price index.4 The only source of dental visit information is the respondent, whereas office-based physician visits are part of the MEPS Medical Provider Component, through which additional expenditure information is gathered from the respondent's provider.Month of visit
The month the office-based dental event occurred, as reported through the MEPS household respondent at the time of the interview.About MEPS-HC
The Medical Expenditure Panel Survey Household Component (MEPS-HC) collects nationally representative data on healthcare use, expenditures, sources of payment, and insurance coverage for the U.S. civilian noninstitutionalized population. The MEPS-HC is cosponsored by the Agency for Healthcare Research and Quality (AHRQ) and the National Center for Health Statistics (NCHS). More information about the MEPS-HC can be found on the MEPS website at https://www.meps.ahrq.gov/.
The authors thank Zhengyi Fang for independent data validation.
The following methodology reports contain information on the survey and sample designs for the MEPS-HC and MEPS-Medical Provider Component (MEPS-MPC). Data collected in these two components are jointly used to derive MEPS healthcare expenditure data.
Cohen, J. Design and Methods of the Medical Expenditure Panel Survey Household Component. MEPS Methodology Report #1. Rockville, MD: Agency for Health Care Policy and Research; July 1997. http://www.meps.ahrq.gov/mepsweb/data_files/publications/mr1/mr1.pdf
Ezzati-Rice, TM, Rohde, F, Greenblatt, J. Sample Design of the Medical Expenditure Panel Survey Household Component, 1998-2007. Methodology Report #22. Rockville, MD: Agency for Healthcare Research and Quality; March 2008. https://www.meps.ahrq.gov/data_files/publications/mr22/mr22.shtml
Machlin, SR, Chowdhury, SR, Ezzati-Rice, T, DiGaetano, R, Goksel, H, Kashihara, D. et al. Estimation Procedures for the Medical Expenditure Panel Survey Household Component. Methodology Report #24. Rockville, MD: Agency for Healthcare Research and Quality; Sept 2010. https://www.meps.ahrq.gov/data_files/publications/mr24/mr24.shtml
Stagnitti, MN, Beauregard, K, Solis, A. Design, Methods, and Field Results of the Medical Expenditure Panel Survey Medical Provider Component (MEPS MPC)-2006 Data Year. Rockville, MD: Agency for Healthcare Research and Quality; Nov 2008. http://www.meps.ahrq.gov/mepsweb/data_files/publications/mr23/mr23.pdf
References
1 Office of Disease Prevention and Health Promotion (ODPH). Healthy People 2030: Increase use of the oral health care system-OH-08. U.S. Department of Health and Human Services. https://health.gov/healthypeople/objectives-and-data/browse-objectives/health-care/increase-use-oral-health-care-system-oh-08 . Accessed February 27, 2024.
2 Czeisler, M. É., Marynak, K., Clarke, K. E., Salah, Z., Shakya, I., Thierry, J. M., Ali, N., McMillan, H., Wiley, J. F., Weaver, M.D., & Czeisler, C. A. Delay or avoidance of medical care because of COVID-19-related concerns–United States, June 2020. Morbidity and Mortality Weekly Report. 2020 Sep 11;69(36):1250-1257. doi: 10.15585/mmwr.mm6936a4.
3 Zuvekas, S. H., & Kashihara, D. The impacts of the COVID-19 pandemic on the Medical Expenditure Panel Survey. American Journal of Public Health. 2021 Dec;111(12):2157-2166. doi: 10.2105/AJPH.2021.306534.
4 Agency for Healthcare Research and Quality (AHRQ). Using appropriate price indices for analyses of health care expenditures or income across multiple years. U.S. Department of Health and Human Services. https://meps.ahrq.gov/about_meps/Price_Index.shtml. Accessed February 27, 2024.
Suggested Citation
Olaisen RH, Manski RJ. Dental Utilization and Expenditures, U.S. Civilian Noninstitutionalized Population Aged 2 and Older, 2019-2021. Statistical Brief #555. Rockville, MD; Agency for Healthcare Research and Quality; March 2024. https://meps.ahrq.gov/data_files/publications/st555/stat555.shtml
AHRQ welcomes questions and comments from readers of this publication who are interested in obtaining more information about access, cost, use, financing, and quality of healthcare in the United States. We also invite you to tell us how you are using this Statistical Brief and other MEPS data and tools and to share suggestions on how MEPS products might be enhanced to further meet your needs. Please email us at MEPSProjectDirector@ahrq.hhs.gov or send a letter to the address below:
Joel W. Cohen, PhD, Director
Center for Financing, Access and Cost Trends
Agency for Healthcare Research and Quality
5600 Fishers Lane, Mailstop 07W41A
Rockville, MD 20857
Figure 1. Number of people with dental visits, overall and by age groups, 2019-2021
| Population by Age | 2019 | 2020 | 2021 | Percentage Change 2020 vs. 2019 |
|---|---|---|---|---|
| All (aged 2 and older) | 149,476,068 | 130,865,424 | 143,028,479 | -12.5 |
| 2-17 | 37,830,457 | 31,758,412 | 36,041,619 | -16.1 |
| 18-64 | 82,911,208 | 71,780,408 | 77,581,733 | -13.4 |
| 65-74 | 17,654,511 | 16,636,160 | 17,872,382 | -5.8 |
| 75 and older | 11,079,892 | 10,690,444 | 11,532,745 | -3.5 |
Source: Agency for Healthcare Research and Quality, Center for Financing, Access and Cost
Trends, Household
Component of the Medical Expenditure Panel Survey, Public Use Files, 2019-2021.
Figure 2. Total U.S. dental expenditures (constant 2021 dollars in billions), overall and by age groups, 2019-2021
| Population by Age | 2019 | 2020 | 2021 | Percentage Change 2020 vs. 2019 |
|---|---|---|---|---|
| All (aged 2 and older) | $129,185,212,903 | $108,424,460,585 | $126,876,299,215 | -16.1 |
| 2-17 | $28,166,478,569 | $22,760,607,694 | $25,970,560,442 | -19.2 |
| 18-64 | $68,871,662,381 | $57,210,868,049 | $65,639,168,157 | -16.9 |
| 65-74 | $18,995,848,838 | $16,546,173,854 | $20,915,415,943 | -12.9 |
| 75 and older | $13,151,223,115 | $11,906,810,988 | $14,351,154,673 | -9.5 |
Source: Agency for Healthcare Research and Quality, Center for Financing, Access and Cost Trends, Household Component of the Medical Expenditure Panel Survey, Public Use Files, 2019-2021.
Figure 3. Average annual dental expenditures among persons with any dental visits (constant 2021 dollars), overall and by age groups, 2019-2021
| Population by Age | 2019 | 2020 | 2021 |
|---|---|---|---|
| All (aged 2 and older) | $864 | $829 | $887 |
| 2-17 | $745 | $717 | $721 |
| 18-64 | $831 | $797 | $846 |
| 65-74 | $1,076 | $995 | $1,170 |
| 75 and older | $1,187 | $1,114 | $1,244 |
Source: Agency for Healthcare Research and Quality, Center for Financing, Access and Cost Trends, Household Component of the Medical Expenditure Panel Survey, Public Use Files, 2019-2021.
Figure 4. Average annual number of dental visits among persons with any dental visits, overall and by age groups, 2019-2021
| Population by Age | 2019 | 2020 | 2021 |
|---|---|---|---|
| All (aged 2 and older) | 2.3 | 2.1 | 2.3 |
| 2-17 | 2.3 | 2.1 | 2.3 |
| 18-64 | 2.1 | 1.9 | 2.1 |
| 65-74 | 2.6 | 2.3 | 2.6 |
| 75 and older | 2.7 | 2.4 | 2.6 |
Source: Agency for Healthcare Research and Quality, Center for Financing, Access and Cost Trends, Household Component of the Medical Expenditure Panel Survey, Public Use Files, 2019-2021.
Figure 5. U.S. dental visits, by month and year, 2019-2021
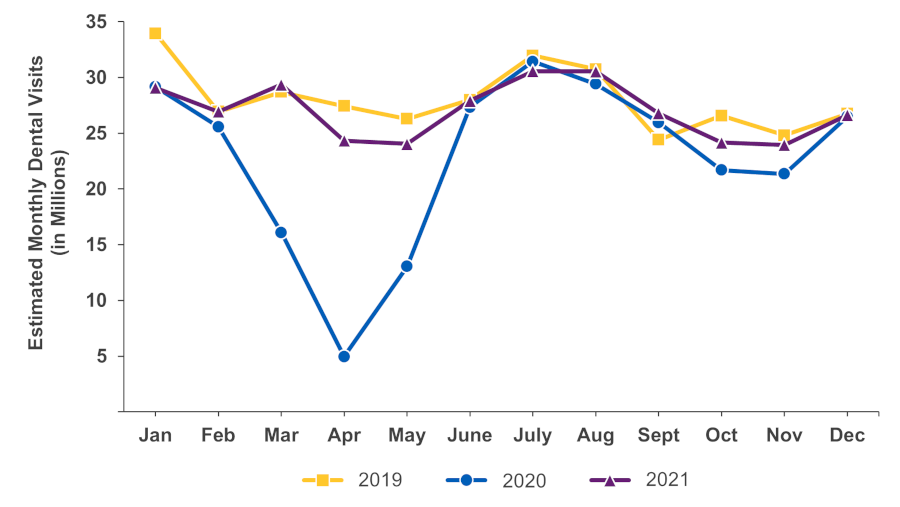
| Interval | 2019 | 2020 | 2021 | Percentage Change 2020 vs. 2019 |
|---|---|---|---|---|
| Full year | 336,488,103 | 272,486,687 | 324,287,579 | -19.0 |
| January | 33,946,651 | 29,151,252 | 29,069,144 | -14.1 |
| February | 26,941,777 | 25,582,853 | 26,929,592 | -5.0 |
| March | 28,687,915 | 16,078,150 | 29,365,605 | -44.0 |
| April | 27,423,542 | 4,957,799 | 24,332,173 | -81.9 |
| May | 26,287,038 | 13,047,987 | 24,051,642 | -50.4 |
| June | 27,988,812 | 27,338,804 | 27,906,902 | -2.3 |
| July | 31,970,936 | 31,419,864 | 30,568,363 | -1.7 |
| August | 30,735,761 | 29,425,048 | 30,552,474 | -4.3 |
| September | 24,402,842 | 25,960,303 | 26,785,377 | 6.4 |
| October | 26,560,277 | 21,699,901 | 24,150,474 | -18.3 |
| November | 24,806,029 | 21,342,589 | 23,955,080 | -14.0 |
| December | 26,736,522 | 26,482,136 | 26,620,755 | -1.0 |
Source: Agency for Healthcare Research and Quality, Center for Financing, Access and Cost Trends, Household Component of the Medical Expenditure Panel Survey, Public Use Files, 2019-2021.


