
|
|
|
Font Size:
|
||||
|
|
|
|
||||
Prevalence of Long COVID Among Adults Who Have Ever Had COVID-19, by Selected Demographic and Socioeconomic Characteristics, U.S. Civilian Noninstitutionalized Population, Spring 2023
Statistical Brief #557 | September 2024 | Rebecca Ahrnsbrak, MPS, and Zhengyi Fang, MS
Highlights
Among adults who reported ever having COVID-19:- 13.7 percent reported ever having long COVID.
- Women were more likely than men to report ever having long COVID (16.5% vs. 10.5%).
- Adults aged 18-34 were less likely than all other age groups to report ever having long COVID (9.8% vs. 13.5%-17.9%).
- Adults living in high-income households were less likely to report ever having long COVID (11.0%) than those living in middle-income households (15.6%), low-income or near poor households (17.4%), and those living in poor households (17.2%).
- Adults living in a metropolitan statistical area reported lower rates of ever having long COVID than those living outside of a metropolitan statistical area (12.7% vs. 19.7%).
Introduction
Long COVID, also known as Post-COVID Conditions, was first reported anecdotally in April 2020 and has continued to cause significant suffering and disability in the wake of the COVID-19 pandemic.1 The Centers for Disease Control and Prevention (CDC) defines long COVID as "signs, symptoms, and conditions that continue or develop after acute COVID-19 infection" and notes that long COVID encompasses a wide range of symptoms that can last for weeks, months, or years.2 The Medical Expenditure Panel Survey (MEPS) estimates that 6.9 percent of adults have ever had long COVID as of early 2023 and finds differences by sex, age group, race and ethnicity, and preexisting chronic conditions.3 Similarly, the 2022 National Health Interview Survey estimates that 6.9 percent of adults in the United States ever had long COVID, with differences observed by sex, age group, race and ethnicity, poverty status, and urbanicity.4 An analysis of the 2022 Behavioral Risk Factor Surveillance System estimates that 6.4 percent of adults in the United States ever had long COVID and finds variation by state.5
This Statistical Brief presents prevalence estimates of long COVID specifically among the subset of adults who reported ever having COVID-19 by selected demographic and socioeconomic characteristics for the U.S. civilian noninstitutionalized population as of spring 2023. Questions about long COVID were added to the 2023 MEPS spring interview rounds. The estimates are based on the 2022 MEPS-Household Component (MEPS-HC) full-year public use file. Although these measures are in the 2022 full-year data file, the interviews were fielded in spring 2023, which is the final round of data collection for th2022 MEPS sample, and asked respondents about whether sample members ever had COVID-19 and long COVID. Thus, these estimates represent a lifetime prevalence estimate as of spring 2023. All differences between estimates discussed in the text are statistically significant at the 0.05 level unless otherwise noted.
Findings
Overall and by Sex (figure 1)
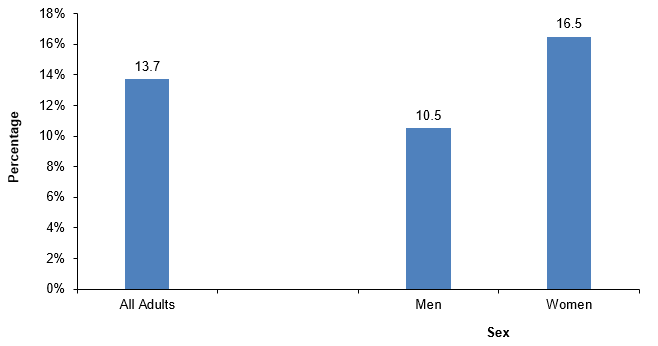
Approximately half (50.4%) of all adults reported ever having had COVID-19 as of early 2023. Among these adults, 13.7 percent reported ever having long COVID.
Among those who had ever had COVID-19, adult women were more likely to report ever having long COVID than adult men (16.5% vs. 10.5%).
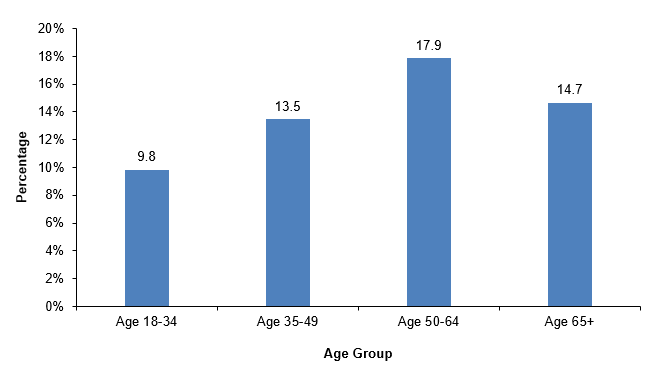
Age (figure 2)
Among adults who had ever had COVID-19, those aged 18-34 were less likely (9.8%) than all other age groups to report ever having long COVID (13.5% for adults aged 35-49, 17.9% for adults aged 50-64, and 14.7% for adults aged 65 or older).
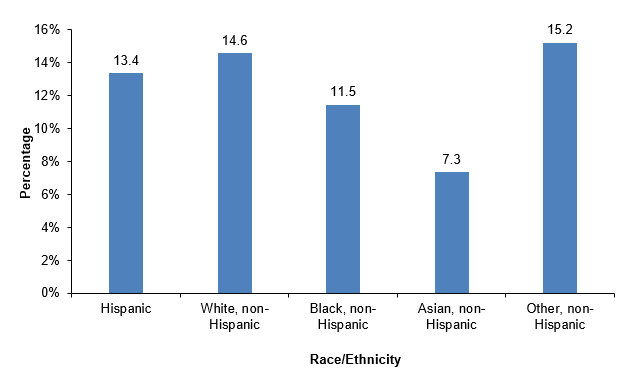
Race/Ethnicity (figure 3)
The prevalence of ever having long COVID among adults who had ever had COVID-19 was higher for non-Hispanic White adults (14.6%) than for non-Hispanic Asian adults (7.3%) and non-Hispanic Black adults (11.5%).
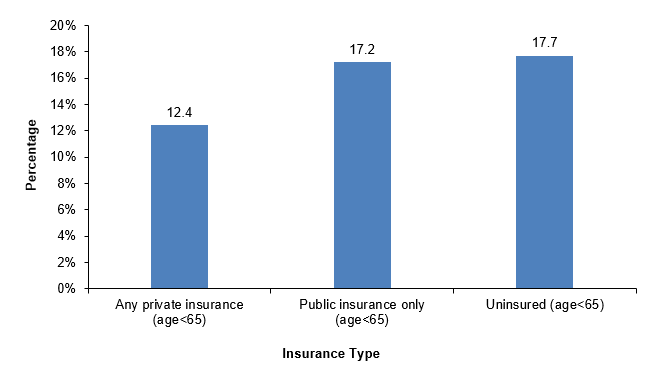
Health Insurance (figure 4)
Among adults who had ever had COVID-19, those under age 65 who had any private insurance had lower rates of long COVID (12.4%) compared to adults under age 65 who had only public insurance (17.2%) and uninsured adults under age 65 (17.7%).
Poverty (figure 5)
Adults who had ever had COVID-19 who were living in high-income households had lower rates of ever having long COVID (11.0%) than those who were living in middle-income households (15.6%), low-income or near-poor households (17.4%), and poor households (17.2%).
Region (figure 6)
Adults living in the Northeast who had ever had COVID-19 were less likely to have ever had long COVID than those living in the Midwest (11.9% vs. 15.5%).
Metropolitan Statistical Area (figure 7)
Among adults who had ever had COVID-19, those living in a metropolitan statistical area (MSA) were less likely to have ever had long COVID (12.7%) than adults not living in an MSA (19.7%).
Data Source
The estimates reported in this Brief are based on data from the 2022 Full Year Population Characteristics File, which is available for download at https://meps.ahrq.gov/data_stats/download_data_files.jsp.
Definitions
COVID-19
Household respondents were asked whether each sample member had ever had COVID-19. Responses of "yes" to this question resulted in sample members being classified as ever having COVID-19.
Long COVID
For sample members who were classified as ever having had COVID-19, respondents were asked whether those sample members had symptoms lasting 3 months or longer that they did not have prior to having COVID-19. Responses of "yes" to this question resulted in being classified as ever having had long COVID. Sample members with no reported prior COVID-19 infection were not asked questions about long COVID and were treated as never having had long COVID.
Age
Age was defined as the reported age of the sample member at the time of their spring 2023 interview (round 9 of panel 24, round 5 of panel 26, and round 3 of panel 27).
Race/Ethnicity
Classification by race/ethnicity was based on information reported for each family member. First, respondents were asked if the person's main national origin or ancestry was Puerto Rican; Cuban; Mexican, Mexican American, or Chicano; other Latin American; or other Spanish. All persons whose main national origin or ancestry was reported in one of these Hispanic groups, regardless of racial background, were classified as Hispanic. All other persons were classified according to their reported race. For this analysis, the following classification by race and ethnicity was used: Hispanic, non-Hispanic Black, non-Hispanic White, non-Hispanic Asian, and non-Hispanic other. The "other" category includes American Indian, Alaska Native, other race, and multiple races.
Health Insurance
Health insurance was defined as any private insurance if the sampled person was reported to have any private health insurance coverage at any point during the year regardless of whether they also had other types of health insurance. "Public only" was assigned if the only sources of health insurance coverage reported for a sampled member during the year were public sources. Public sources include Medicare, TRICARE/CHAMPVA, Medicaid, the State Children's Health Insurance Program (SCHIP), and other public hospital/physician coverage. The Indian Health Service is not included as a public source of coverage in this classification. "Uninsured" refers to sample members who had no reported form of health insurance coverage for the entire year.
Poverty Status
Each sample member was classified according to the total annual income of their family. Possible sources of income included annual earnings from wages, salaries, bonuses, tips, and commissions; business and farm gains and losses; unemployment and Workers' Compensation; interest and dividends; alimony, child support, and other private cash transfers; private pensions, individual retirement account withdrawals, Social Security benefits, and Department of Veterans Affairs payments; Supplemental Security Income and cash welfare payments from public assistance, and Aid to Families with Dependent Children; gains or losses from estates, trusts, partnerships, S corporations, rent, and royalties; and a small amount of "other" income. Poverty status is the ratio of family income to the corresponding federal poverty thresholds, which control for family size and the age of the head of the family. Categories are defined as follows:
- Poor: Household income below 100 percent of the federal poverty line
- Low income or near poor: 100 percent to less than 200 percent of the poverty line
- Middle income: 200 percent to less than 400 percent of the poverty line
- High income: Greater than or equal to 400 percent of the poverty line
Region
Each MEPS household was classified as belonging to one of four regions as defined by the U.S. Census Bureau at the time of their spring 2023 interview:
- Northeast: Connecticut, Maine, Massachusetts, New Hampshire, New Jersey, New York, Pennsylvania, Rhode Island, and Vermont
- Midwest: Indiana, Illinois, Iowa, Kansas, Michigan, Minnesota, Missouri, Nebraska, North Dakota, Ohio, South Dakota, and Wisconsin
- South: Alabama, Arkansas, Delaware, District of Columbia, Florida, Georgia, Kentucky, Louisiana, Maryland, Mississippi, North Carolina, Oklahoma, South Carolina, Tennessee, Texas, Virginia, and West Virginia
- West: Alaska, Arizona, California, Colorado, Hawaii, Idaho, Montana, Nevada, New Mexico, Oregon, Utah, Washington, and Wyoming
Metropolitan Statistical Area
The MSA variable was based on the location of the household at the time of their spring 2023 interview and reflects the most recent delineations of MSAs established by the Office of Management and Budget (OMB). An MSA contains a core urban area with a population of 50,000 or more. All counties that are not part of an MSA are considered rural.
About MEPS
The MEPS-HC collects nationally representative data on healthcare use, expenditures, sources of payment, and insurance coverage for the U.S. civilian noninstitutionalized population. The MEPS-HC is cosponsored by the Agency for Healthcare Research and Quality (AHRQ) and the National Center for Health Statistics (NCHS). More information about the MEPS-HC can be found at https://meps.ahrq.gov/.
For a detailed description of the MEPS-HC survey design, sample design, and methods used to minimize sources of nonsampling error, see the following publications:
Cohen, J. Design and Methods of the Medical Expenditure Panel Survey Household Component. MEPS Methodology Report No. 1. AHCPR Pub. No. 97-0026. 1997. Agency for Health Care Policy and Research (AHCPR), Rockville, MD. https://meps.ahrq.gov/data_files/publications/mr1/mr1.pdf
Ezzati-Rice, T. M., Rohde, F., and Greenblatt, J. Sample Design of the Medical Expenditure Panel Survey Household Component, 1998-2007. Methodology Report No. 22. March 2008. Agency for Healthcare Research and Quality, Rockville, MD. https://meps.ahrq.gov/mepsweb/data_files/publications/mr22/mr22.pdf
Machlin, S. R., Chowdhury, S. R., Ezzati-Rice, T., DiGaetano, R., Goksel, H., Wun, L.-M., Yu, W., and Kashihara, D. Estimation Procedures for the Medical Expenditure Panel Survey Household Component. Methodology Report #24. September 2010. Agency for Healthcare Research and Quality, Rockville, MD. https://meps.ahrq.gov/data_files/publications/mr24/mr24.shtml
Stagnitti, M. N., Beauregard, K., and Solis, A. Design, Methods, and Field Results of the Medical Expenditure Panel Survey Medical Provider Component (MEPS MPC)—2006 Calendar Year Data. Methodology Report No. 23. November 2008. Agency for Healthcare Research and Quality, Rockville, MD. https://meps.ahrq.gov/mepsweb/data_files/publications/mr23/mr23.pdf
Zuvekas SH, Kashihara D. The impacts of the COVID-19 pandemic on the Medical Expenditure Panel Survey. Am J Public Health. 2021;111(12):2157-2166. doi: 10.2105/AJPH.2021.306534
References
1 U.S. Department of Health and Human Services, Office of the Assistant Secretary for Health. National Research Action Plan on Long COVID. 2022. https://www.covid.gov/sites/default/files/documents/National-Research-Action-Plan-on-Long-COVID-08012022.pdf. Accessed August 23, 2024.
2 Centers for Disease Control and Prevention. Long COVID basics. U.S. Department of Health and Human Services. https://www.cdc.gov/coronavirus/2019-ncov/long-term-effects/index.html. Accessed August 23, 2024.
3 Fang, Z., Ahrnsbrak, R., & Rekito, A. Evidence mounts that about 7% of US adults have had long COVID. JAMA. 2024 Jul 2;332(1):5-6. doi: 10.1001/jama.2024.11370
4 Adjaye-Gbewonyo, D., Vahratian, A., Perrine, C. G., & Bertolli, J. Long COVID in Adults: United States, 2022. NCHS Data Brief, no 480. Hyattsville, MD: National Center for Health Statistics. 2023. https://www.cdc.gov/nchs/products/databriefs/db480.htm. Accessed: August 23, 2024.
5 Ford, N. D., Agedew, A., Dalton, A. F., Singleton, J., Perrine, C. G., & Saydah, S. Notes from the field: Long COVID prevalence among adults—United States, 2022. Morbidity and Mortality Weekly Report. 2024 Feb 15;73:135-136. doi: 10.15585/mmwr.mm7306a4.
Suggested Citation
Ahrnsbrak, RD, Fang, Z. Prevalence of Long COVID Among Adults Who Have Ever Had COVID-19, by Selected Demographic and Socioeconomic Characteristics, U.S. Civilian Noninstitutionalized Population, Spring 2023. Statistical Brief #557. AHRQ Publication No. 24-0083-1-EF. Rockville, MD: Agency for Healthcare Research and Quality; September 2024. https://meps.ahrq.gov/data_files/publications/st557/stat557.shtml
AHRQ welcomes questions and comments from readers of this publication who are interested in obtaining more information about access, cost, use, financing, and quality of healthcare in the United States. We also invite you to tell us how you are using this Statistical Brief and other MEPS data and tools and to share suggestions on how MEPS products might be enhanced to further meet your needs. Please email us at MEPSProjectDirector@ahrq.hhs.gov or send a letter to the address below:
Joel W. Cohen, PhD, Director
Center for Financing, Access, and Cost Trends
Agency for Healthcare Research and Quality
5600 Fishers Lane, Mailstop 07W41A
Rockville, MD 20857
Figure 1. Percentage of adults who ever had long COVID among adults who ever had COVID-19, overall and by sex
| Sex | Percentage of adults who ever had long COVID among adults who ever had COVID-19 |
|---|---|
| Overall | 13.7 |
| Men | 10.5 |
| Women | 16.5 |
Source: Agency for Healthcare Research and Quality, Medical Expenditure Panel Survey, Household Component, 2022.
Figure 2. Percentage of adults who ever had long COVID among adults who ever had COVID-19, by age
| Age group | Percentage of adults who ever had long COVID among adults who ever had COVID-19 |
|---|---|
| Age 18-34 | 9.8 |
| Age 35-49 | 13.5 |
| Age 50-64 | 17.9 |
| Age 65+ | 14.7 |
Source: Agency for Healthcare Research and Quality, Medical Expenditure Panel Survey, Household Component, 2022.
Figure 3. Percentage of adults who ever had long COVID among adults who ever had COVID-19, by race/ethnicity
| Race/ethnicity | Percentage of adults who ever had long COVID among adults who ever had COVID-19 |
|---|---|
| Hispanic | 13.4 |
| Non-Hispanic White | 14.6 |
| Non-Hispanic Black | 11.5 |
| Non-Hispanic Asian | 7.3 |
| Non-Hispanic Other | 15.2 |
Source: Agency for Healthcare Research and Quality, Medical Expenditure Panel Survey, Household Component, 2022.
Figure 4. Percentage of adults who ever had long COVID among adults who ever had COVID-19, by health insurance coverage
| Health Insurance Coverage | Percentage of adults who ever had long COVID among adults who ever had COVID-19 |
|---|---|
| Any private insurance (age<65) | 12.4 |
| Public insurance only (age<65) | 17.2 |
| Uninsured (age<65) | 17.7 |
Source: Agency for Healthcare Research and Quality, Medical Expenditure Panel Survey, Household Component, 2022.
Figure 5. Percentage of adults who ever had long COVID among adults who ever had COVID-19, by poverty status
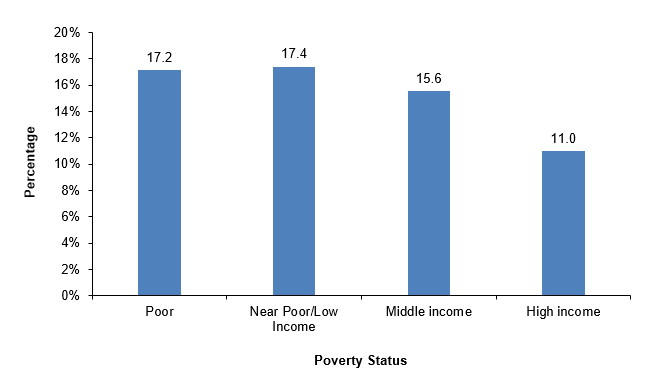
| Poverty status | Percentage of adults who ever had long COVID among adults who ever had COVID-19 |
|---|---|
| Poor | 17.2 |
| Near poor/low income | 17.4 |
| Middle income | 15.6 |
| High income | 11.0 |
Source: Agency for Healthcare Research and Quality, Medical Expenditure Panel Survey, Household Component, 2022.
Figure 6. Percentage of adults who ever had long COVID among adults who ever had COVID-19, by region
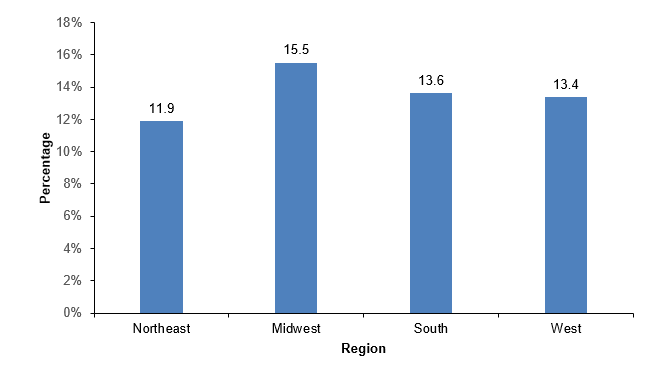
| Region | Percentage of adults who ever had long COVID among adults who ever had COVID-19 |
|---|---|
| Northeast | 11.9 |
| Midwest | 15.5 |
| South | 13.6 |
| West | 13.4 |
Source: Agency for Healthcare Research and Quality, Medical Expenditure Panel Survey, Household Component, 2022.
Figure 7. Percentage of adults who ever had long COVID among adults who ever had COVID-19, by MSA
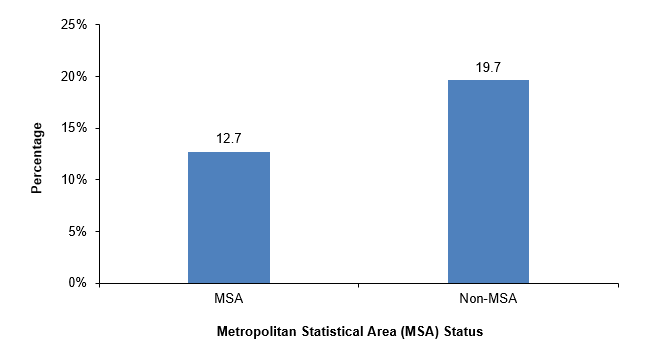
| MSA | Percentage of adults who ever had long COVID among adults who ever had COVID-19 |
|---|---|
| MSA | 12.7 |
| Non-MSA | 19.7 |
Source: Agency for Healthcare Research and Quality, Medical Expenditure Panel Survey, Household Component, 2022.